
System profiling, app tracing and trace analysis
Open-Source · Portable · Efficient
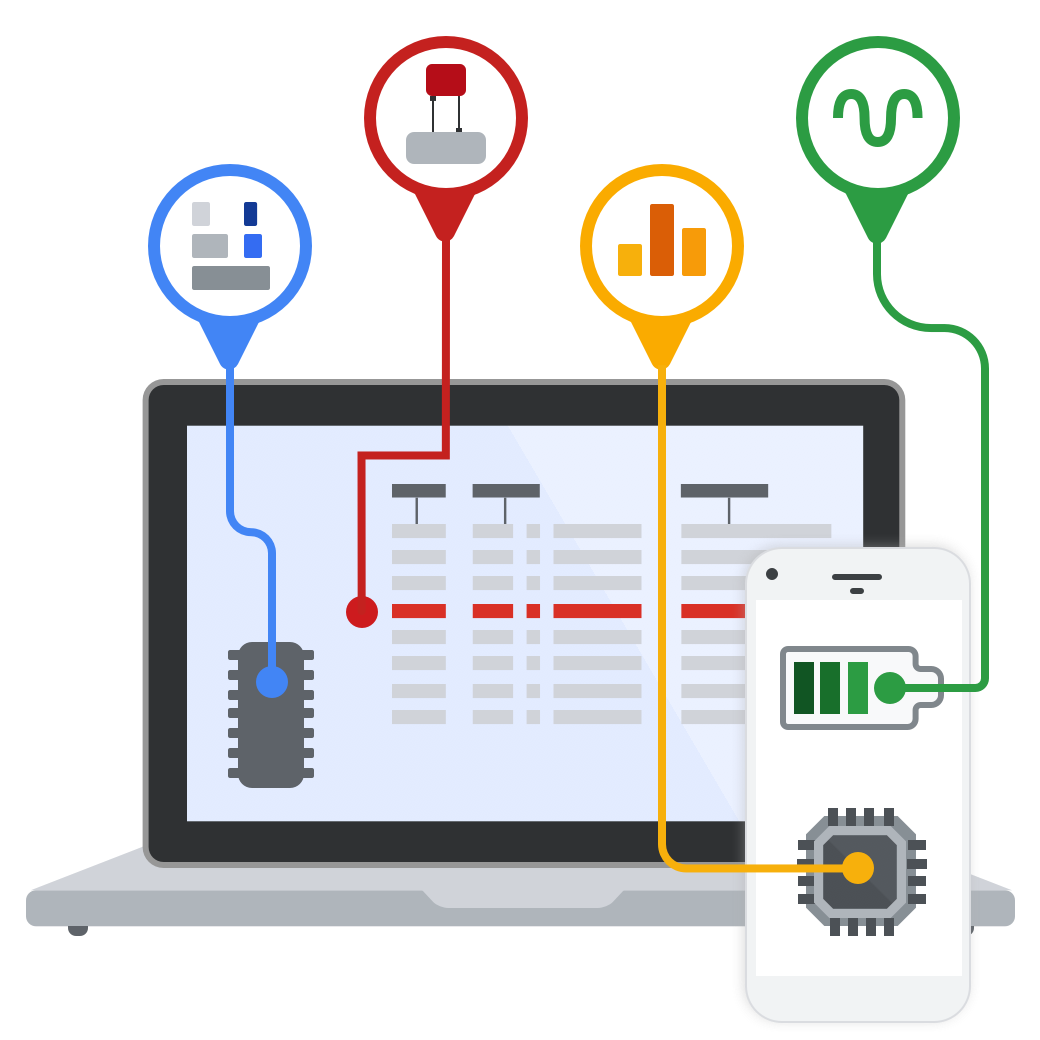
System-wide profiling for Linux and Android
Linux kernel tracing
Capture high frequency ftrace data: scheduling activity, task switching latency, CPU frequency and much more
Userspace profilers and extra probes
Native heap profiling, Java heap profiling, pollers for /proc stat files
Built into Android
Part of the platform since Android 9 Pie, runs on Linux as well
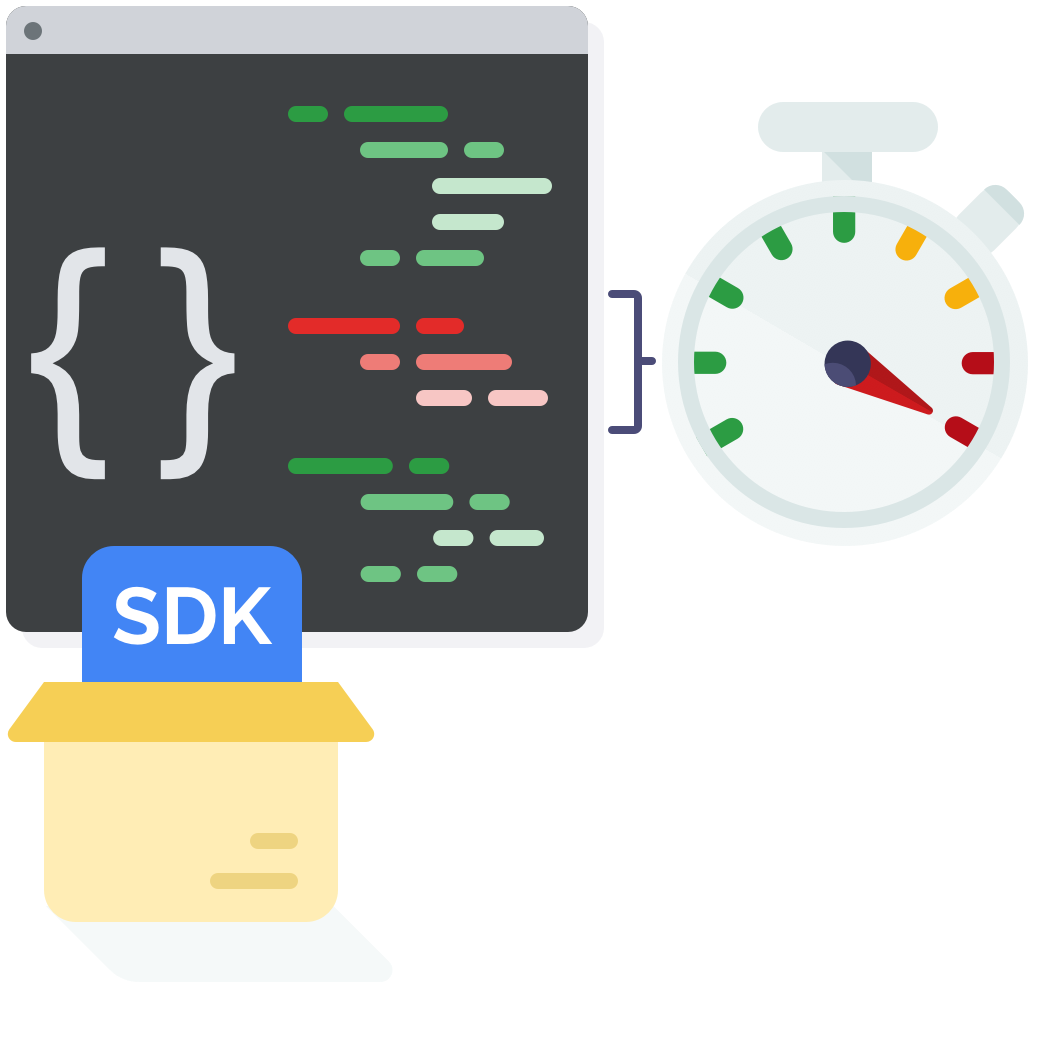
App Tracing
Efficient trace point instrumentation
Log your C++ app’s activity with high throughput, low overhead trace points
Structured and configurable events
Define custom protobuf messages to represent strongly-typed app-specific information, trace only what you need
Integrated with system-wide tracing
Correlate your app’s state with system-wide profiling data on the same timeline
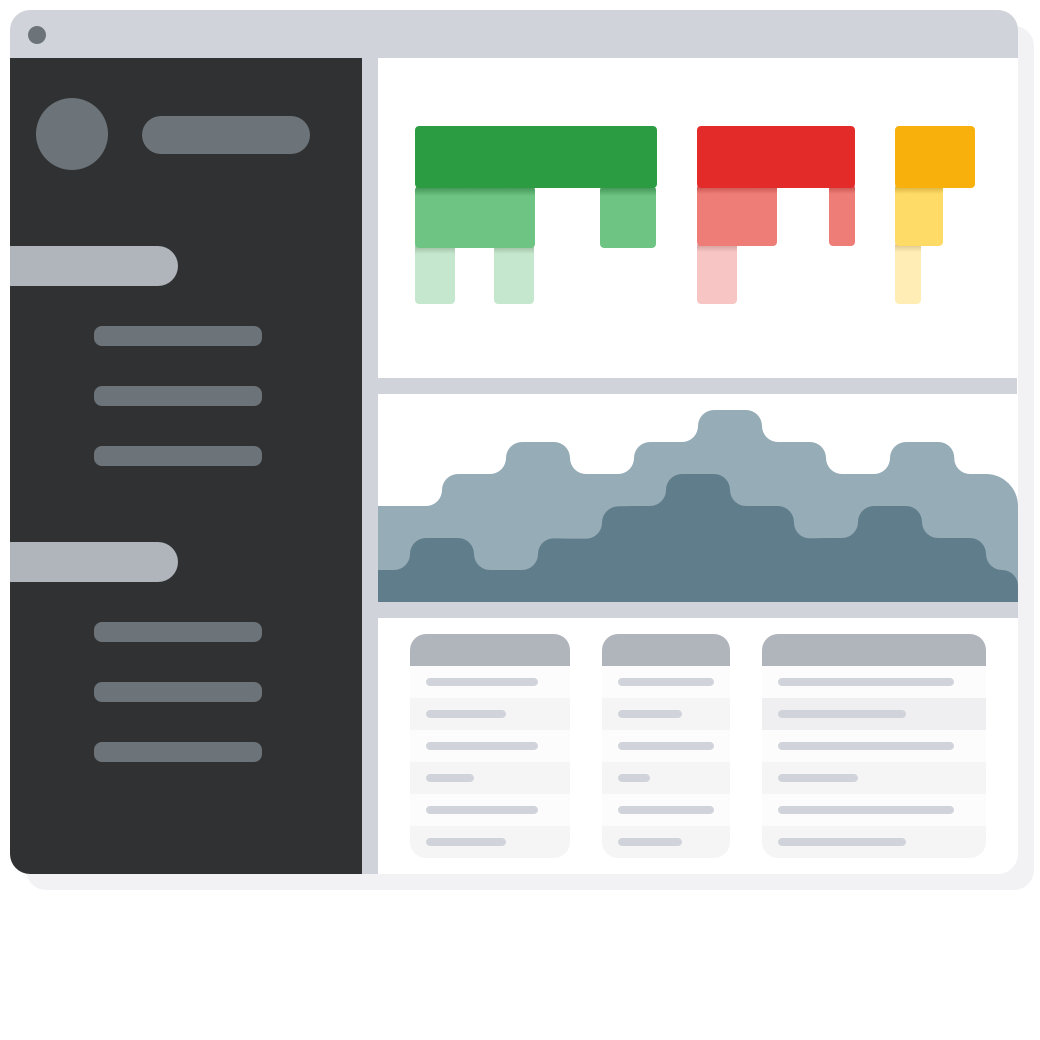
Trace Viewer
Interactive trace exploration
Record, view and process trace data with the Perfetto UI
Supports popular trace format files
TraceEvent JSON, Android systrace, ftrace text output
Runs fully in your browser
No server interaction involved, works even if you are offline
Trace Analysis
SQL-based trace model
Trace processor ingests traces and exposes a SQLite-based interface to access the contents of the trace, both via shell and UI
Large trace analysis
Supports traces up to tens of GBs
Interoperable
Can import and export popular trace formats: Chromium JSON trace format, Android Systrace, ftrace, CSV