
Perfetto v56

Perfetto v56.0 is out! This release adds more to the Heap Dump Explorer, a round of UI improvements, easier-to-read multi-machine traces, kernel-assisted stack sampling in traced_perf, and a few new SDK knobs.
🔥 Heap Dump Explorer: flamegraphs & bitmaps
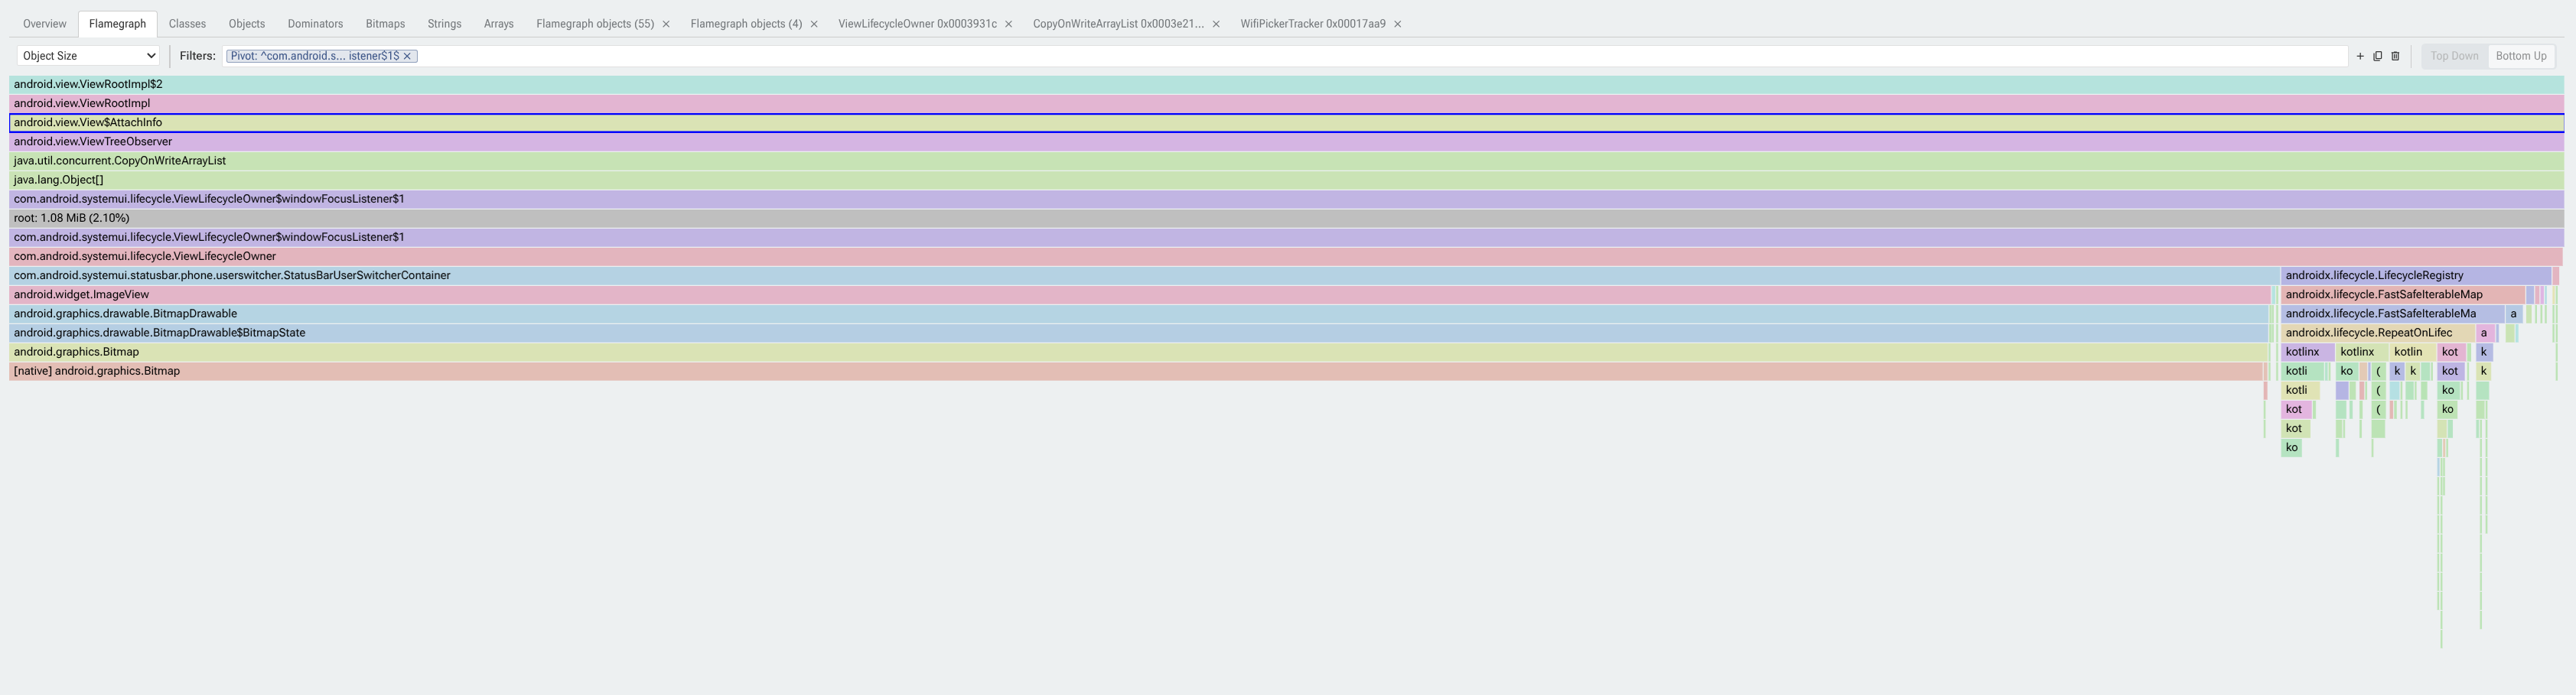
The Heap Dump Explorer now has a built-in flamegraph viewer, so you can jump between the class/object/dominator views and a flamegraph without leaving the page. There's also a new bitmap metadata page for bitmaps captured in Android heap dumps, and a feature flag to control whether the explorer auto-opens on traces with heap-graph data.
Heads up: the explorer's setting ID is now prefixed with
com.android, so if you'd saved a setting before you'll need to re-enable it.
Under the hood, Android heap dumps now include process and package metadata, and Trace Processor exposes bitmap metadata via a new table in the standard library. Java soft references are treated as strong during reachability analysis, and the HPROF parser no longer aborts when a sub-record straddles a segment boundary.
🖥️ UI
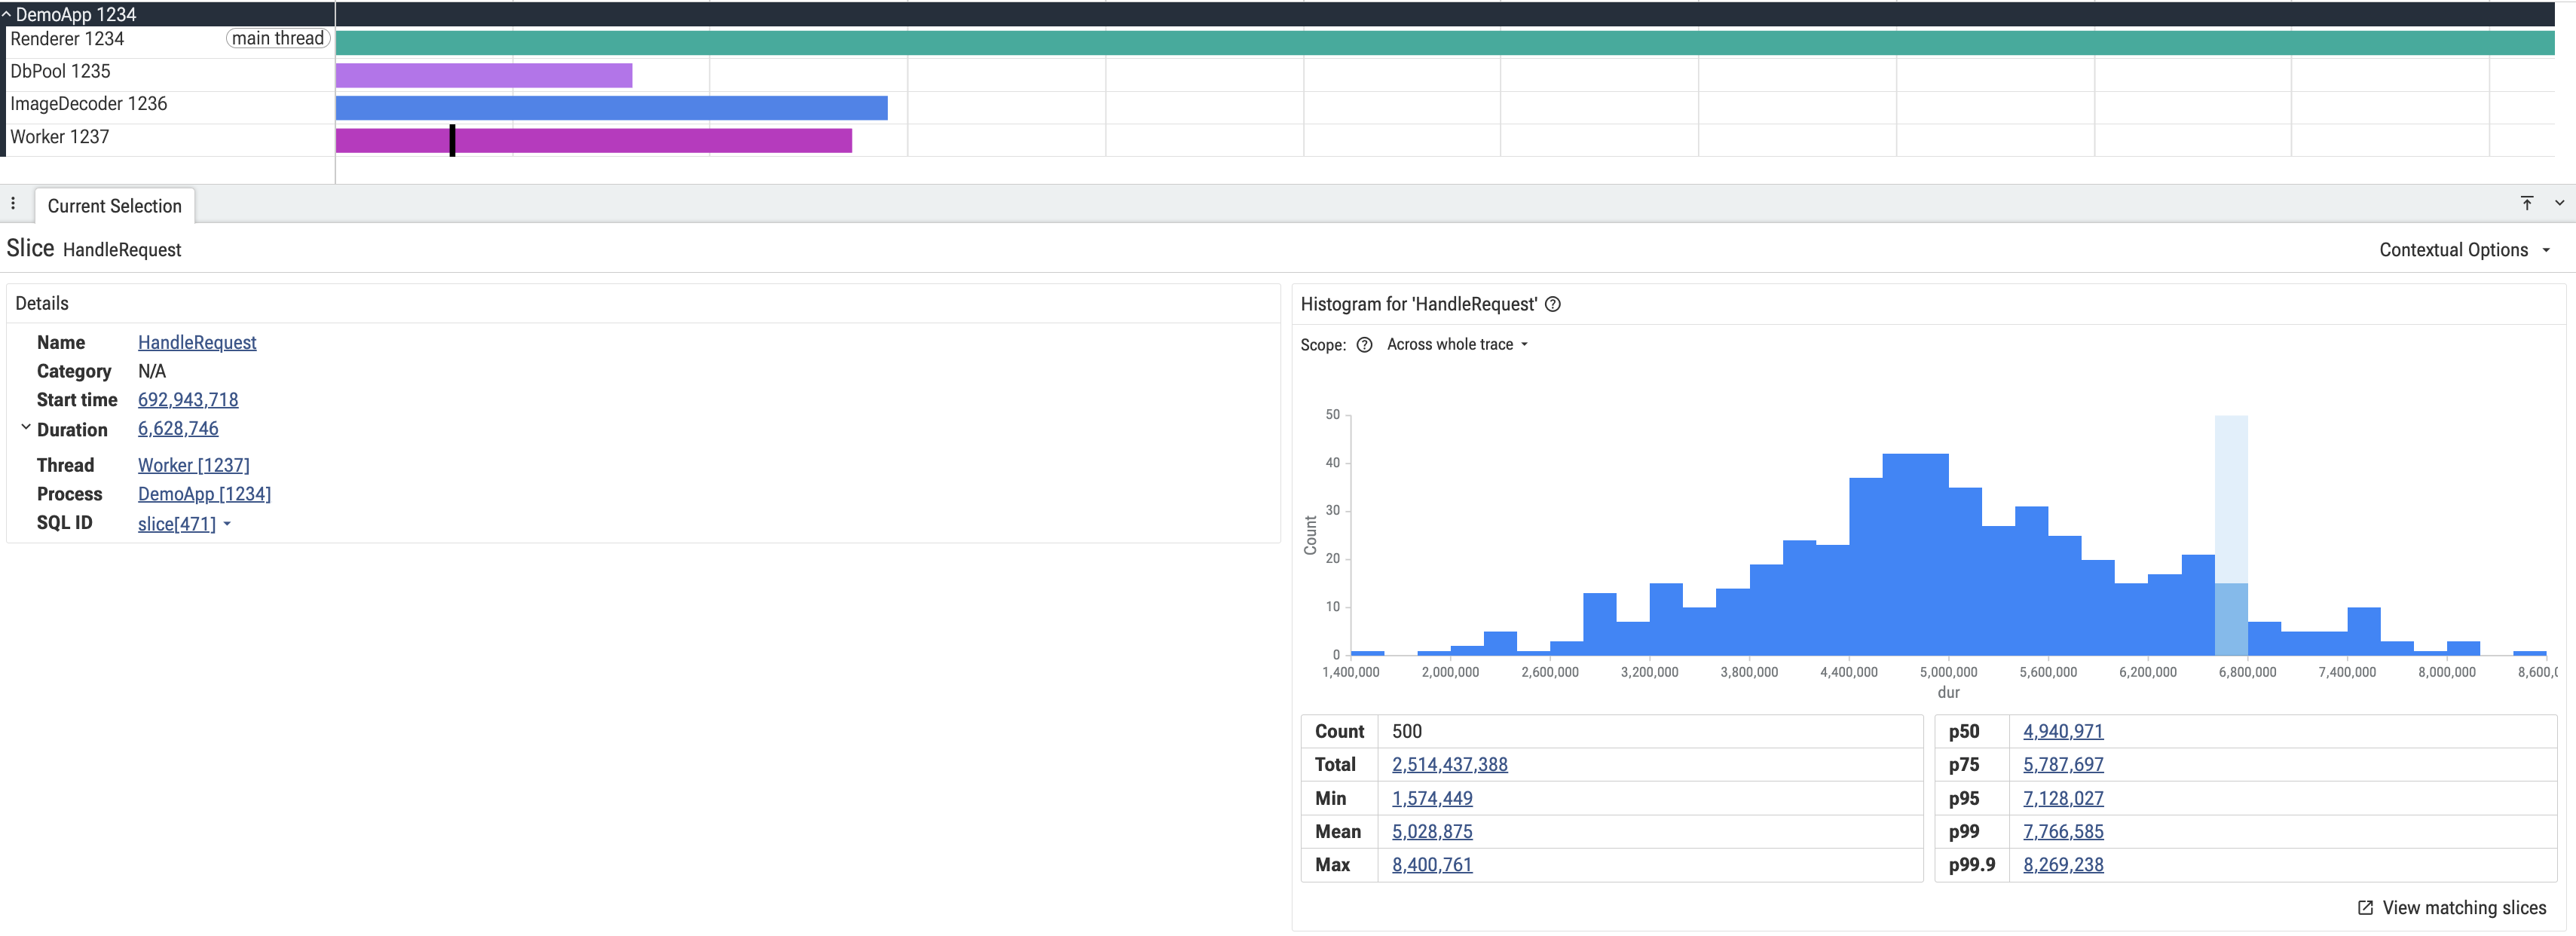
Selecting a slice now shows a distribution histogram of matching slices, with the selected slice highlighted and a one-click shortcut to a Debug Track.
- Hover previews on screenshot tracks.
- Trace start time and duration in the timeline header.
- A matching-slice action on selection flamegraphs and a scroll-to-root command for top-down/bottom-up/pivot views.
- SQL formatting and per-query column refresh on the Query page.
- Faster rendering for incomplete-slice fetches and quicker
trace_processorworker startup. - Memcg reclaim tracks, now grouped under Memory.
- Details panels and process navigation in the AndroidStartup and AndroidAnr plugins.
- Fixed pinned tracks getting unpinned when the timeline loaded.
🌐 Multi-machine tracing
Traces gathered across machines with traced_relay are easier to attribute:
TracingServiceStatenow carriesmachine_idandmachine_name, andperfetto --query/--query-rawshow aMACHINEcolumn when more than one machine is involved. Host-only output is unchanged.- The
statstable reports per-machine and per-trace statistics.
PRODUCER PROCESSES CONNECTED:

ID   PID   UID   FLAGS   MACHINE     NAME                  SDK
==   ===   ===   =====   =======     ====                  ===
1    0     501           guest-B     example_system_wide   Perfetto v56.0
2    0     501           guest-A     example_system_wide   Perfetto v56.0
3    -1    0             (host)      example_system_wide   Perfetto v56.0
⚡ Kernel-assisted stack sampling
traced_perf can now use in-kernel frame pointer unwinding for faster stack sampling on callstack-heavy workloads.
🦊 Firefox Profiler markers
Markers from the Firefox Profiler now import as slices, so you can line them up against the rest of the trace.
🧰 SDK
- New
track_event_buffer_exhausted_policyinTracingInitArgsto decide what happens when the TrackEvent buffer fills up. - The Java SDK now runs on non-ART JVMs (e.g. on host/desktop).
🐛 Fixes & build
- Process and package metadata added to Android heap dumps.
- Fixed an intermittent service crash from a use-after-free in the lock-free task runner.
- Fixed builds on FreeBSD (
tracebox), musl, and recent Fedora. - Trace Processor: faster startup, hardened parsers and SQL engine.
📚 Docs
- Docs for the new subcommand-based
trace_processorCLI and for multi-machine tracing. - A Data Explorer doc stub, a better architecture doc, and new images/videos.
- Updated heap profiler docs.
Happy Tracing!
A huge thanks to everyone, both inside and outside of Google, who contributed to making Perfetto v56 a success. ♥️
For complete details, see the changelog or view all changes on GitHub.
Download Perfetto v56.0 from our releases page, get started at docs.perfetto.dev, or try the UI directly at ui.perfetto.dev.