Release notes, performance investigations and deep dives from the people who build Perfetto.
rss_feed Atom feed
We’re excited to share Perfetto v59.1! This release brings **traces that survive device reboots** on Android, a much friendlier **Trace Processor command line** (rustc-style SQL errors, markdown output and a dedicated agent mode for AI coding tools), **flamegraphs as call trees and function tables**, **sampled callstacks over time**, a new **`linux.smaps` data source**, and a long list of UI, SQL standard library and SDK improvements.

We’re excited to share Perfetto v58.2! This release makes it possible to merge traces from different machines onto one timeline, introduces Memscope and Memory Overview for end-to-end memory investigations, lets you keep a parsed trace running and analyze it through lightweight remote clients, adds Zstd trace compression, and substantially improves Perfetto’s AI-assisted analysis workflows. It also introduces a common stack-sampling format, new export options, and a collection of UI and SDK improvements.
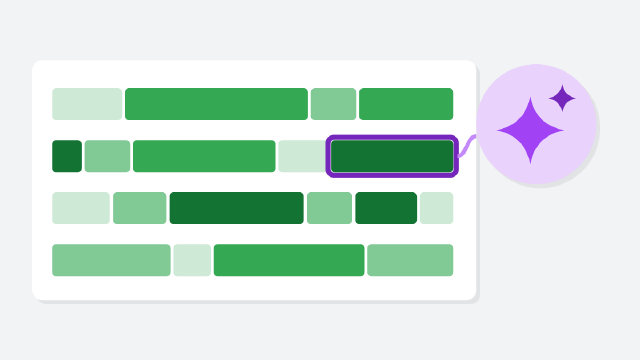
We're excited to share Perfetto v57.1! This release introduces an installable AI skill that teaches coding agents how to use Perfetto, a long-awaited fix for overlapping events in JSON traces (commonly affecting the PyTorch profiler), state tracks, a brand-new track type alongside slices and counters, end-to-end support for systemd journald logs, a rework of the query results grid, and new SDK capabilities like nested tracks and correlation ids.
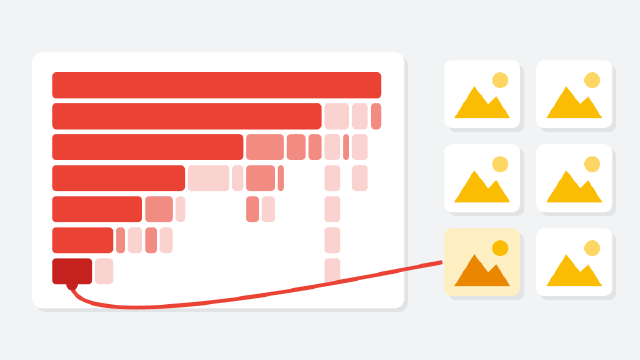
Perfetto v56.0 is out! This release adds more to the Heap Dump Explorer, a round of UI improvements, easier-to-read multi-machine traces, kernel-assisted stack sampling in traced_perf, and a few new SDK knobs.
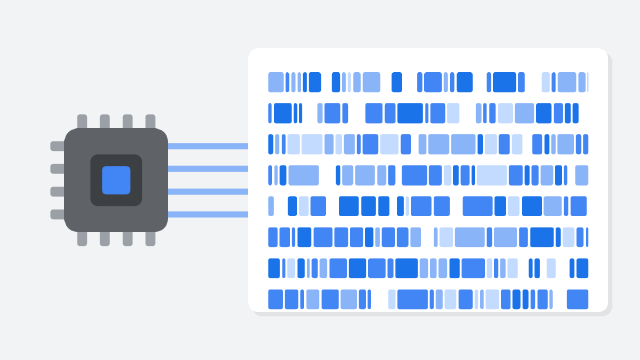
We are excited to share Perfetto v55.1! Highlights include GPU-accelerated trace rendering, a new Heap Dump Explorer, native Linux heap profiling, a redesigned trace_processor shell, multi-GPU analysis, and a major docs refresh.