
Perfetto v59

We’re excited to share Perfetto v59.1! This release brings traces that survive device reboots on Android, a much friendlier Trace Processor command line (rustc-style SQL errors, markdown output and a dedicated agent mode for AI coding tools), flamegraphs as call trees and function tables, sampled callstacks over time, a new linux.smaps data source, and a long list of UI, SQL standard library and SDK improvements.
Note: v59.0 was never released due to a build issue on the Linux and Android release builders. v59.1 contains the same changes plus the build fix.
🔁 Persistent traces across reboots (Android)
Set TraceConfig.persist_trace_across_reboots and the trace file is kept on disk if the device reboots mid-trace, then recovered and uploaded on the next boot via perfetto --upload-after-reboot. Recovered traces record why in the new trace_recovery_reason metadata entry.
🔥 New ways to look at profiles in the UI
Flamegraphs are great for spotting where cost goes, but they're only one way to read a profile. v59 adds two new views over the same data, plus a way to see how stacks change over time.
- Call Tree view: every flamegraph panel now has Flamegraph, Call Tree and Functions tabs. Call Tree is an expandable table with total and self cost for every frame, shown top-down (callees) or bottom-up (callers). The tabs share the same filters, and switching between them doesn't re-run the query.
- Functions view: a flat table with the cost of each function summed over every call path, the quickest way to answer "which function is hottest overall?". Recursion isn't double-counted.
- Available everywhere: CPU callstack samples, heapprofd and Java heap profiles, Heap Dump Explorer, Day Explorer, the pprof (aggregate profiles) page and track event callstacks all get the new views.
- Sampled callstacks over time: each thread with callstack samples now gets a "Callstack flamechart" track beneath its Callstacks track. It draws every sample's stack along the timeline, so you can see how a thread's behaviour changes over time, not just the aggregate. Frames can be coloured by function or by code mapping (library), and clicking a frame shows its details.
- pprof: step through multi-profile pprof archives with the arrow keys, and copy profile names.
- Heap dumps: ART heap dumps can be exported as pprof from the flamegraph Export menu (including in Heap Dump Explorer), and Heap Dump Explorer flags classes potentially merged by R8.
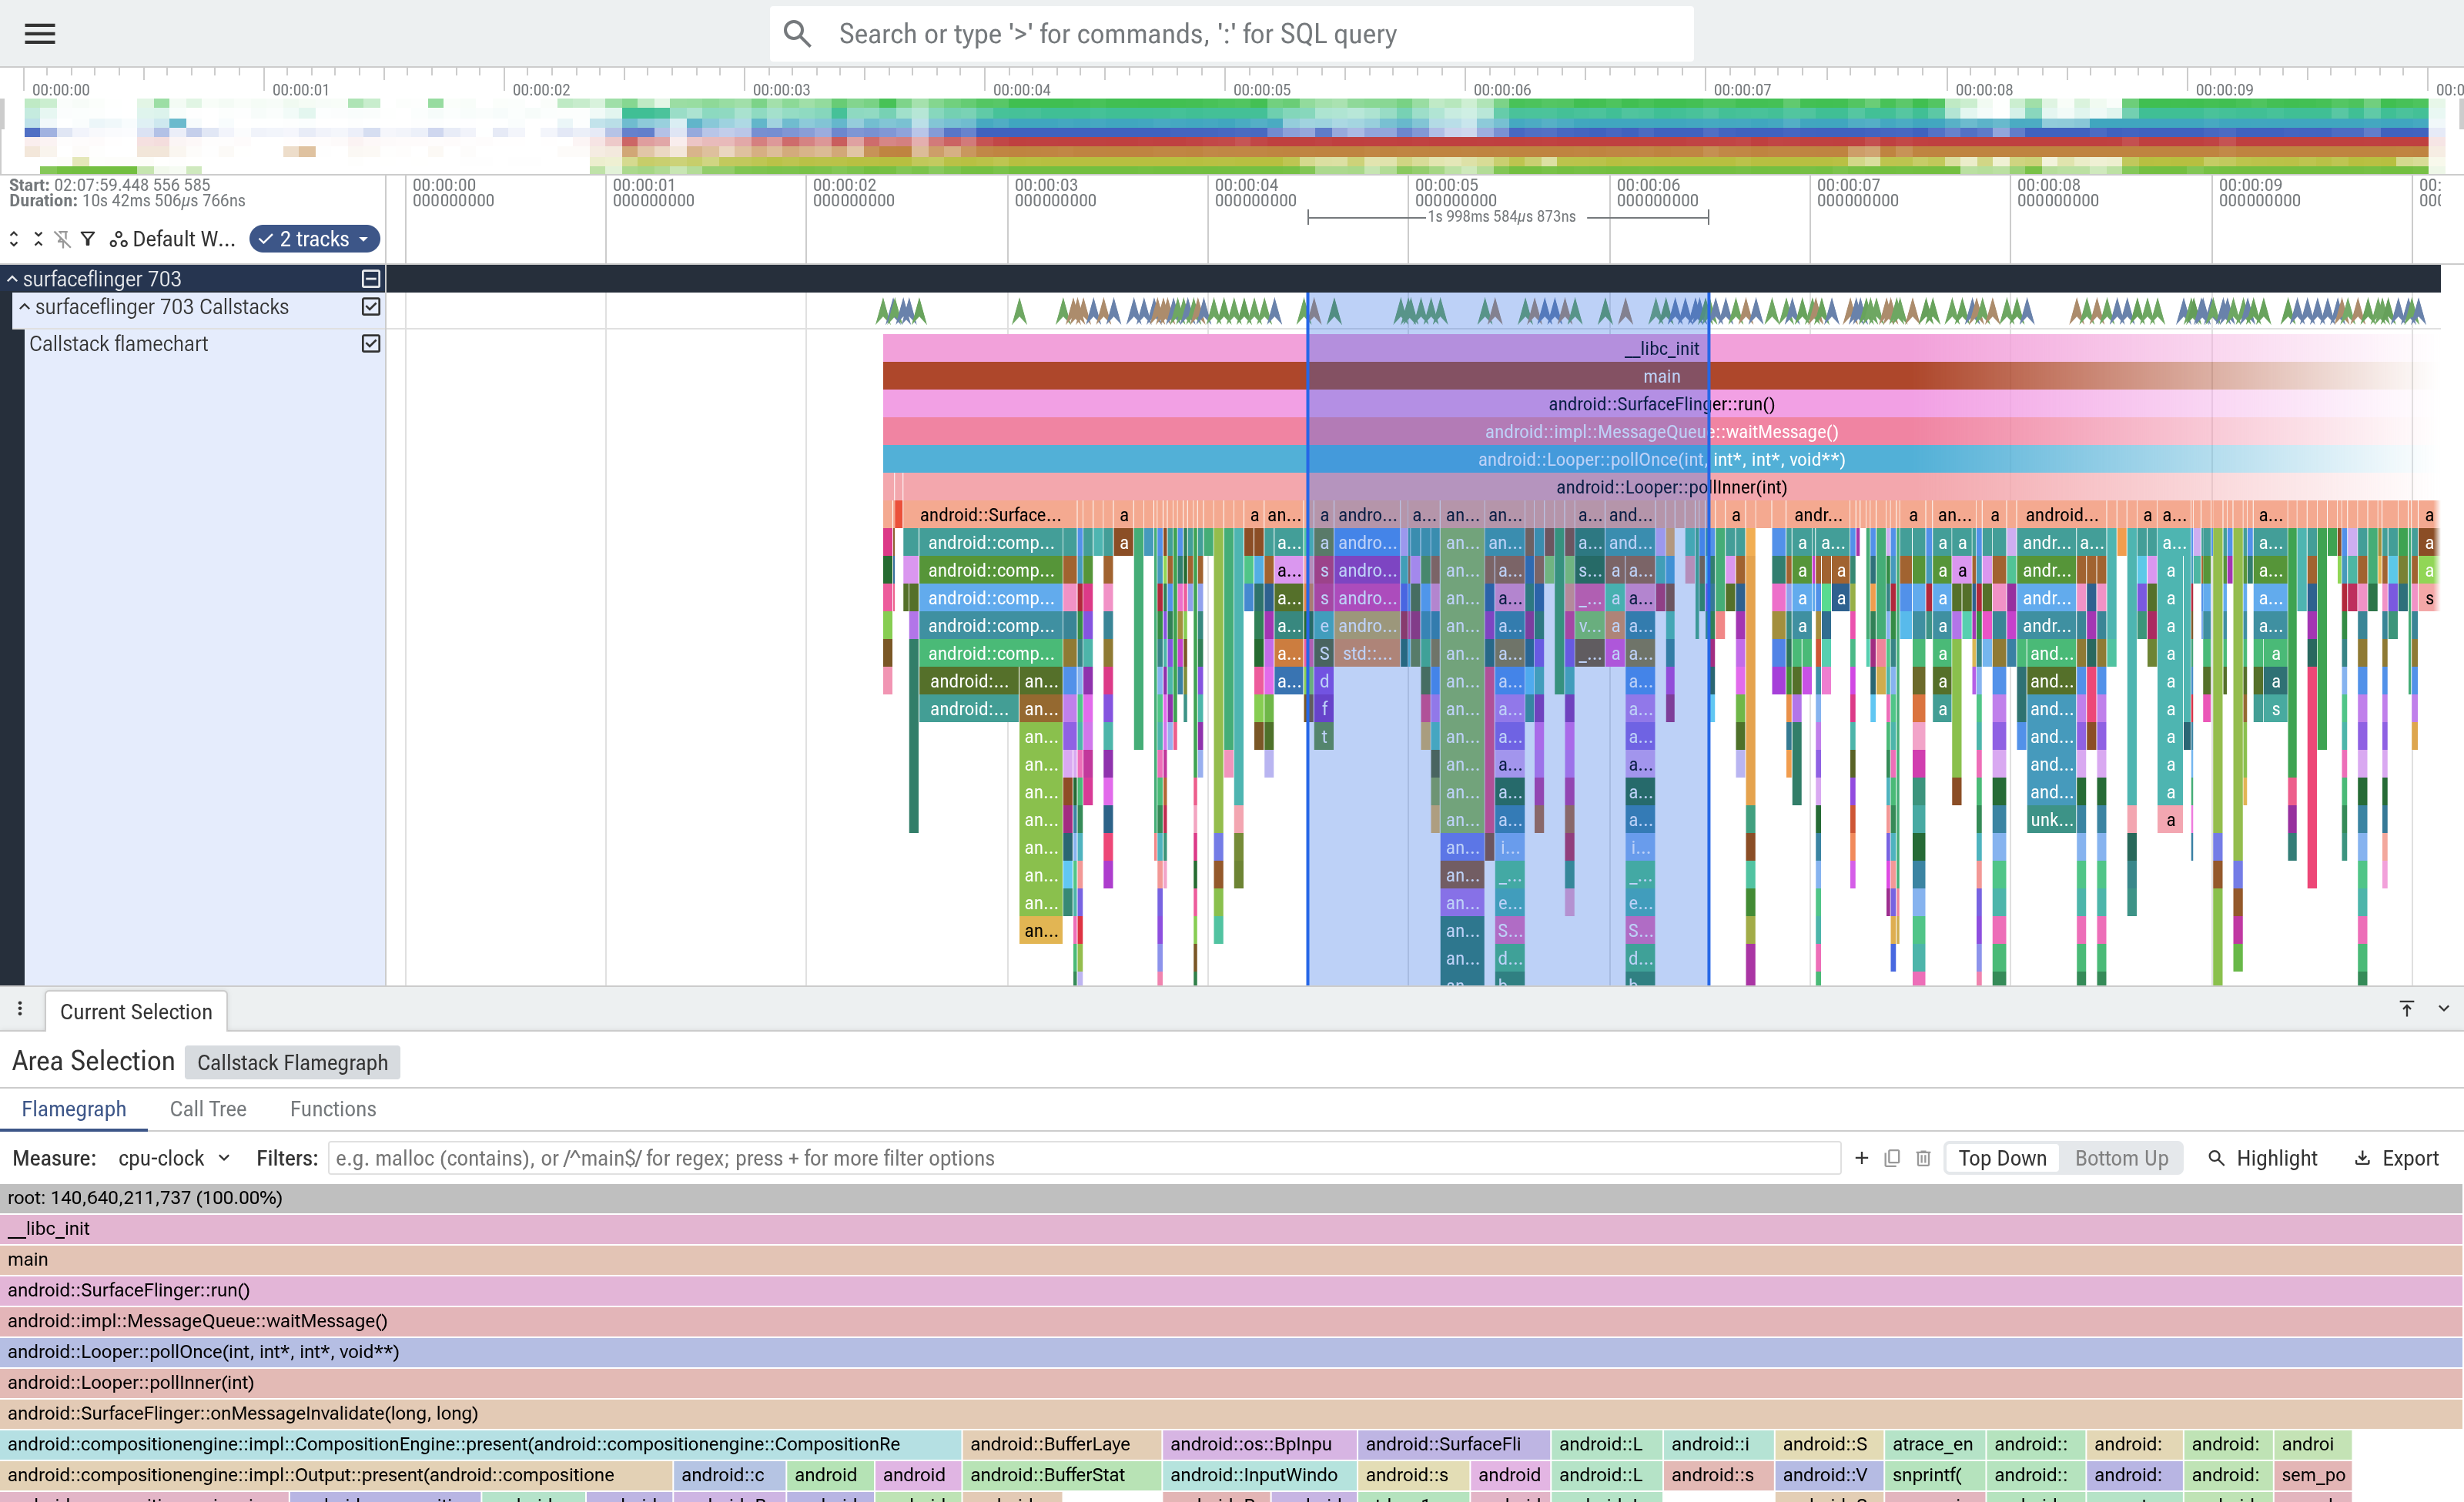
Sampled callstacks over time: the new Callstack flamechart track under surfaceflinger's main thread, with the flamegraph for an area selection and the new Flamegraph / Call Tree / Functions tabs below.
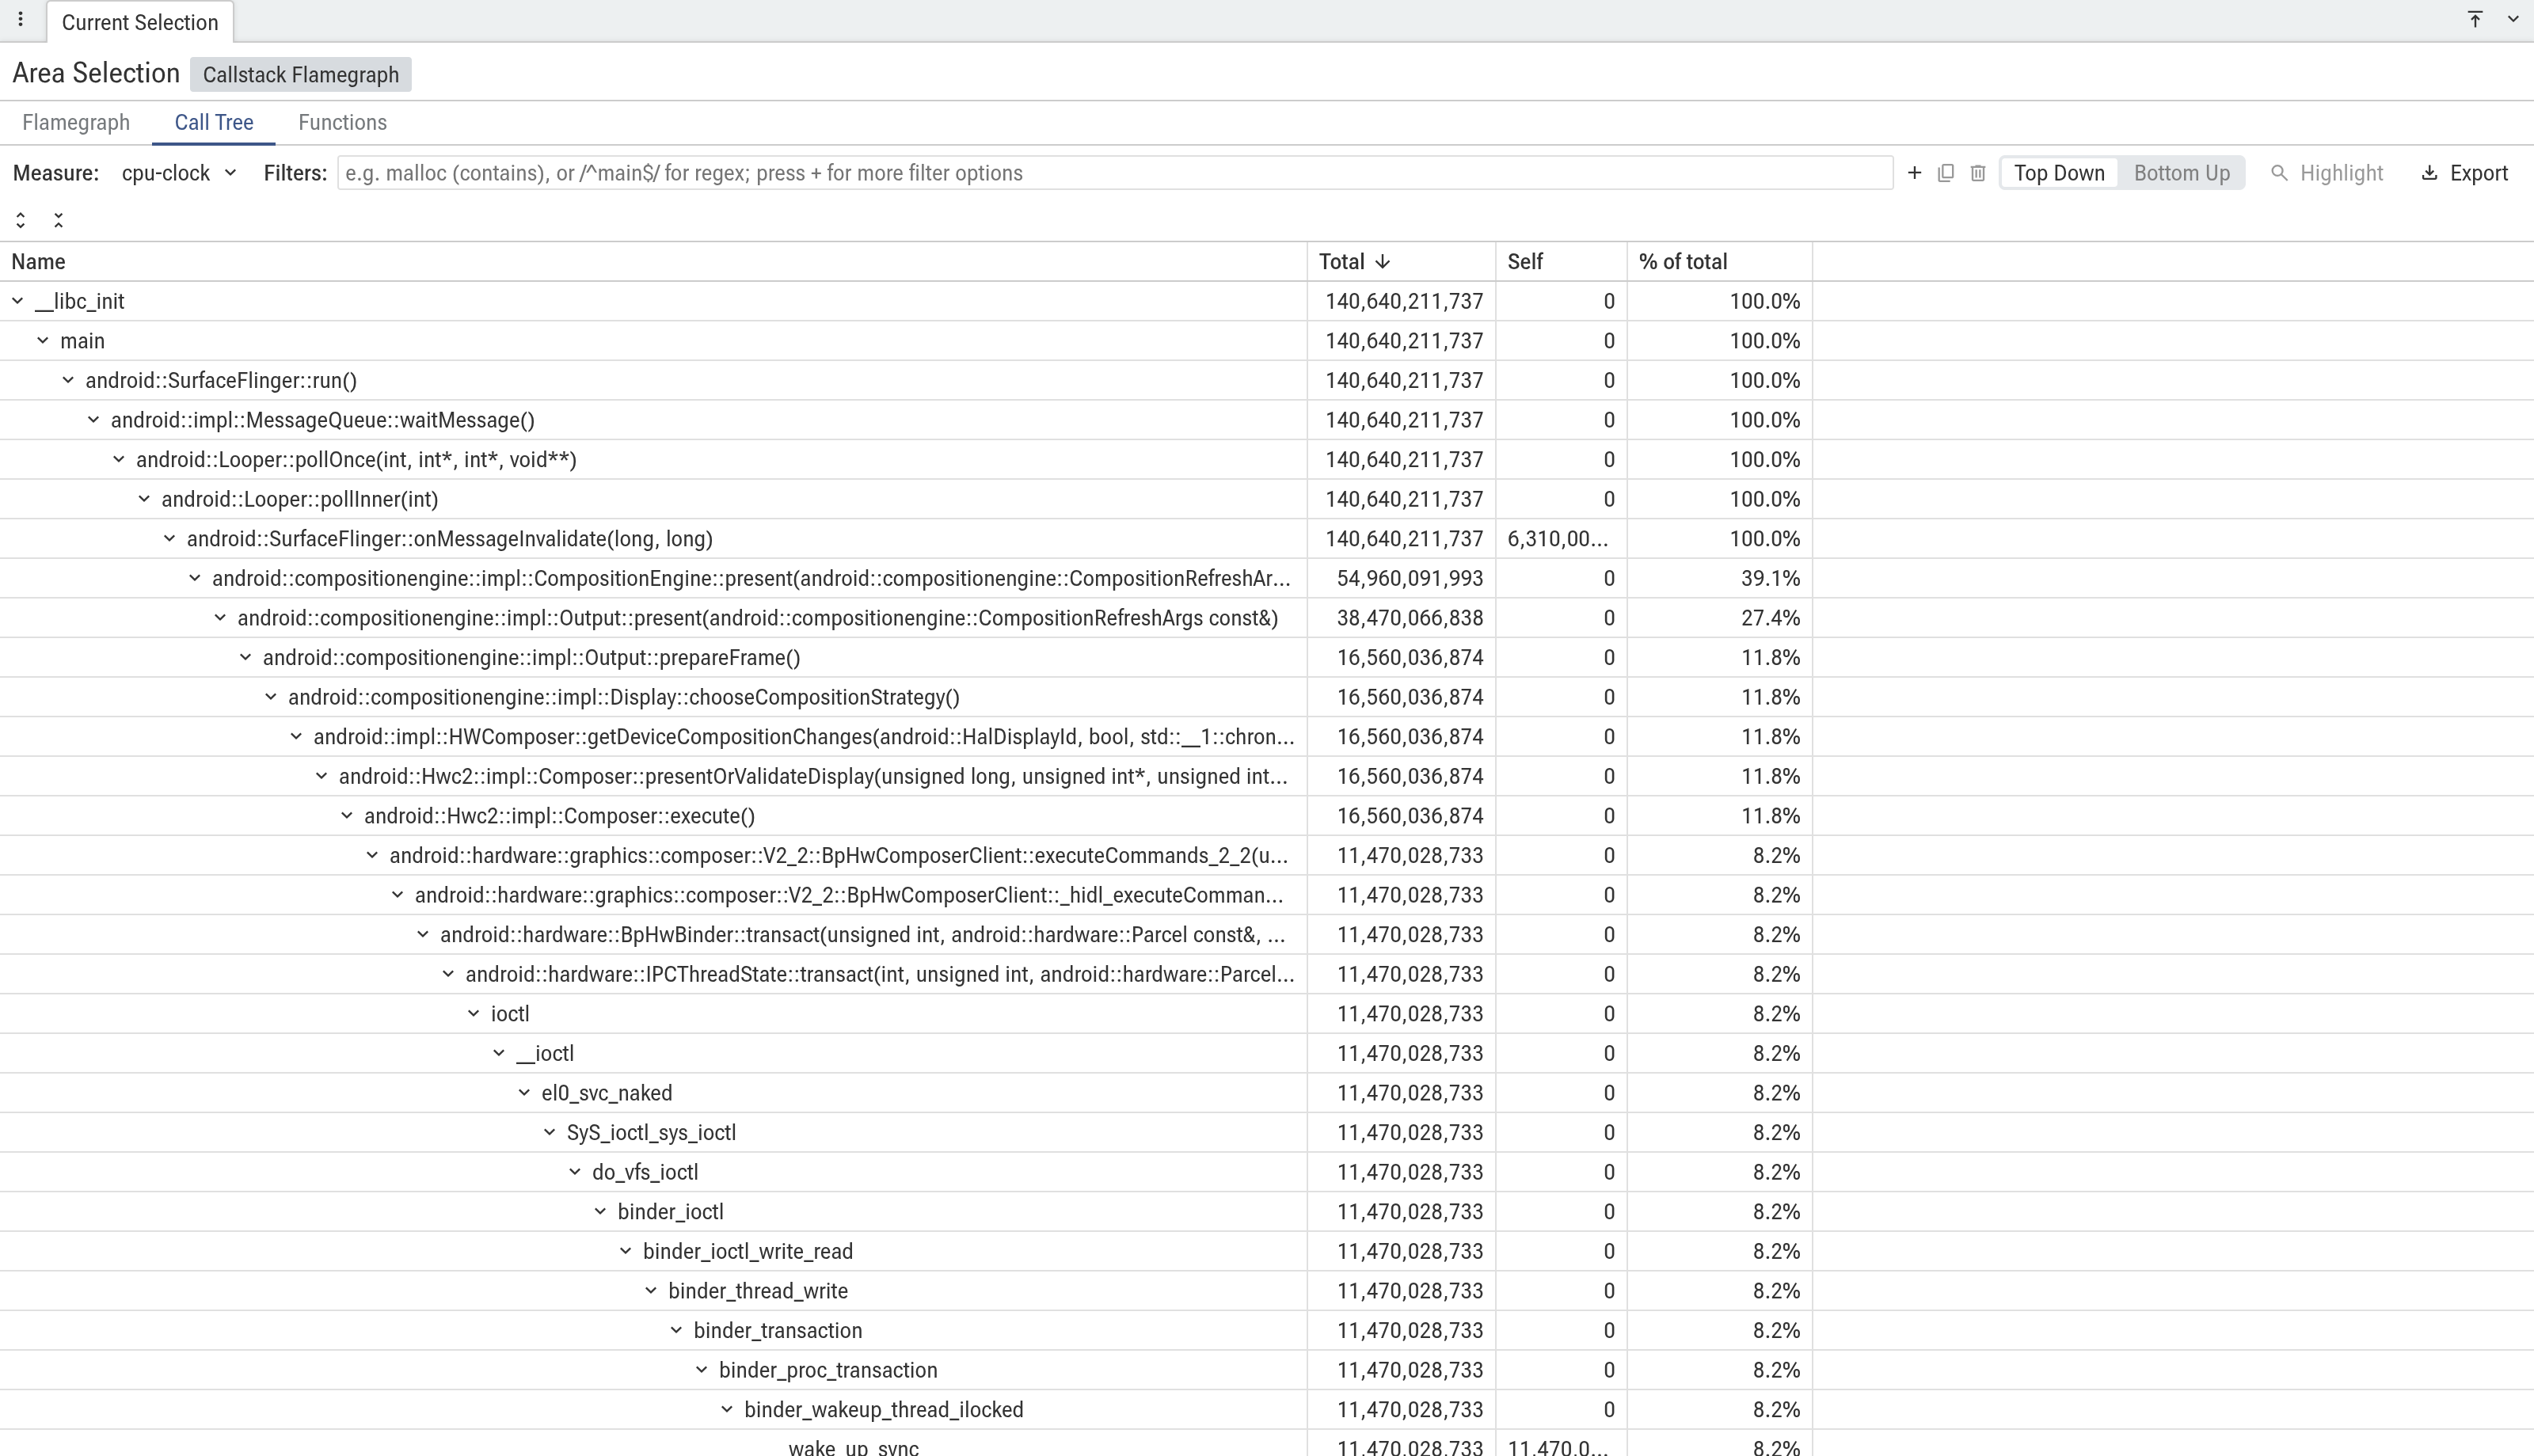
Call Tree view (top-down, fully expanded) for the same selection: total and self CPU time for every frame.
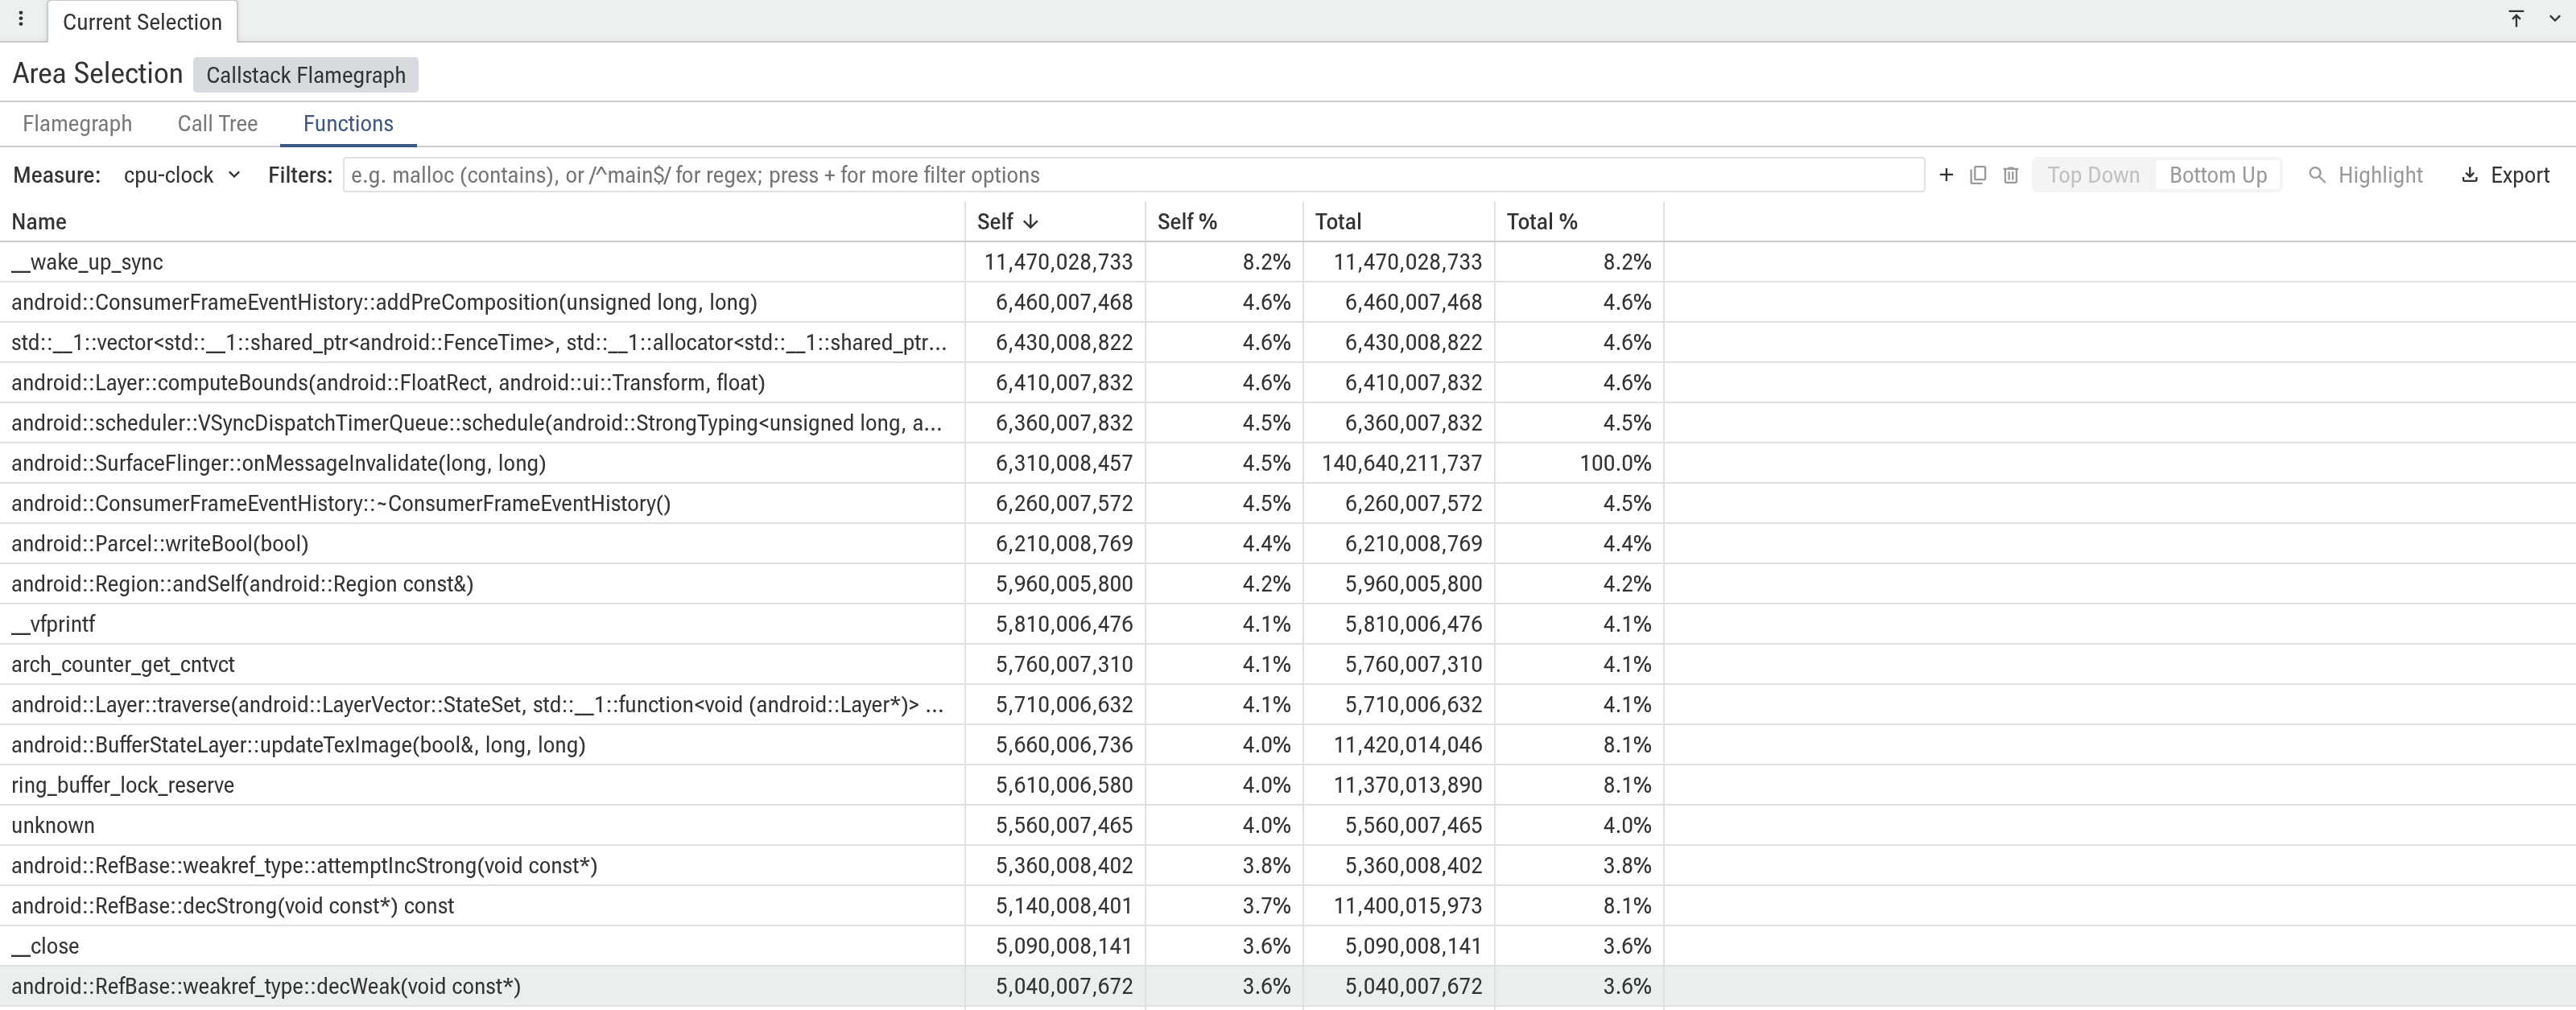
Functions view: self and total CPU time per function, summed over every call path.
🕸️ Flows that scale to dense graphs
Selecting a slice in a trace with a dense flow graph (build system dependency traces are a common example) used to make the UI follow the entire flow chain, which could grind it to a halt. Many people have hit this over time (#1004).
- Show only direct flows: a new setting on the Settings page that, when enabled, shows only the flows directly connected to the selected slice (one step) instead of the whole chain.
- Off by default: existing behaviour is unchanged unless you turn it on.
💻 A friendlier Trace Processor CLI
- Readable SQL errors: SQL errors are now laid out like rustc diagnostics, with a
--> source:line:collocation naming where the SQL came from (query, module, macro or metric), a line-number gutter and a caret. - Markdown output:
trace_processor query --format markdownprints compact markdown tables, with configurable--max-rows,--max-bytesand--max-cell-widthlimits. - Agent mode: when run by a coding agent (detected from environment variables such as
CLAUDECODEorAI_AGENT) with stdout not a terminal, results default to markdown and errors become single-line JSON. Force it on or off with--agent/--no-agent. - Interactive shell: prints aligned tables and shows the result of every statement, not just the last one.
- Progress and colour: terminal-aware progress reporting,
--no-progress, andNO_COLOR/FORCE_COLORsupport.
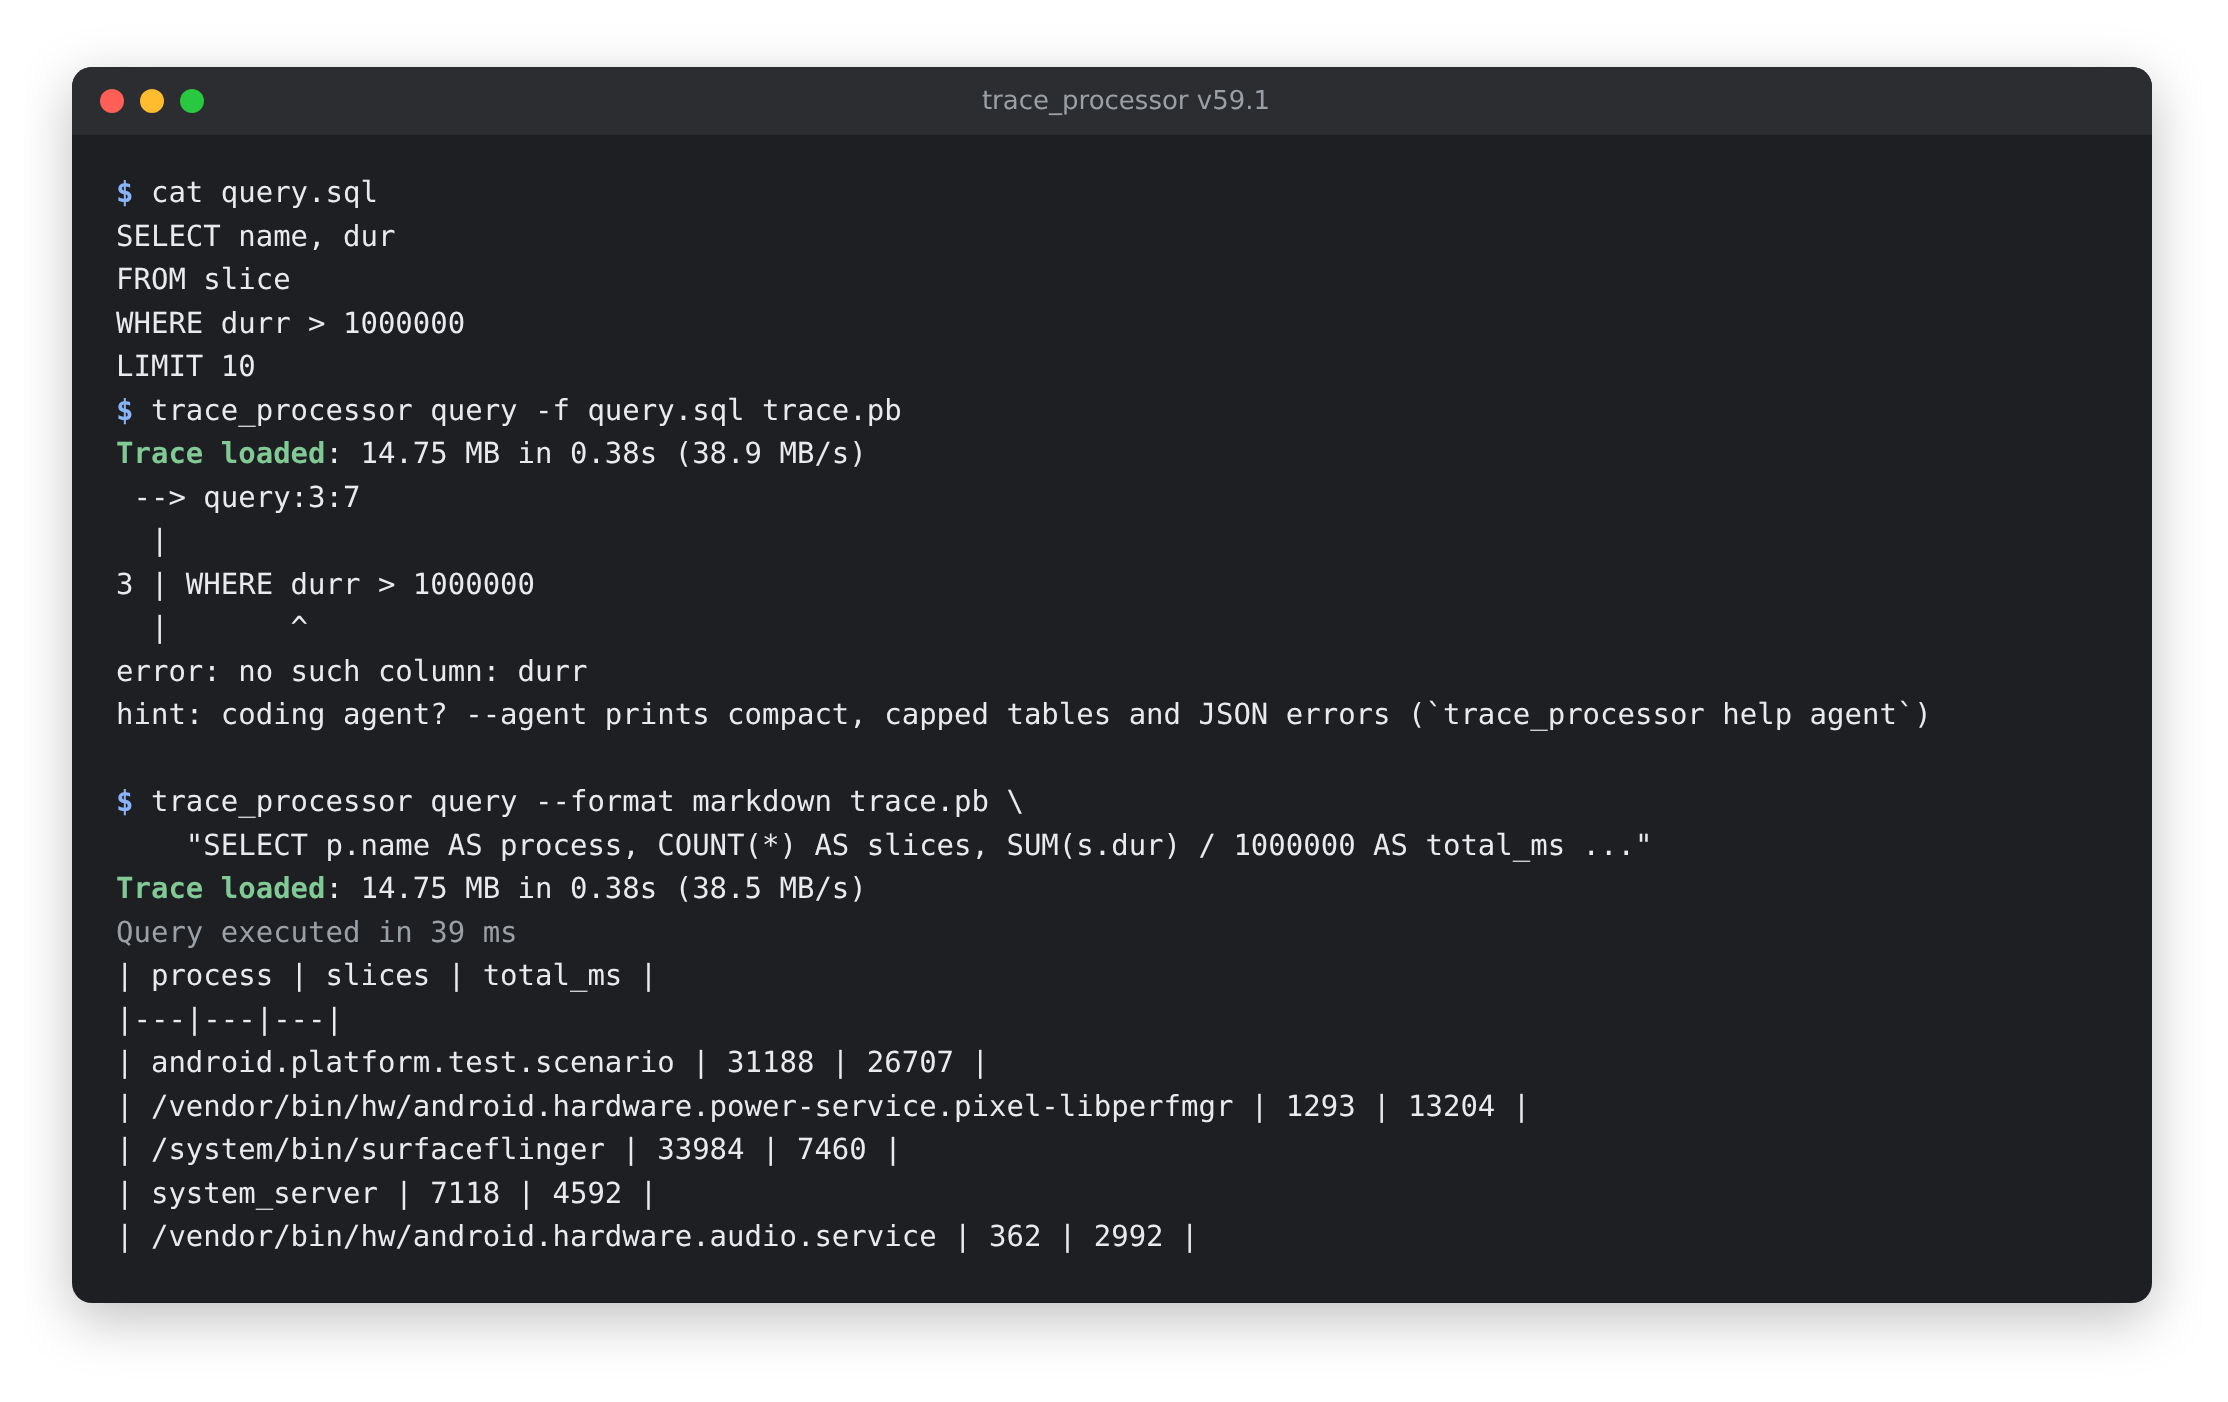
Trace Processor CLI: a rustc-style error for a misspelled column, then query results printed as a markdown table with --format markdown.
🧠 Memory: linux.smaps data source
traced_perf can now record /proc/pid/smaps for selected processes, once or periodically. Processes can be selected by cmdline and uid range. The record page can also capture smaps snapshots alongside ART heap dumps.
🔍 Symbolization without local binaries
Native profiles from Linux machines often arrive without the unstripped binaries needed to symbolize them. Trace Processor can now fetch debug files from debuginfod servers by build ID, so trace_processor bundle --debuginfod input.pftrace output.tar produces a symbolized bundle with no local binaries at all.
- Opt-in and local-first: lookups only happen with
--debuginfod. Servers come from--debuginfod-urlsorDEBUGINFOD_URLS, and local binaries are always tried first. - Cached: downloads are cached for later runs (
--debuginfod-cache-pathto override), with configurable connection and stall timeouts. - Much less work: mappings are now deduplicated across processes, so large traces send far fewer requests to llvm-symbolizer.
- Clearer results: accurate counts of resolved and unresolved frames,
--verboseto see every lookup,--quietfor scripts, and a clean error instead of a crash when llvm-symbolizer can't be run. - samply profiles: unsymbolized Firefox Profiler (samply) profiles can now be symbolized with
bundle.
Learn more about symbolization
🐍 Python: connect to warm sessions
TraceProcessor(remote='my-session') connects to a running trace_processor server unix session, so you can parse a large trace once and query it from many scripts. Only query() is supported over Unix sockets for now. remote also accepts HTTP addresses, and addr is deprecated in its favour.
🖥️ UI Enhancements
- Zoom to slice: double-click a slice to select and zoom into it.
- Track groups: "Expand all" / "Collapse all" in the track menu, and Shift+click on a group header to expand or collapse everything below it.
- Android: frame timeline tracks are grouped by layer, and the AndroidLockContention plugin is revamped.
- Aggregations: CPU slice aggregations gain a "CPU Time / Wall Time" column. Thread slice aggregations gain optional process, thread and track columns, and drill-downs open in a new tab. The old Pivot Table tab has been removed in favour of slice aggregations.
- Permalinks: workspaces are now saved in permalinks.
- Robustness: the timeline recovers from WebGL context loss, and two-finger horizontal scrolling no longer triggers browser back/forward on ChromeOS, Linux and Windows.
- Embedding: embedders can stream traces over postMessage as a ReadableStream and use the new
shareable/downloadableflags (see the compatibility notes below).
⚡ Trace Processor & SQL standard library
- New modules:
android.process_state(process and freezer state, exit reasons),android.lock_held,android.cpu.cluster_utilization,android.job_scheduler_states_track_events,std.gpu.vulkan_debug_names, plusandroid_cuj_blocking_calls. - Wattson: now supports Tensor G6 (CPU, GPU and TPU), MT6789, and Linux devices identified by their device tree.
- Importers: perf.data imports handle fork and exit records and thread-scoped PMU counters. The strace importer works with real
strace -f/-Toutput. - Performance: faster ART hprof import with lower peak memory. SQLite upgraded to 3.53.4.
🚂 Tracing Service and Probes
- GPU: per-draw-call GPU render stage slices (
GpuRenderStagesConfig.drawcall_stages). - Compression: compressed traces keep the clock snapshot, trace config and UUID uncompressed, so on-device tools can inspect them.
- Robustness: the service now rejects producers with an unusable shared memory buffer instead of crashing. Fixed heapprofd unwinding on x86_64.
🧩 SDK improvements
- Data loss detection: detect data lost to shared memory exhaustion with
TraceContext::drop_count()(C++) /PerfettoDsTracerGetDropCount()(C). - Flush info: C SDK data sources can read the flush reason and flags.
- Big-endian: big-endian support in the in-process SDK.
- Android Java SDK: only allowlisted apps can register with the system tracing service.
🔧 Build
- New GN args:
perfetto_cxx_standard, andperfetto_use_system_{re2,zstd,linenoise,expat}. - Bazel: Perfetto can be used as a non-root Bazel module.
⚠️ Migration and compatibility notes
Perfetto v59 includes a few changes worth checking when upgrading:
- postMessage traces: traces posted to the UI as a bare ArrayBuffer are now local-only by default. Use the new
shareable/downloadableflags (which replacelocalOnly) to control this. - Graph functions:
graph_reachable_dfs/graph_reachable_bfsnow return the start nodes when the graph has no edges, instead of an empty table. See PerfettoSQL backwards compatibility. - Shell commands: the
.dump,.load-metrics-sqland.run-metricsinteractive shell commands have been removed, and.widthand-W/--wideare deprecated and no longer do anything. Usetrace_processor export sqliteinstead of.dump.
A huge thanks to everyone who contributed to making Perfetto v59 possible. A specific thanks to our first time contributors:
- @sadrulhc made their first contribution in https://github.com/google/perfetto/pull/7064
- @Svetlitski made their first contribution in https://github.com/google/perfetto/pull/6988
- @MichaelFQuigley made their first contribution in https://github.com/google/perfetto/pull/6909
- @iw4p made their first contribution in https://github.com/google/perfetto/pull/7186
- @dragosp95 made their first contribution in https://github.com/google/perfetto/pull/7247
- @mmeenaks-gh made their first contribution in https://github.com/google/perfetto/pull/7089
- @yforta made their first contribution in https://github.com/google/perfetto/pull/7297
- @rvandermeulen made their first contribution in https://github.com/google/perfetto/pull/7346
- @Archkon made their first contribution in https://github.com/google/perfetto/pull/7136
- @willmcvicker made their first contribution in https://github.com/google/perfetto/pull/7222
- @TudorCretu made their first contribution in https://github.com/google/perfetto/pull/7453
- @ArpitKhatri5 made their first contribution in https://github.com/google/perfetto/pull/5710
- @rasikanavarange made their first contribution in https://github.com/google/perfetto/pull/7492
- @evilgensec made their first contribution in https://github.com/google/perfetto/pull/7497
- @hchataing made their first contribution in https://github.com/google/perfetto/pull/7499
- @anubhavchaturvedi made their first contribution in https://github.com/google/perfetto/pull/7718
- @rogerjxperi made their first contribution in https://github.com/google/perfetto/pull/7752
- @TwinklerG made their first contribution in https://github.com/google/perfetto/pull/7807
For complete details, see the v59.1 changelog or view all changes on GitHub.
Download Perfetto v59.1 from our releases page, get started at perfetto.dev, or try the UI directly at ui.perfetto.dev.