
Hunting Duplicate Strings in Android Heap Dumps

Hiding in Plain Sight
If you've ever taken a heap dump of an Android app, you've almost certainly seen java.lang.String near the top: tens of thousands of instances, often more than any other class in your app.
Most of us shrug and move on. Modern apps are text-heavy by nature (user profiles, localized labels, API responses, URLs), so it's easy to treat a high String count as an unavoidable cost of doing business on Android. Unlike a leaked Activity or a massive Bitmap, Strings don't set off alarm bells. They blend into the background.
But what if those thousands of objects aren't actually unique data? What if your app is holding tens of thousands of identical copies of the exact same words?
Part of the reason this goes unnoticed is how heap data is usually browsed: class by class, instance by instance, sorted by size. Duplicated strings (repeated API values like "Partly Cloudy" or city names like "București") are small, so they sink to the bottom and end up scattered across thousands of separate rows. Duplication isn't a property of any single object. It only shows up when you group objects by what they contain, and an instance-by-instance view never does that.
Everything here comes from a sample app built for this post. It shows an hourly weather forecast of 100 rows and reloads it again and again, the way a real app would. The code is ordinary on purpose: a JSON payload, a data class, a list. Nothing in it looks wrong.
Yet a heap dump taken after a few minutes of use holds 61,752 String objects. Some of them are copies. The question is how many, and of what.
Counting What the Instance View Won't
The heap dump has everything we need to find out. We just have to group the strings by value ourselves.
Getting a heap dump you can query
There are two main ways to capture the ART/Java heap on Android:
am dumpheap, which writes a full.hprofheap dump.- Perfetto's Java heap profiler (see Analyzing the Java Heap).
am dumpheap is slower and more expensive, but it captures the entire heap, including the contents of every field: string values, primitive arrays, and so on. Perfetto's heap profiler is faster and more lightweight, but it records only the shape of the heap graph (object sizes and retaining references), not the contents of the objects.
Perfetto's tools can open both. Finding duplicate strings means comparing their values, so we need option 1. All you need is a debuggable build. From the command line, dump and then pull:
adb shell am dumpheap <package-name> /data/local/tmp/dump.hprof
adb pull /data/local/tmp/dump.hprof
If you prefer your IDE's memory profiler, export the heap dump from there instead. Any .hprof works.
Then open the Perfetto UI and drag the file in.
Perfetto is probably familiar as a systrace viewer, but its trace processor also ingests ART heap dumps directly, and exposes them as SQL tables you can query in the browser. The whole thing runs client-side in WebAssembly, so the dump never leaves your machine.
Grouping by value
Three tables do the work. heap_graph_object holds every object on the heap, with its size. heap_graph_class supplies each object's class name, so we can keep only the strings. heap_graph_object_data holds the decoded contents, including the actual text of every java.lang.String.
Joining them lets you do the one thing the instance view won't: GROUP BY the string's value.
SELECT od.value_string AS value, COUNT(*) AS instances
FROM heap_graph_object o
JOIN heap_graph_class c ON o.type_id = c.id
JOIN heap_graph_object_data od ON od.id = o.object_data_id
WHERE c.name = 'java.lang.String'
  AND o.reachable = 1
  AND od.value_string IS NOT NULL
GROUP BY od.value_string
HAVING instances > 1
ORDER BY instances DESC
LIMIT 20;
Filtering by reachable ensures we only count strings that the application is actively holding alive.
Paste it into the Query (SQL) tab and hit run. The top of the result is four rows:
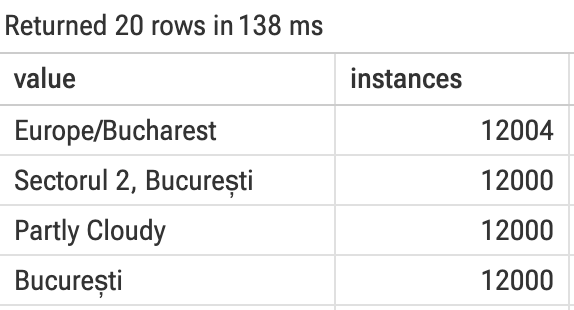
Figure 1: Four values account for roughly 48,000 objects.
That answers the question: roughly 48,000 of the 61,752 strings are copies of just four values. Every one is a separate allocation, and all were reachable when the dump was taken.
What the duplication costs
The next step is to add SUM(self_size). But every row comes back at exactly 16 bytes per instance. It stays 16 whether the string is 9 characters or 21. That is the clue. In an HPROF dump, self_size measures only the String object header (its class pointer, lock word, count, and hash). To see the characters, you have to follow an object reference to a separate backing array.
Fun runtime detail: In device memory, ART actually stores characters inline directly inside the
java.lang.Stringallocation. If you inspects.charAt(i)compiled with Android's dex2oat in Compiler Explorer, the compiled ARM64 code reads directly from[String_ptr + 16]with zero pointer indirection. However, because the legacy JVM HPROF format cannot represent variable-length class instances, ART fabricates a syntheticbyte[]orchar[]primitive array when generating a heap dump so standard profiling tools can read it.
To count the characters in Perfetto, we follow that synthetic reference. It takes three more joins:
SELECT
  od.value_string AS value,
  COUNT(*) AS instances,
  SUM(o.self_size) AS string_bytes,
  SUM(arr.self_size) AS char_bytes,
  SUM(o.self_size + arr.self_size) AS total_bytes
FROM heap_graph_object o
JOIN heap_graph_class c ON o.type_id = c.id
JOIN heap_graph_object_data od ON od.id = o.object_data_id
JOIN heap_graph_reference r ON r.reference_set_id = o.reference_set_id
JOIN heap_graph_object arr ON arr.id = r.owned_id
JOIN heap_graph_class ac ON arr.type_id = ac.id
WHERE c.name = 'java.lang.String'
  AND od.value_string IS NOT NULL
  AND ac.name IN ('byte[]', 'char[]')
  AND o.reachable = 1
GROUP BY od.value_string
ORDER BY instances DESC
LIMIT 20;
Run it. The same four values, now with their character data:
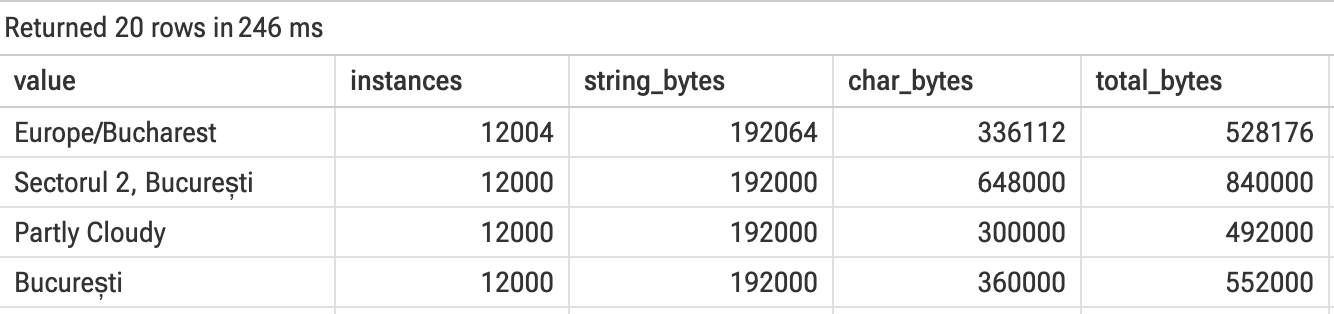
Figure 2: The same grouping, extended to follow each String to its character array.
Now total_bytes shows the full cost: 2.3 MiB for four values, just over three times the 750 KiB from the objects alone.
Note: Notice that the 9-character string "București" costs more than the 13-character "Partly Cloudy". Because ș is outside 7-bit ASCII, ART cannot use its 1-byte ASCII string compression and falls back to uncompressed UTF-16 (char[]) at 2 bytes per character for the entire string.
None of this was hidden. All 48,000 objects were in the dump all along, thousands of rows apart. The data was there. The grouping was not.
Letting Perfetto do the work
You don't have to write that SQL every time. Once a dump is loaded, click Heapdump Explorer in the sidebar. Its Overview tab groups duplicate strings by value for you.
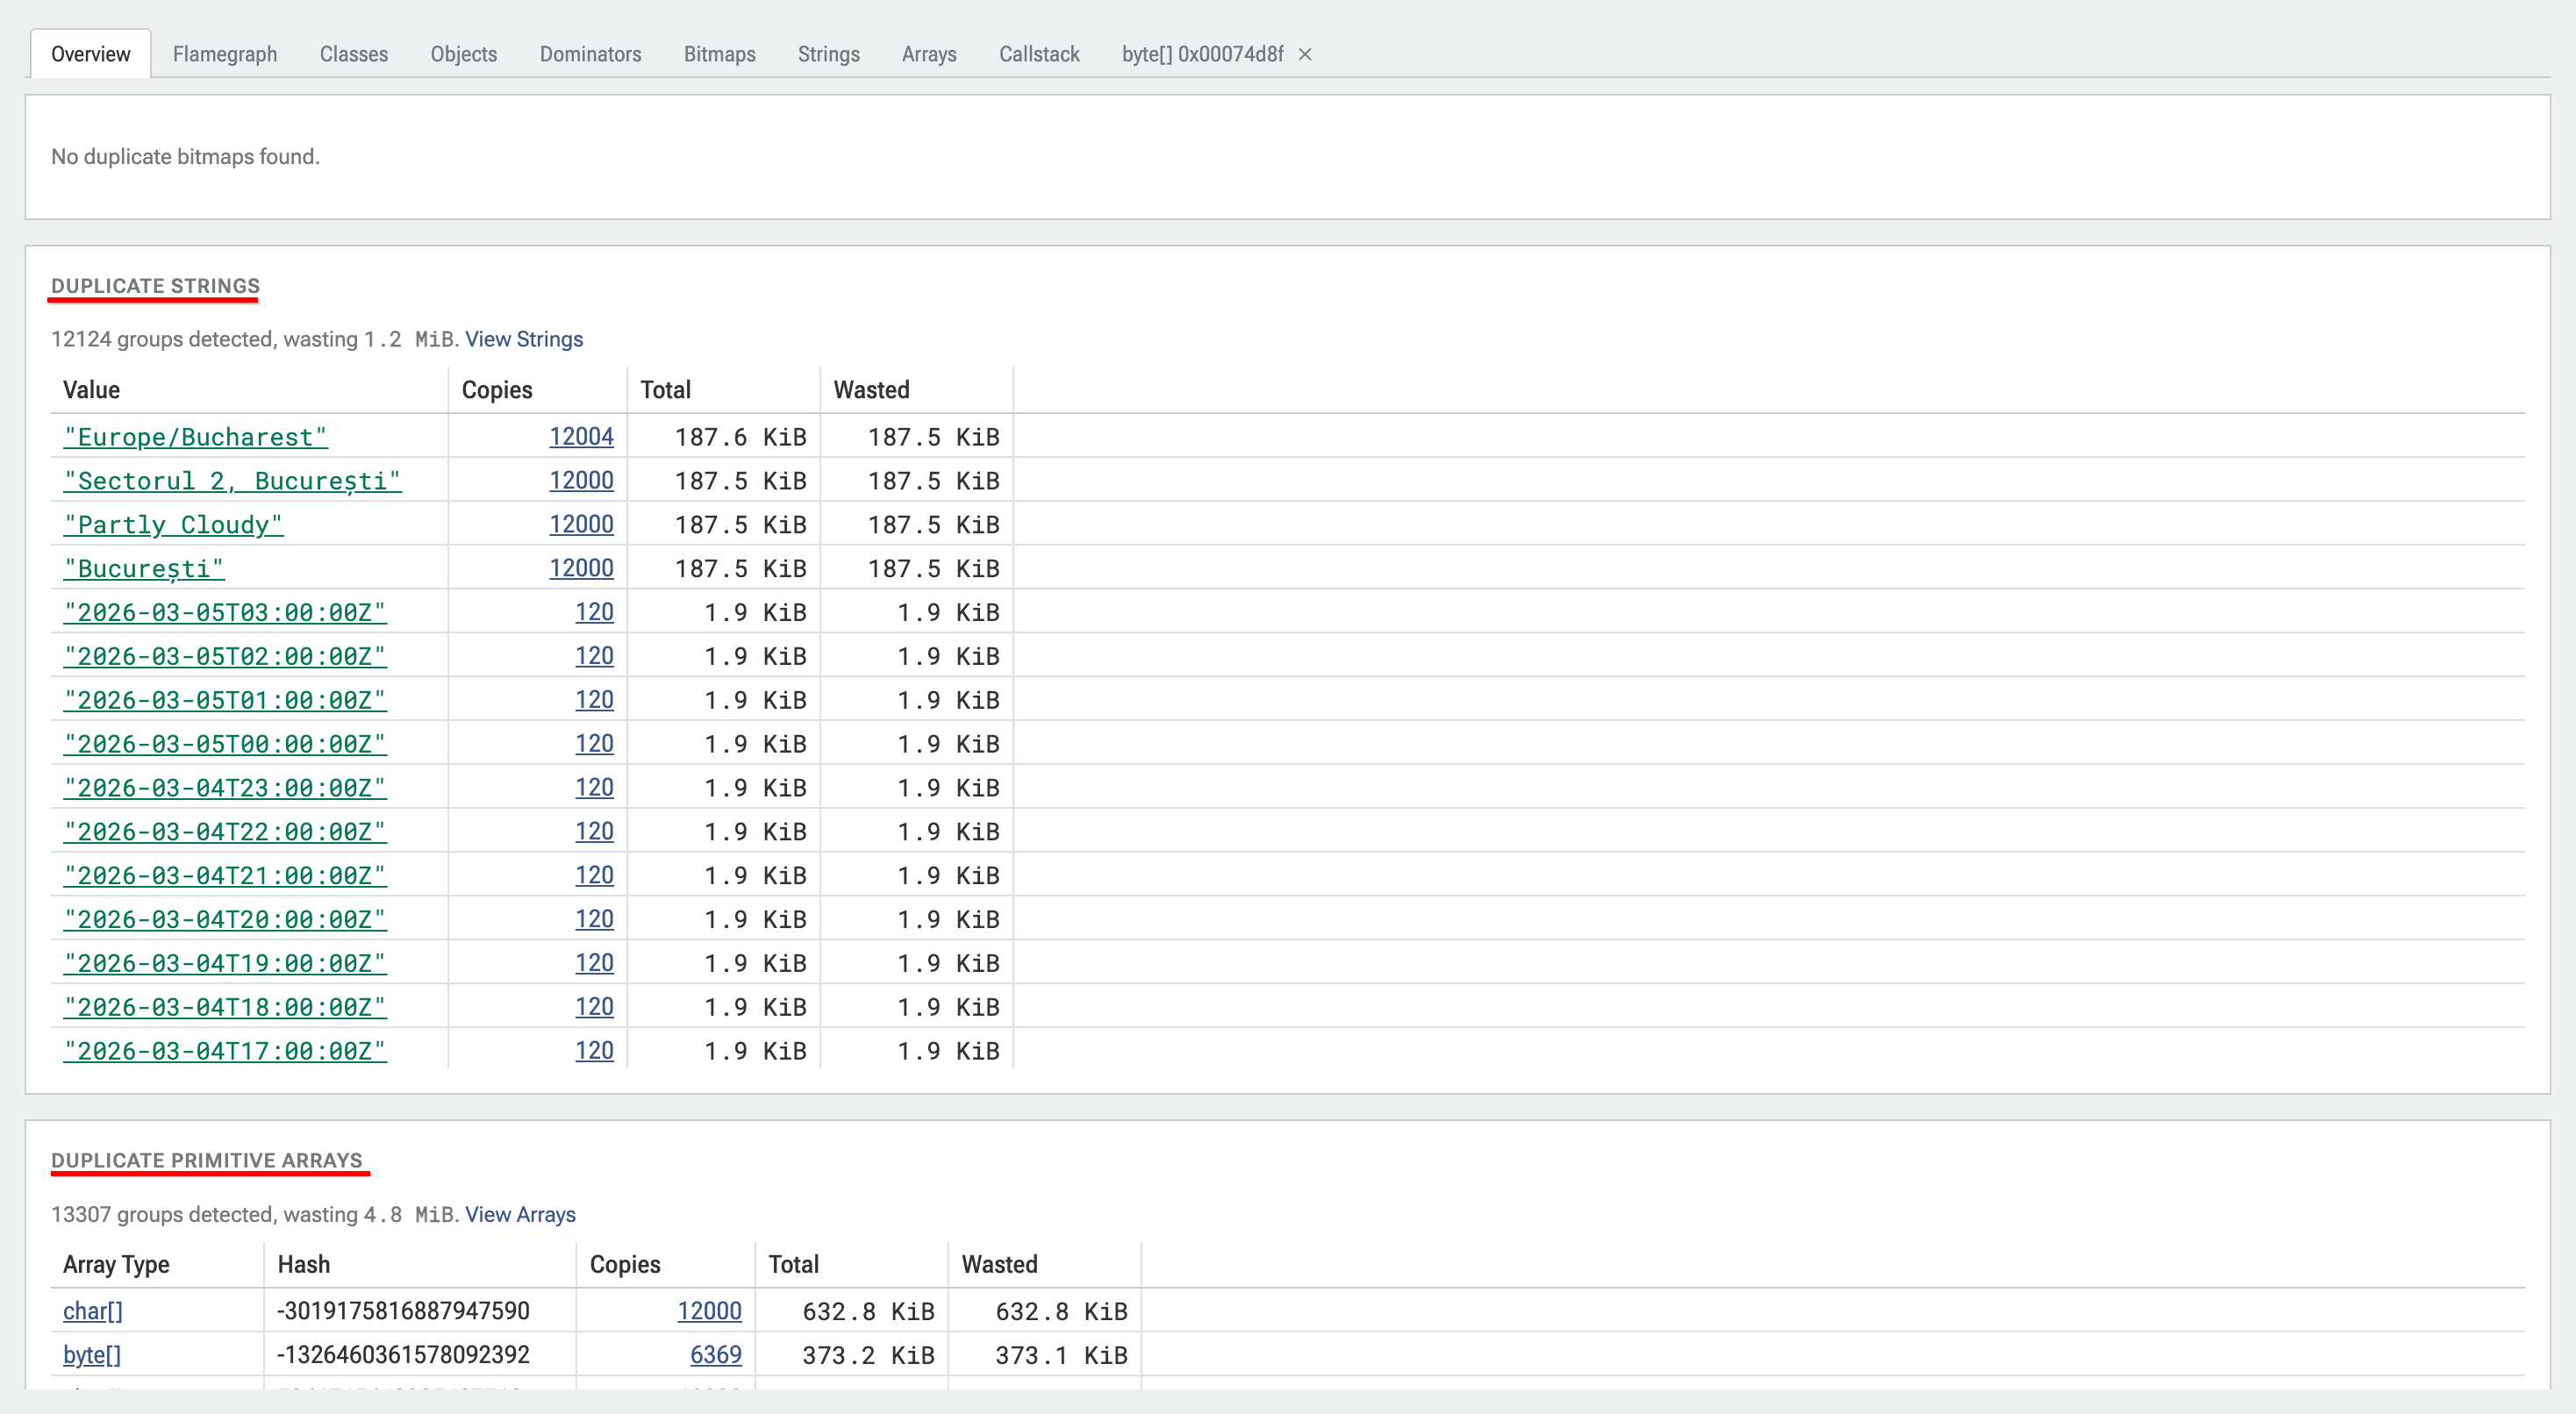
Figure 3: Heapdump Explorer Overview shows duplicate Strings
The same four values, the same counts, in one click. The character arrays are here too, in a table of their own: Duplicate Strings counts the String objects, Duplicate Primitive Arrays counts the text. Nothing is missing. It is just split in two.
That split is why the query still earns its place. The arrays table labels each group with a content hash, so you cannot tell which string a given byte[] or char[] belongs to. Only the query puts a value and its full cost on the same line.
So where do 48,000 duplicate strings come from in an app that shows a hundred rows of weather?
Why Strings Multiply
We know what the duplicate strings are, and we know what they cost. Next, we need to see what is holding them alive.
Tracing the retainers
Earlier, we used heap_graph_reference to see what each String points to (its backing byte[] or char[]). To find out who owns the String, we flip the join to see what points to each String (r.owned_id = o.id):
SELECT
owner_class.name AS owner_class,
r.field_name AS field,
od.value_string AS value,
COUNT(*) AS instances
FROM heap_graph_object o
JOIN heap_graph_class c ON o.type_id = c.id
JOIN heap_graph_object_data od ON od.id = o.object_data_id
JOIN heap_graph_reference r ON r.owned_id = o.id
JOIN heap_graph_object owner ON r.owner_id = owner.id
JOIN heap_graph_class owner_class ON owner.type_id = owner_class.id
WHERE c.name = 'java.lang.String'
AND o.reachable = 1
AND od.value_string IN (
'Europe/Bucharest',
'Sectorul 2, București',
'Partly Cloudy',
'București'
)
GROUP BY owner_class, field, value
ORDER BY instances DESC;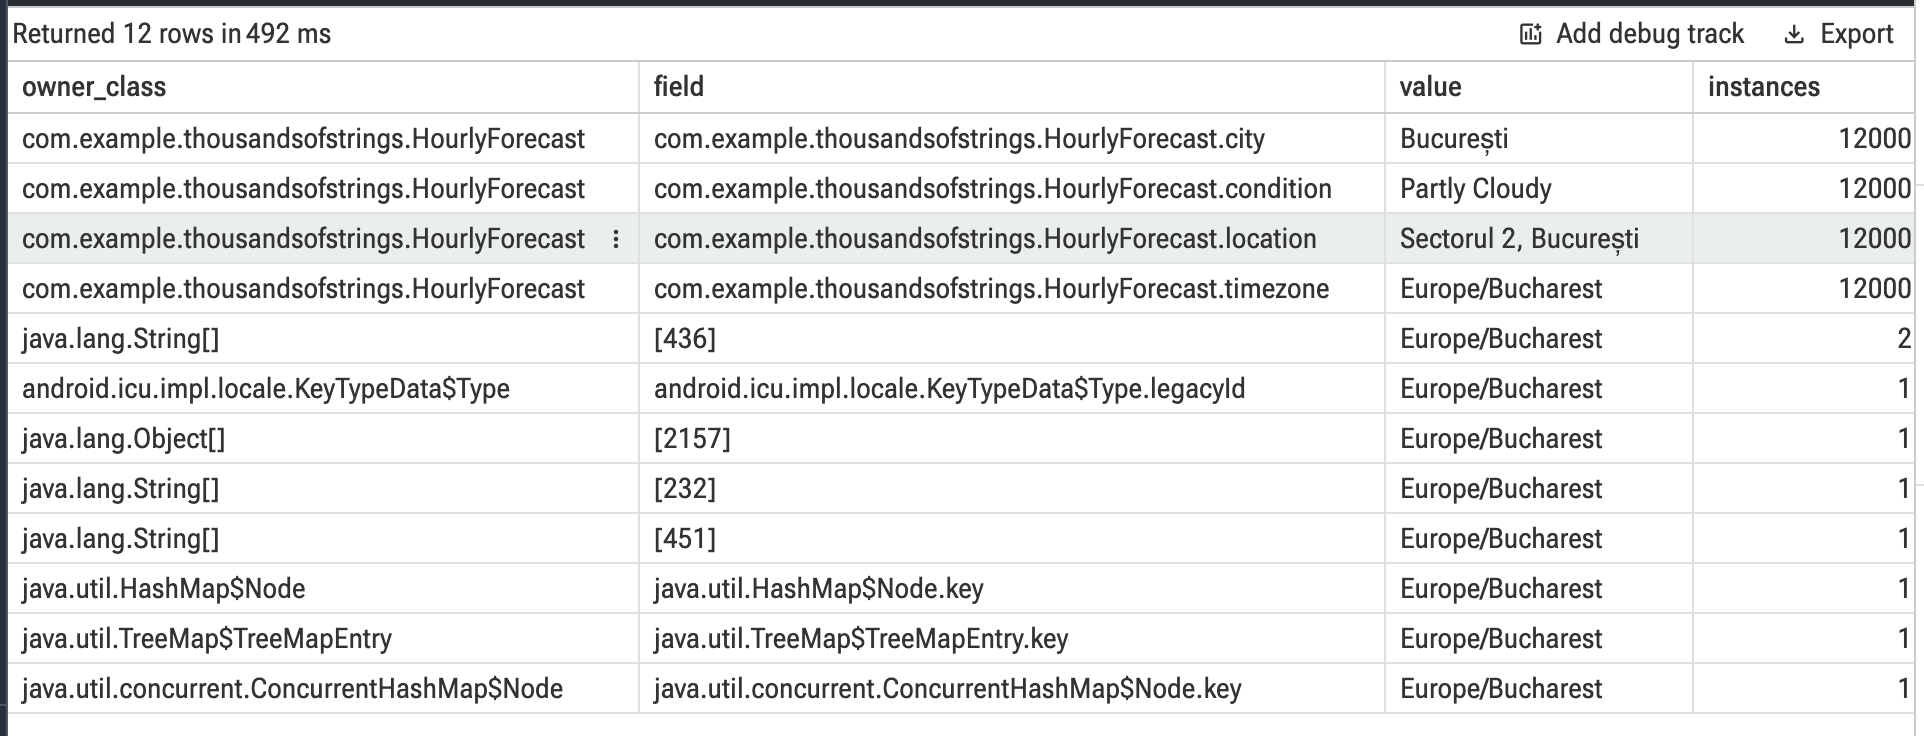 Figure 4: Grouping the duplicate strings by their owning class and field.
All 12,000 application copies trace back to the same class: com.example.thousandsofstrings.HourlyForecast, specifically its city, condition, location, and timezone fields. (The remaining rows at the bottom also explain why "Europe/Bucharest" had 12,004 instances in Figure 1 instead of 12,000: those extra 4 copies belong to Android's android.icu timezone tables.)
And if you want the full reference chain without writing SQL, you can click the 12000 link in the Copies column of Heapdump Explorer and click any instance to inspect its Shortest Path from GC Root:
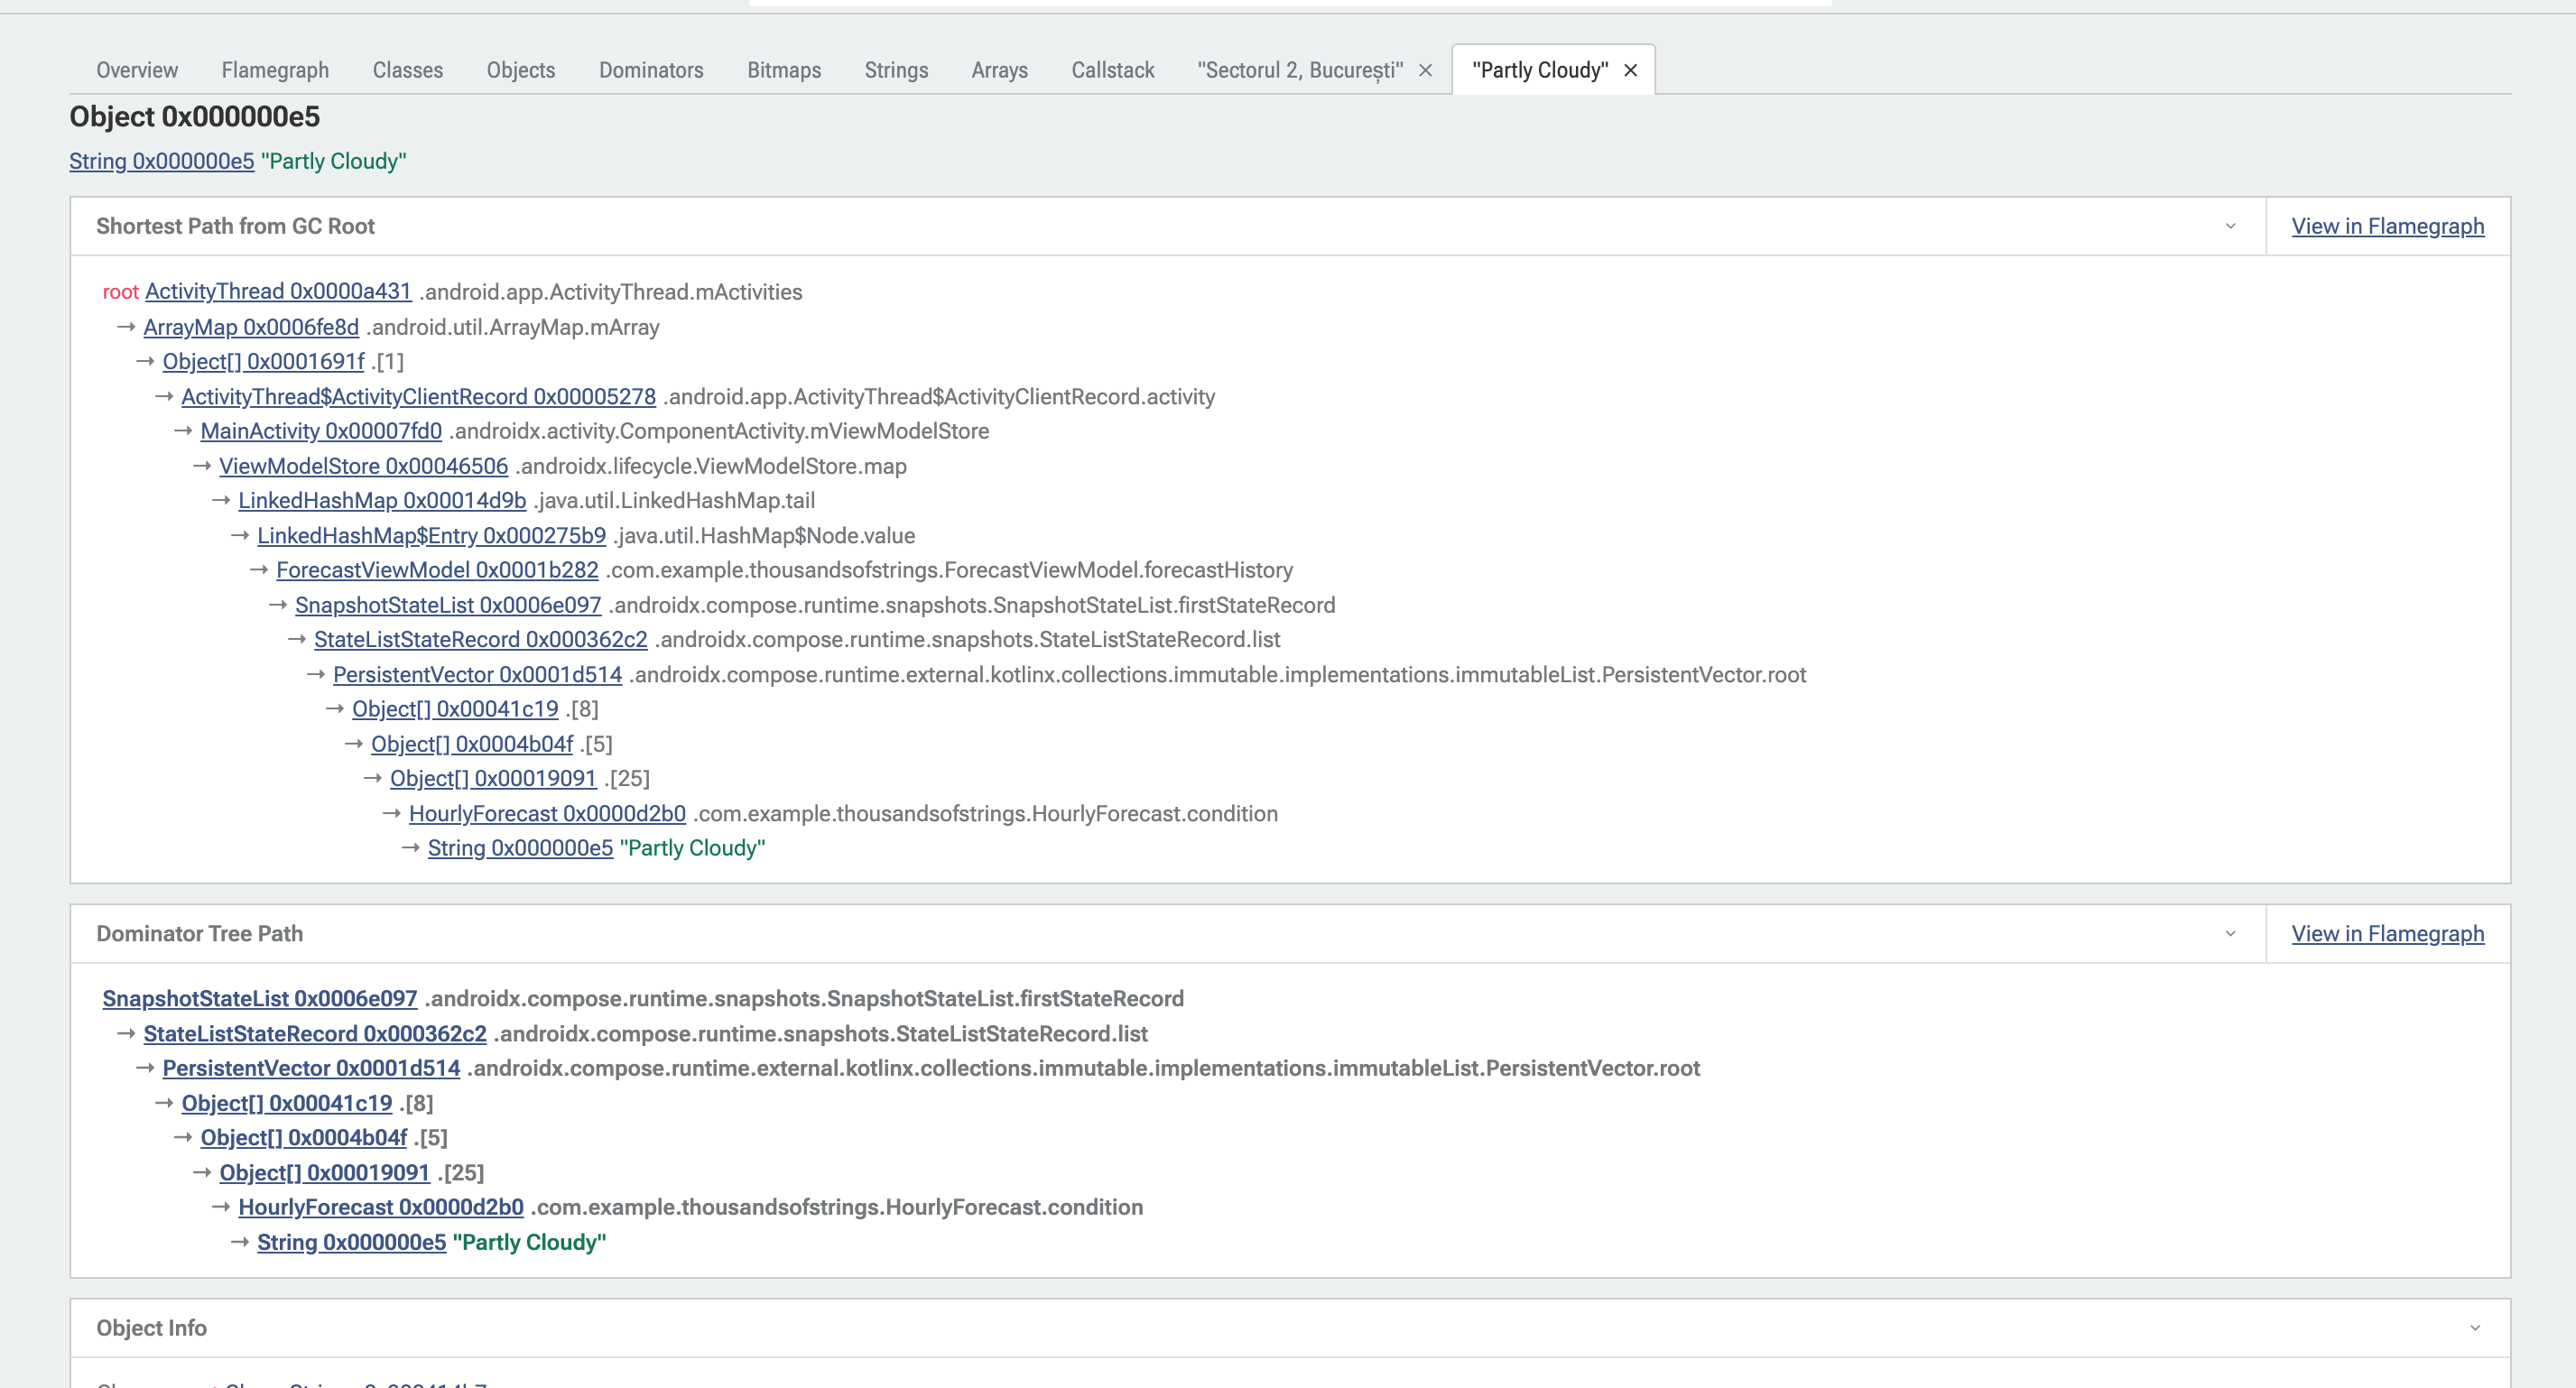
Figure 5: In Heapdump Explorer, clicking an instance shows its Shortest Path from GC Root, tracing straight through ForecastViewModel.forecastHistory down to HourlyForecast.condition.
The JSON trap
Why does HourlyForecast hold 12,000 separate copies of "Partly Cloudy" instead of pointing to a single shared String?
Look at the model and the payload:
data class HourlyForecast(
val time: String,
val timezone: String,
val location: String,
val city: String,
val condition: String,
val temp: Double
)[
{
"time": "2026-03-01T00:00:00Z",
"timezone": "Europe/Bucharest",
"location": "Sectorul 2, București",
"city": "București",
"condition": "Partly Cloudy",
"temp": 15.0
}
]When you write "Partly Cloudy" as a literal in Kotlin code, the compiler places it into the DEX string pool. At runtime, ART interns it and every reference in your code shares that single heap instance.
JSON parsers don't do that for string values.
Whether you use kotlinx.serialization, Moshi, Gson, or Jackson, a JSON parser's job is to turn a stream of bytes into objects as fast as possible. While modern parsers like Moshi and Jackson are clever enough to avoid allocating new strings for repeated JSON keys like "condition", they make no attempt to deduplicate string values. When the parser reads "Partly Cloudy" in the first object, it decodes those bytes from the buffer and allocates a fresh String on the heap. Moments later, when it reads "Partly Cloudy" on the second row, it has no memory of the first, so it allocates a brand-new String all over again.
The math
In our sample app, ForecastViewModel.forecastHistory holds 12,000 HourlyForecast objects in memory.
Because the JSON schema is flat, every hourly record carries the same timezone ("Europe/Bucharest"), location ("Sectorul 2, București"), city ("București"), and condition ("Partly Cloudy"). Since the parser allocates a fresh String for every value, each HourlyForecast instance brings 4 duplicate String allocations along with it:
- 12,000
HourlyForecastobjects × 4 repeated string fields = 48,000Stringallocations (2.3 MiB) - Plus the 5th field, time: 100 distinct hourly timestamps × 120 reloads = 12,000 more String allocations (the 120-copy rows just below the top four in Figure 3)
Together, those 5 fields account for 60,000 of the 61,752 String instances in the dump.
This N objects × M repeated fields multiplier often shows up in production apps. It comes not from memory leaks, but from legitimate data held in memory:
- Product catalogs & feeds: Thousands of items repeating the same category names, brand names, currency codes (
"EUR"), or availability labels ("In Stock"). - Messaging & social timelines: Thousands of cached messages repeating the same sender names, channel IDs, or delivery states (
"DELIVERED"). - Offline caches & sync tables: Thousands of deserialized JSON records or Room entities holding repeated timezones, locale strings, or status enums stored as text.
Even if your app legitimately needs thousands of domain objects in memory, they shouldn't each own a separate copy of "Partly Cloudy".
Fixing It
We want all 12,000 HourlyForecast objects to share a single String instance per distinct value, without rewriting our UI or ViewModel.
Depending on whether you control the serializer, there are two ways to do this.
Option 1: Deduplicating during JSON parsing
If you use kotlinx.serialization (or Moshi / Gson type adapters), the cleanest place to deduplicate is right inside the decoder, before the HourlyForecast instance is even constructed:
import androidx.collection.LruCache
import kotlinx.serialization.KSerializer
import kotlinx.serialization.Serializable
import kotlinx.serialization.builtins.serializer
import kotlinx.serialization.encoding.Decoder
object PooledStringSerializer : KSerializer<String> by String.serializer() {
private val pool = LruCache<String, String>(256)
override fun deserialize(decoder: Decoder): String {
val value = decoder.decodeString()
return synchronized(pool) {
pool[value] ?: value.also { pool.put(it, it) }
}
}
}
// Shorthand on Kotlin 1.8.20+ (or annotate properties directly with @Serializable(with = ...)):
typealias PooledString = StringThen apply PooledString to the repeated string fields on your model:
data class HourlyForecast(
val time: PooledString,
val timezone: PooledString,
val location: PooledString,
val city: PooledString,
val condition: PooledString,
val temp: Double
)Because PooledString resolves to kotlin.String, nothing in your ViewModel or Compose UI changes. And because deduplication happens before HourlyForecast is constructed, no extra wrapper objects are allocated. (Note: 256 entries easily holds our 4 location/condition strings plus all hourly timestamp strings; if you share a serializer across multiple models in a large app, size the LruCache to fit your working set so one model doesn't evict another's strings.)
Option 2: Post-load deduplication (When you don't control the parser)
Sometimes you can't hook into the serializer, for example, when models come from a third-party SDK, a legacy parser, or generated code.
In that case, you can pass the parsed HourlyForecast list through a small StringPool right after loading (keeping in mind that .copy() allocates a new HourlyForecast per row, turning the original un-pooled instances and their duplicate strings into short-lived garbage for young-generation GC to clean up):
class StringPool(maxSize: Int = 256) {
    private val cache = LruCache<String, String>(maxSize)

    fun intern(value: String): String = synchronized(cache) {
       cache[value] ?: value.also { cache.put(it, it) }
    }
}

fun HourlyForecast.deduplicated(pool: StringPool) = copy(
    time = pool.intern(time),
    timezone = pool.intern(timezone),
    location = pool.intern(location),
    city = pool.intern(city),
    condition = pool.intern(condition)
)

// Reused in your repository/data source across loads:
private val stringPool = StringPool()

// Applied when loading from disk/network:
val forecasts = rawForecasts.map { it.deduplicated(stringPool) }
(Tip: Use a bounded LruCache like StringPool above when the pool lives across multiple requests. If you only need to deduplicate within a single one-shot list, a local val pool = HashMap<String, String>() with pool.getOrPut(s) { s } is even lighter and is garbage-collected as soon as the function returns. And because LruCache<T, T> and HashMap<T, T> only rely on equals() and hashCode(), the exact same pattern works to deduplicate repeated immutable sub-objects (such as nested data classes or generated Protobuf messages), not just Strings.)
LruCache vs. String.intern() on ART
You might wonder why PooledStringSerializer above uses an LruCache instead of calling Java's built-in String.intern() on every field. Both work on Android, but they have different runtime trade-offs:
- What
String.intern()gets right on ART: Unlike a naivestatic HashMap<String, String>(which holds strong references), ART stores runtime-interned strings in a native weak intern table (weak_interns_). OnceforecastHistoryis cleared and nothing references"Partly Cloudy", ART's garbage collector automatically sweeps it out ofweak_interns_(SweepInternTableWeaks) and reclaims the memory. It also shares instances process-wide across every library and module in your app. - The catch with
String.intern()in tight loops: Every call to.intern()transitions into native code (@FastNative) and acquires ART's process-wide mutex (Locks::intern_table_lock_). Interning 5 fields across 12,000 rows means 60,000 global lock acquisitions (contending with class loading and other background threads) and adds entries that the GC must scan during weak-root sweeps. - Why a scoped map or
LruCacheis faster for batch parsing: A boundedLruCache<String, String>(or even simpler, a plainHashMap<String, String>created for a single JSON decode pass and discarded immediately after) runs 100% in Kotlin memory with zero JNI overhead and zero global lock contention.
Verifying the fix
After applying PooledString and capturing a new heap dump, we can open Heapdump Explorer in Perfetto to compare the Overview tab against Figure 3:
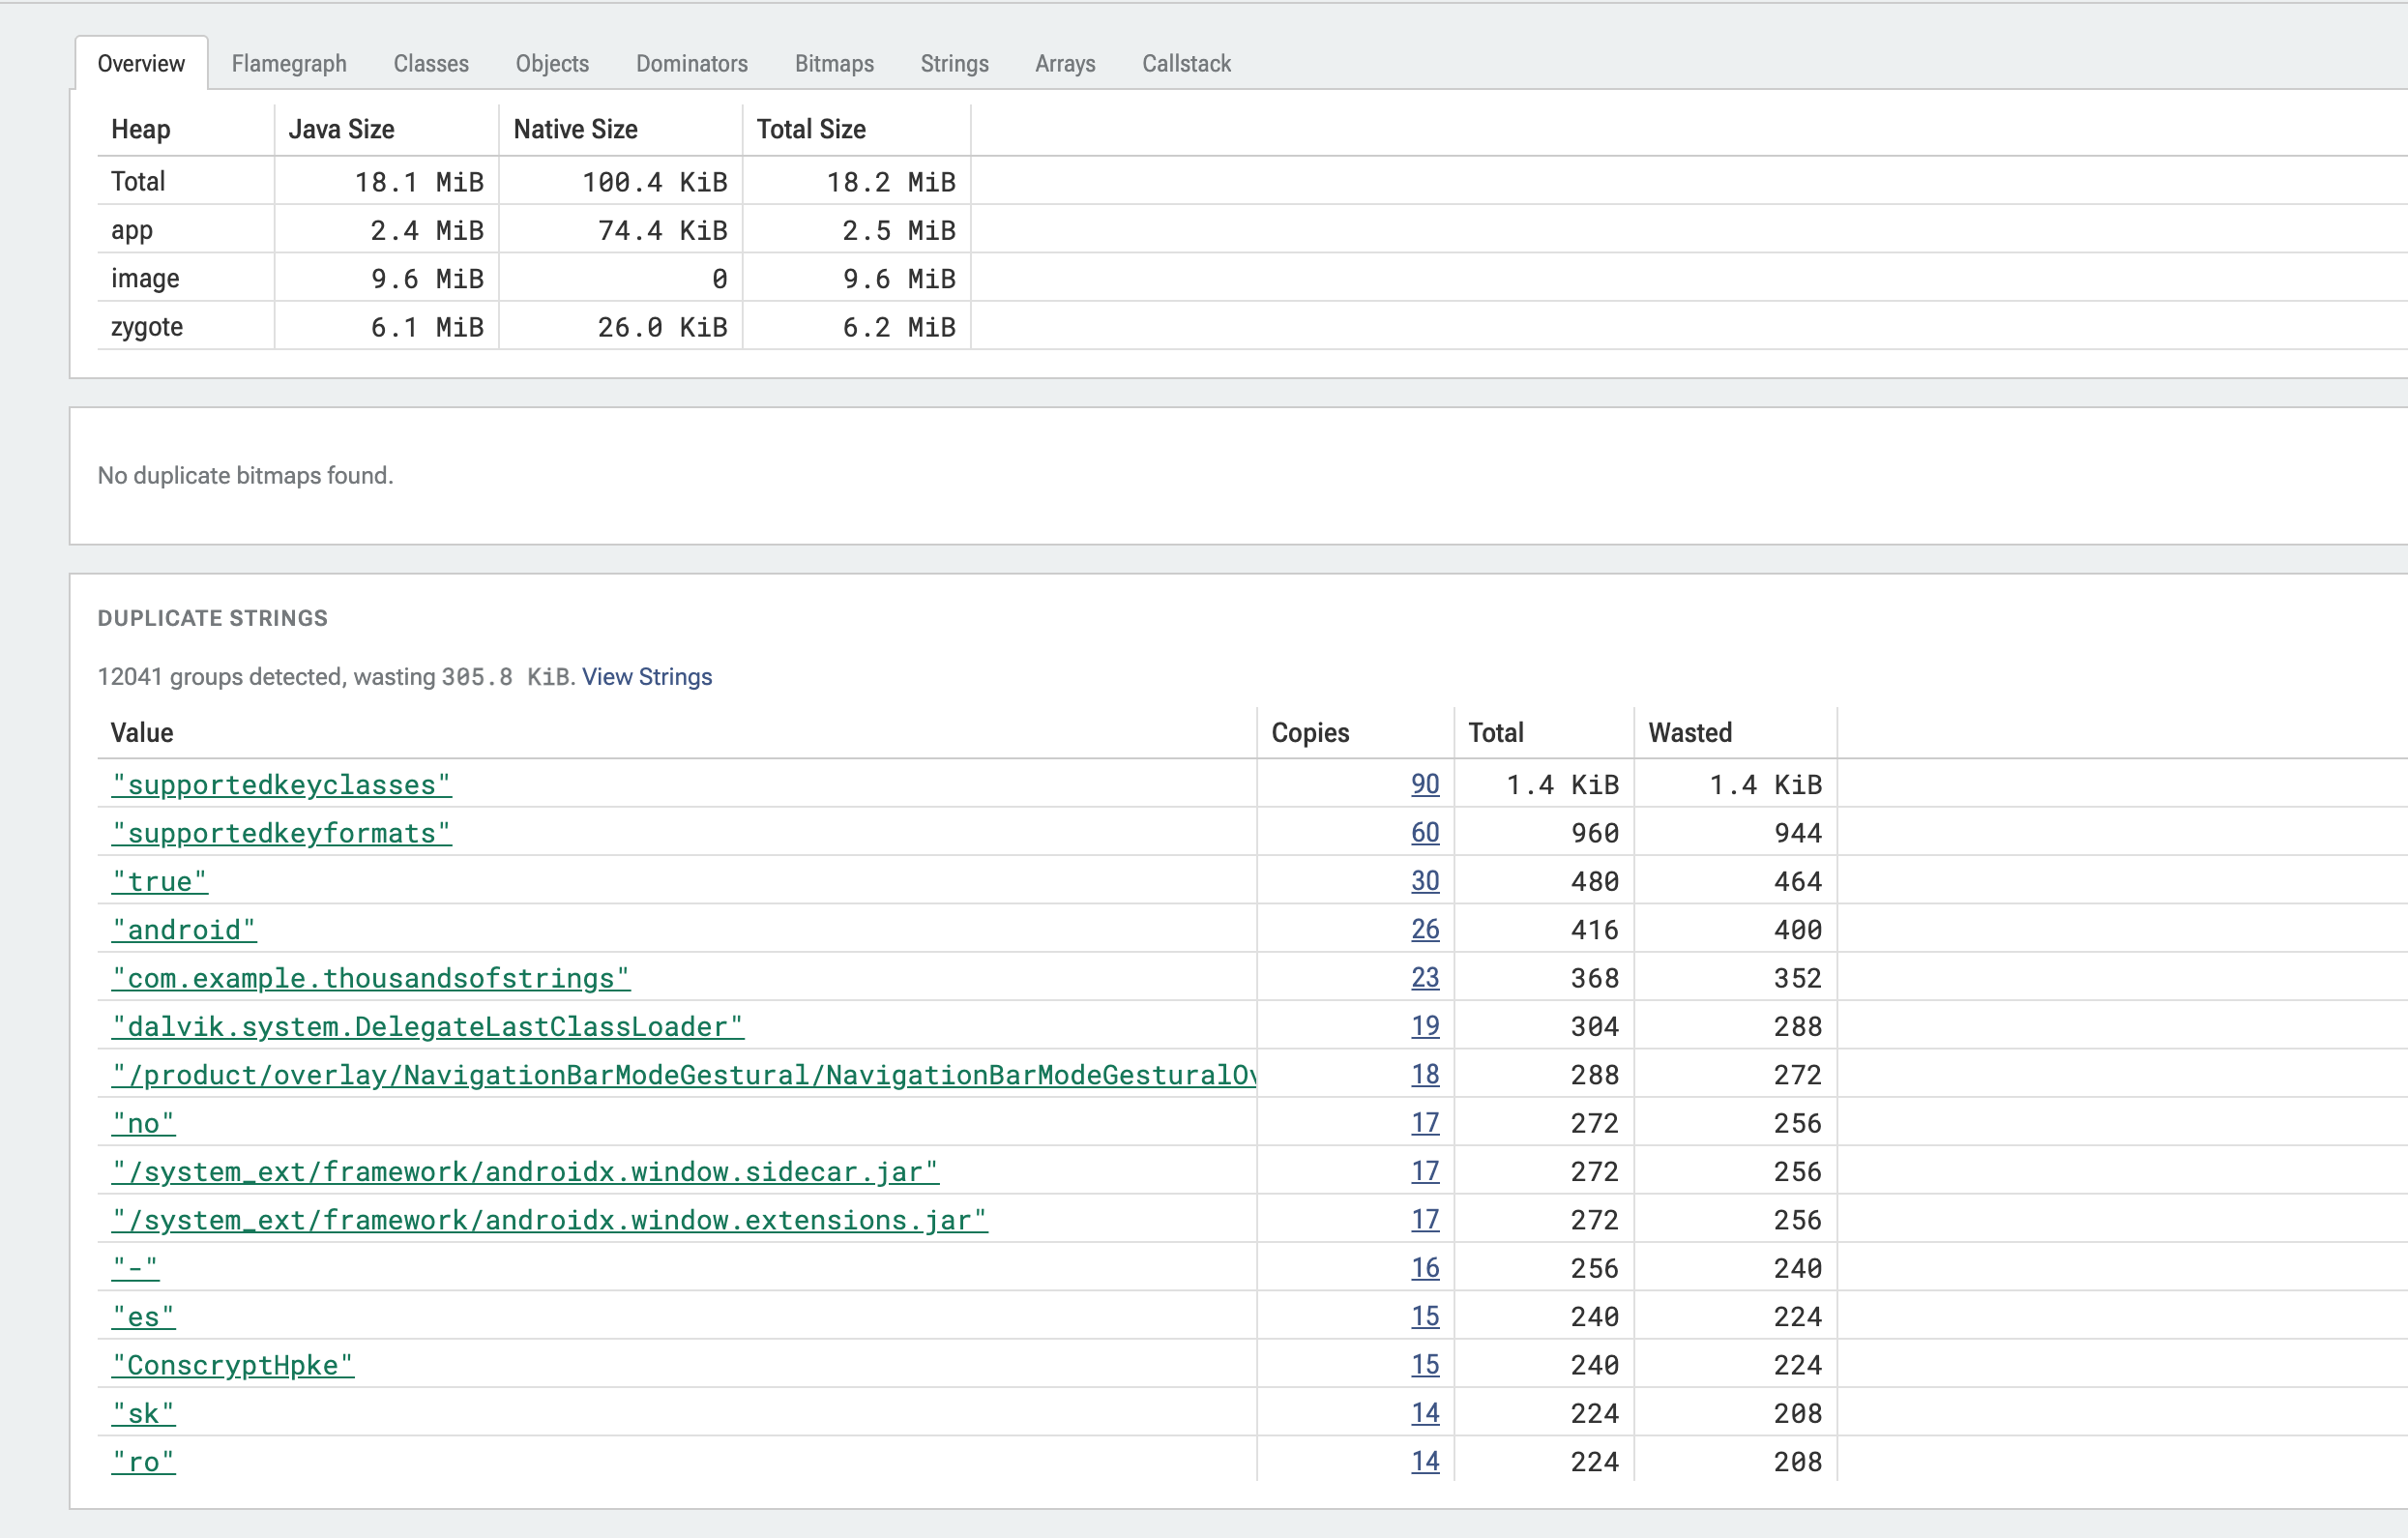
Figure 6: Heapdump Explorer's Overview tab after deduplicating. Every weather and timestamp string has vanished from Duplicate Strings, leaving only small Android framework strings ("supportedkeyclasses", "true", "android").
To confirm that all 12,000 HourlyForecast objects are still in memory and now share a single String instance per value, we can run one final SQL check:
SELECT
  od.value_string AS value,
  COUNT(DISTINCT o.id) AS string_instances,
  COUNT(r.id) AS forecast_references
FROM heap_graph_object o
JOIN heap_graph_object_data od ON od.id = o.object_data_id
JOIN heap_graph_reference r ON r.owned_id = o.id
WHERE o.reachable = 1
  AND r.field_name GLOB '*HourlyForecast*'
  AND od.value_string IN (
    'Europe/Bucharest',
    'Sectorul 2, București',
    'Partly Cloudy',
    'București'
  )
GROUP BY od.value_string;
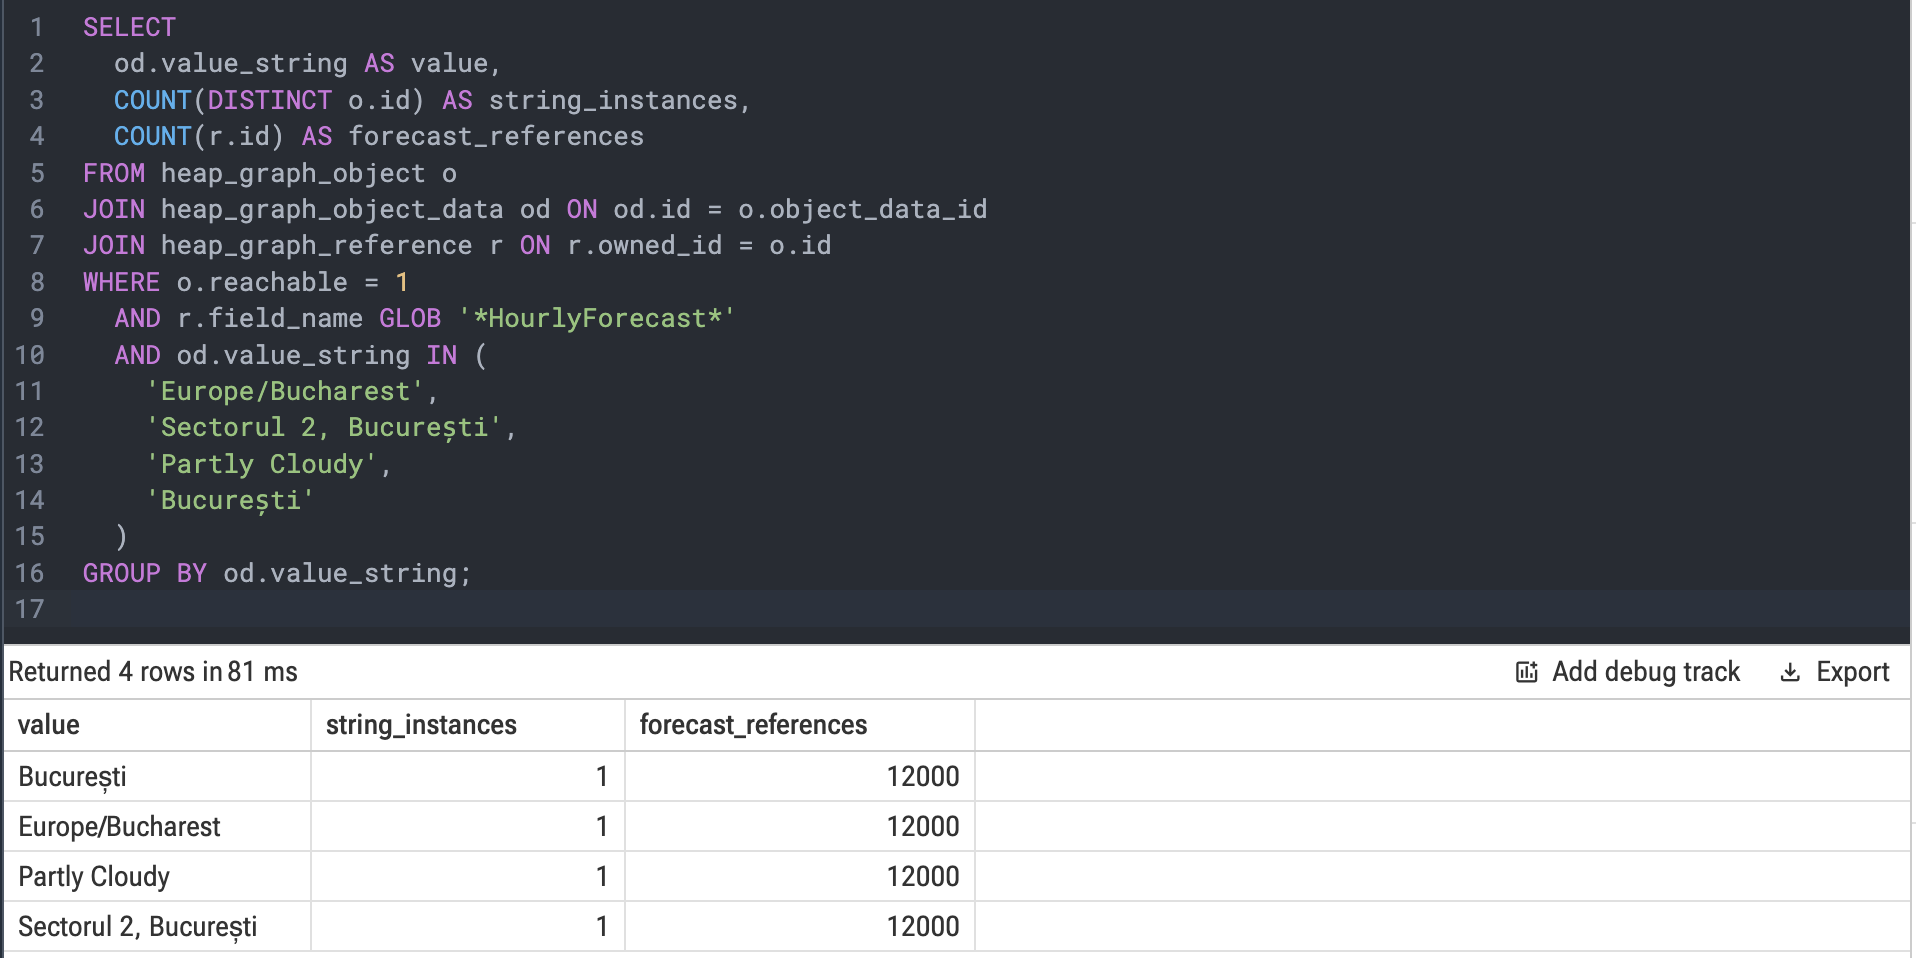
*Figure 7: Every row now reports 1 string_instance and 12,000 forecast_references. All 12,000 HourlyForecast objects are pointing to the exact same four String addresses on the heap.*
When not to deduplicate
Before you pool every string in your app, keep three guardrails in mind:
- Never pool truly unique strings: In our forecast,
timeis quantized to whole hours ("2026-03-05T03:00:00Z"), so the same 100 distinct strings repeat across reloads. By contrast, if a field holds UUIDs, millisecond timestamps, search queries, or unique URLs where every row is different, pooling saves zero memory while paying the CPU and cache-eviction cost on every row. - Never use an unbounded strong map: A
static ConcurrentHashMap<String, String>that never evicts is a memory leak in disguise. Always use a boundedLruCache, a short-livedHashMapscoped to a single parse pass, orString.intern()(for low-volume process-wide strings). - Only optimize what stays reachable: If a response is parsed, mapped to a small UI summary, and immediately discarded, short-lived duplicate strings are cleaned up in microseconds by ART's young-generation collector. Only target strings that survive in
WHERE o.reachable = 1.
Takeaways
Next time String is sitting at the top of your heap dump:
- Group by value, not by instance: Drag your
.hprofinto ui.perfetto.dev and check Heapdump Explorer → Overview, or run aGROUP BY value_stringquery in PerfettoSQL to join each string with its backingbyte[]/char[]array. - Trace back to the parser: JSON and Protobuf deserializers optimize for speed, not string reuse. They allocate a fresh
Stringon every row even when the text is identical. - Pool only what repeats and stays alive: A small bounded
LruCacheinside your serializer (or a post-load pass on immutable sub-objects) collapses thousands of duplicate strings down to a single shared instance, without touching your UI or ViewModel.
Grab a heap dump from your own app, drop it into Perfetto, and see what's sitting at #1 in Duplicate Strings. You can even point your coding agent at it with the Perfetto AI Skill. If you uncover a surprising duplication culprit don’t hesitate to share it.