
Debugging memory usage on Android
In this guide, you'll learn how to:
- Use
dumpsys meminfoto get a high-level overview of memory usage. - Understand the basics of Linux memory management.
- Use Perfetto to investigate memory usage over time.
- Analyze native heap profiles and ART heap dumps to identify memory leaks.
Prerequisites
- A host running macOS or Linux.
- ADB installed and in PATH.
- A device running Android 11+.
If you are profiling your own app and are not running a userdebug build of Android, your app needs to be marked as profileable or debuggable in its manifest. See the heapprofd documentation for more details on which applications can be targeted.
dumpsys meminfo
A good place to get started investigating memory usage of a process is
dumpsys meminfo which gives a high-level overview of how much of the various
types of memory are being used by a process.
$ adb shell dumpsys meminfo com.android.systemui

Applications Memory Usage (in Kilobytes):
Uptime: 2030149 Realtime: 2030149

** MEMINFO in pid 1974 [com.android.systemui] **
                   Pss  Private  Private  SwapPss      Rss     Heap     Heap     Heap
                 Total    Dirty    Clean    Dirty    Total     Size    Alloc     Free
                ------   ------   ------   ------   ------   ------   ------   ------
  Native Heap    16840    16804        0     6764    19428    34024    25037     5553
  Dalvik Heap     9110     9032        0      136    13164    36444     9111    27333

[more stuff...]
Looking at the "Private Dirty" column of Dalvik Heap (= Java Heap) and Native Heap, we can see that SystemUI's memory usage on the Java heap is 9M, on the native heap it's 17M.
Linux memory management
But what does clean, dirty, Rss, Pss, Swap actually mean? To answer this question, we need to delve into Linux memory management a bit.
From the kernel's point of view, memory is split into equally sized blocks called pages. These are generally 4KiB.
Pages are organized in virtually contiguous ranges called VMA (Virtual Memory Area).
VMAs are created when a process requests a new pool of memory pages through the
mmap() system call.
Applications rarely call mmap() directly. Those calls are typically mediated by
the allocator, malloc()/operator new() for native processes or by the Android
RunTime for Java apps.
VMAs can be of two types: file-backed and anonymous.
File-backed VMAs are a view of a file in memory. They are obtained passing a
file descriptor to mmap(). The kernel will serve page faults on the VMA
through the passed file, so reading a pointer to the VMA becomes the equivalent
of a read() on the file. File-backed VMAs are used, for instance, by the
dynamic linker (ld) when executing new processes or dynamically loading
libraries, or by the Android framework, when loading a new .dex library or
accessing resources in the APK.
Anonymous VMAs are memory-only areas not backed by any file. This is the way
allocators request dynamic memory from the kernel. Anonymous VMAs are obtained
calling mmap(... MAP_ANONYMOUS ...).
Physical memory is only allocated, in page granularity, once the application tries to read/write from a VMA. If you allocate 32 MiB worth of pages but only touch one byte, your process' memory usage will only go up by 4KiB. You will have increased your process' virtual memory by 32 MiB, but its resident physical memory by 4 KiB.
When optimizing memory use of programs, we are interested in reducing their footprint in physical memory. High virtual memory use is generally not a cause for concern on modern platforms (except if you run out of address space, which is very hard on 64 bit systems).
We call the amount a process' memory that is resident in physical memory its RSS (Resident Set Size). Not all resident memory is equal though.
From a memory-consumption viewpoint, individual pages within a VMA can have the following states:
- Resident: the page is mapped to a physical memory page. Resident pages can
be in two states:
- Clean (only for file-backed pages): the contents of the page are the same of the contents on-disk. The kernel can evict clean pages more easily in case of memory pressure. This is because if they should be needed again, the kernel knows it can re-create its contents by reading them from the underlying file.
- Dirty: the contents of the page diverge from the disk, or (in most cases), the page has no disk backing (i.e. it's anonymous). Dirty pages cannot be evicted because doing so would cause data loss. However they can be swapped out on disk or ZRAM, if present.
- Swapped: a dirty page can be written to the swap file on disk (on most Linux desktop distributions) or compressed (on Android and CrOS through ZRAM). The page will stay swapped until a new page fault on its virtual address happens, at which point the kernel will bring it back in main memory.
- Not present: no page fault ever happened on the page or the page was clean and later was evicted.
It is generally more important to reduce the amount of dirty memory as that
cannot be reclaimed like clean memory and, on Android, even if swapped in
ZRAM, will still eat part of the system memory budget. This is why we looked at
Private Dirty in the dumpsys meminfo example.
Shared memory can be mapped into more than one process. This means VMAs in
different processes refer to the same physical memory. This typically happens
with file-backed memory of commonly used libraries (e.g., libc.so,
framework.dex) or, more rarely, when a process fork()s and a child process
inherits dirty memory from its parent.
This introduces the concept of PSS (Proportional Set Size). In PSS, memory that is resident in multiple processes is proportionally attributed to each of them. If we map one 4KiB page into four processes, each of their PSS will increase by 1KiB.
Recap
- Dynamically allocated memory, whether allocated through C's
malloc(), C++'soperator new()or Java'snew X()starts always as anonymous and dirty, unless it is never used. - If this memory is not read/written for a while, or in case of memory pressure, it gets swapped out on ZRAM and becomes swapped.
- Anonymous memory, whether resident (and hence dirty) or swapped is always a resource hog and should be avoided if unnecessary.
- File-mapped memory comes from code (java or native), libraries and resource and is almost always clean. Clean memory also erodes the system memory budget but typically application developers have less control on it.
Memory over time
dumpsys meminfo is good to get a snapshot of the current memory usage, but
even very short memory spikes can lead to low-memory situations, which will lead
to LMKs. We have two tools to investigate situations like this
- RSS High Watermark.
- Memory tracepoints.
RSS High Watermark
We can get a lot of information from the /proc/[pid]/status file, including
memory information. VmHWM shows the maximum RSS usage the process has seen
since it was started. This value is kept updated by the kernel.
$ adb shell cat '/proc/$(pidof com.android.systemui)/status'
[...]
VmHWM:    256972 kB
VmRSS:    195272 kB
RssAnon:  30184 kB
RssFile:  164420 kB
RssShmem: 668 kB
VmSwap:   43960 kB
[...]
Memory tracepoints
NOTE: For detailed instructions about the memory trace points see the Data sources > Memory > Counters and events page.
We can use Perfetto to get information about memory management events from the kernel.
$ adb shell perfetto \
  -c - --txt \
  -o /data/misc/perfetto-traces/trace \
<<EOF

buffers: {
    size_kb: 8960
    fill_policy: DISCARD
}
buffers: {
    size_kb: 1280
    fill_policy: DISCARD
}
data_sources: {
    config {
        name: "linux.process_stats"
        target_buffer: 1
        process_stats_config {
            scan_all_processes_on_start: true
        }
    }
}
data_sources: {
    config {
        name: "linux.ftrace"
        ftrace_config {
            ftrace_events: "mm_event/mm_event_record"
            ftrace_events: "kmem/rss_stat"
            ftrace_events: "kmem/ion_heap_grow"
            ftrace_events: "kmem/ion_heap_shrink"
        }
    }
}
duration_ms: 30000

EOF
While it is running, take a photo if you are following along.
Pull the file using adb pull /data/misc/perfetto-traces/trace ~/mem-trace and
upload to the Perfetto UI. This will show overall
stats about system ION usage, and per-process stats to expand. Scroll
down (or Ctrl-F for) to com.google.android.GoogleCamera and expand. This will
show a timeline for various memory stats for camera.
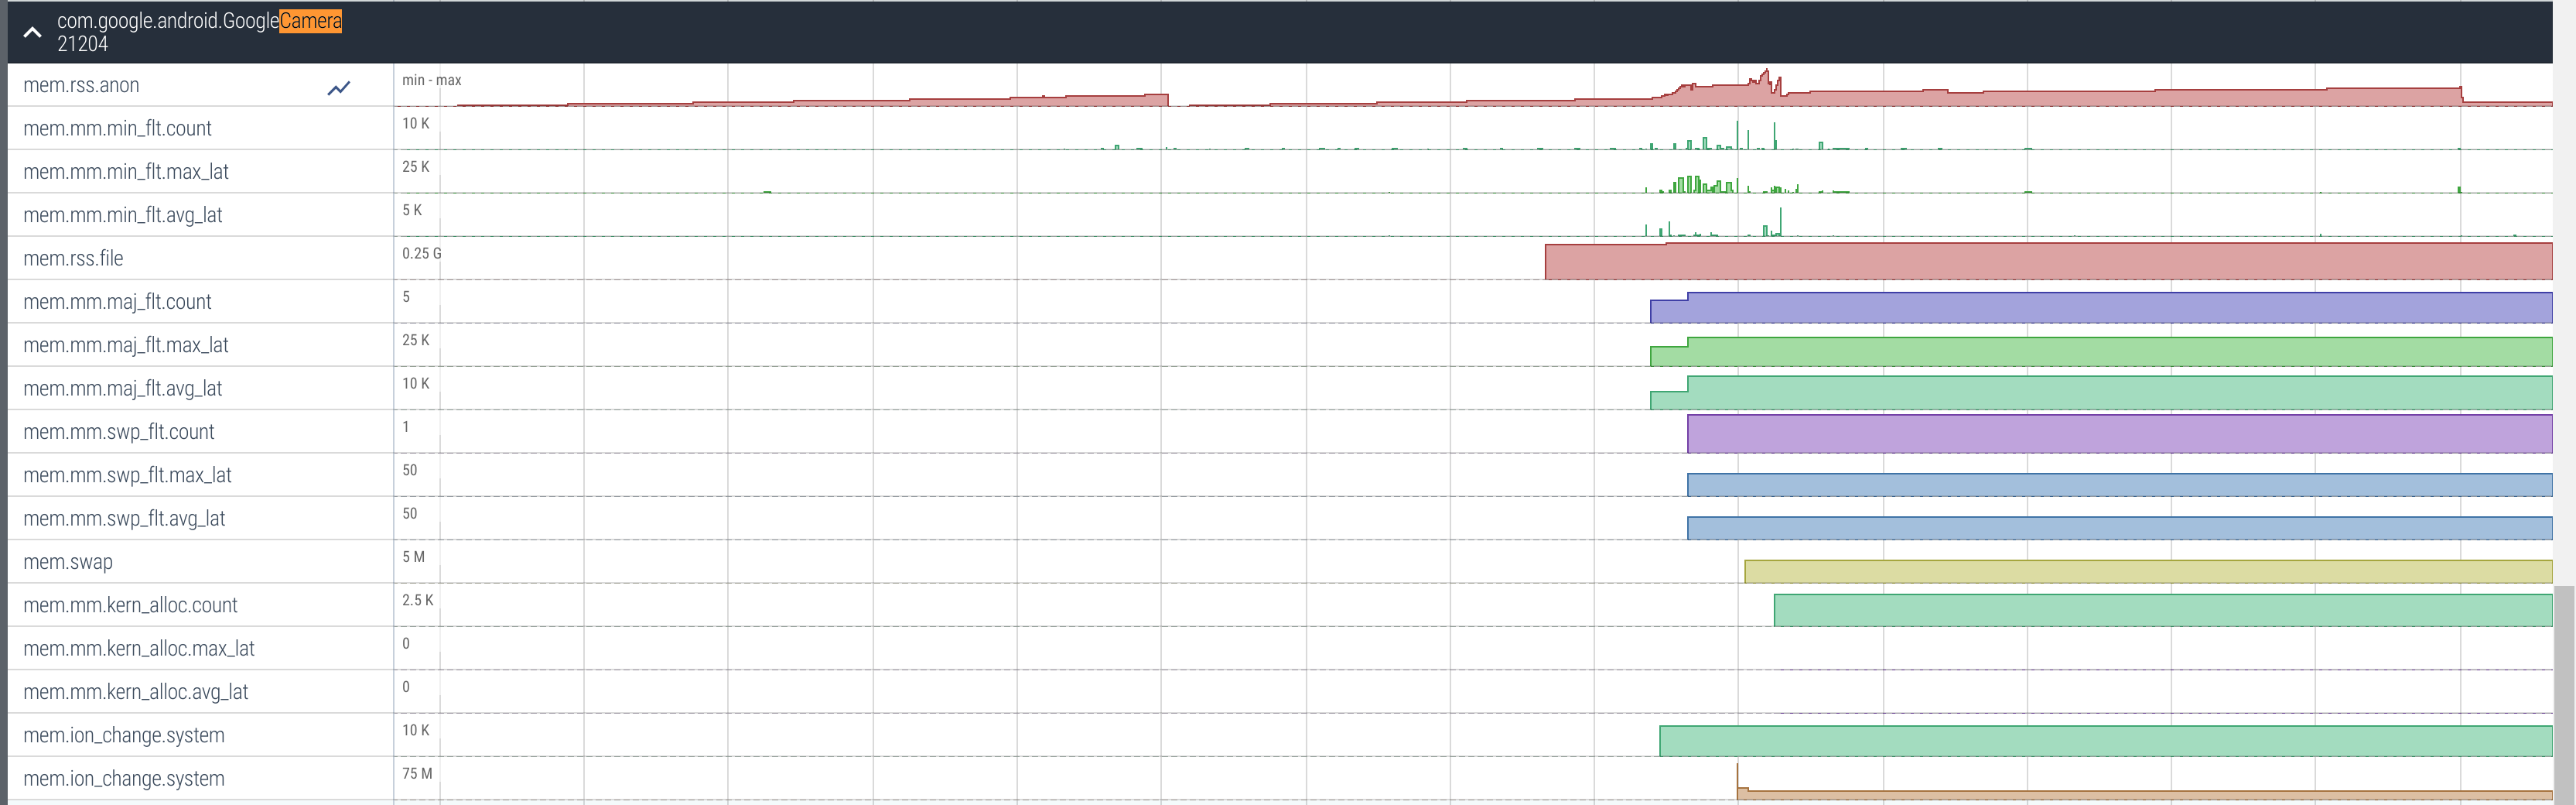
We can see that around 2/3 into the trace, the memory spiked (in the mem.rss.anon track). This is where I took a photo. This is a good way to see how the memory usage of an application reacts to different triggers.
Which tool to use
If you want to drill down into anonymous memory allocated by Java code,
labeled by dumpsys meminfo as Dalvik Heap, see the
Analyzing the java heap section.
If you want to drill down into anonymous memory allocated by native code,
labeled by dumpsys meminfo as Native Heap, see the
Analyzing the Native Heap section. Note that it's frequent to end
up with native memory even if your app doesn't have any C/C++ code. This is
because the implementation of some framework API (e.g. Regex) is internally
implemented through native code.
If you want to drill down into file-mapped memory the best option is to use
adb shell showmap PID (on Android) or inspect /proc/PID/smaps.
Low-memory kills
When an Android device becomes low on memory, a daemon called lmkd will start
killing processes in order to free up memory. Devices' strategies differ, but in
general processes will be killed in order of descending oom_score_adj score
(i.e. background apps and processes first, foreground processes last).
Apps on Android are not killed when switching away from them. They instead
remain cached even after the user finishes using them. This is to make
subsequent starts of the app faster. Such apps will generally be killed first
(because they have a higher oom_score_adj).
We can collect information about LMKs and oom_score_adj using Perfetto.
$ adb shell perfetto \
  -c - --txt \
  -o /data/misc/perfetto-traces/trace \
<<EOF

buffers: {
    size_kb: 8960
    fill_policy: DISCARD
}
buffers: {
    size_kb: 1280
    fill_policy: DISCARD
}
data_sources: {
    config {
        name: "linux.process_stats"
        target_buffer: 1
        process_stats_config {
            scan_all_processes_on_start: true
        }
    }
}
data_sources: {
    config {
        name: "linux.ftrace"
        ftrace_config {
            ftrace_events: "lowmemorykiller/lowmemory_kill"
            ftrace_events: "oom/oom_score_adj_update"
            ftrace_events: "ftrace/print"
            atrace_apps: "lmkd"
        }
    }
}
duration_ms: 60000

EOF
Pull the file using adb pull /data/misc/perfetto-traces/trace ~/oom-trace and
upload to the Perfetto UI.

We can see that the OOM score of Camera gets reduced (making it less likely to be killed) when it is opened, and gets increased again once it is closed.
Analyzing the Native Heap
Native Heap Profiles require Android 10.
NOTE: For detailed instructions about the native heap profiler and troubleshooting see the Data sources > Heap profiler page.
Applications usually get memory through malloc or C++'s new rather than
directly getting it from the kernel. The allocator makes sure that your memory
is more efficiently handled (i.e. there are not many gaps) and that the overhead
from asking the kernel remains low.
We can log the native allocations and frees that a process does using heapprofd. The resulting profile can be used to attribute memory usage to particular function callstacks, supporting a mix of both native and Java code. The profile will only show allocations done while it was running, any allocations done before will not be shown.
Capturing the profile
Use the tools/heap_profile script with the android subcommand to profile
a process on a connected Android device. If you are having trouble make sure
you are using the
latest version.
See all the arguments using tools/heap_profile android -h, or use the
defaults and just profile a process (e.g. system_server):
$ tools/heap_profile android -n system_server

Profiling active. Press Ctrl+C to terminate.
You may disconnect your device.

Wrote profiles to /tmp/profile-1283e247-2170-4f92-8181-683763e17445 (symlink /tmp/heap_profile-latest)
The raw-trace and heap_dump.* (pprof) files can be visualized with https://ui.perfetto.dev.
When you see Profiling active, play around with the phone a bit. When you are done, press Ctrl-C to end the profile. For this tutorial, I opened a couple of apps.
Viewing the data
Then upload the raw-trace file from the output directory to the
Perfetto UI and click on diamond marker that shows.

The tabs that are available are
- Unreleased malloc size: how many bytes were allocated but not freed at this callstack the moment the dump was created.
- Total malloc size: how many bytes were allocated (including ones freed at the moment of the dump) at this callstack.
- Unreleased malloc count: how many allocations without matching frees were done at this callstack.
- Total malloc count: how many allocations (including ones with matching frees) were done at this callstack.
The default view will show you all allocations that were done while the profile was running but that weren't freed (the space tab).
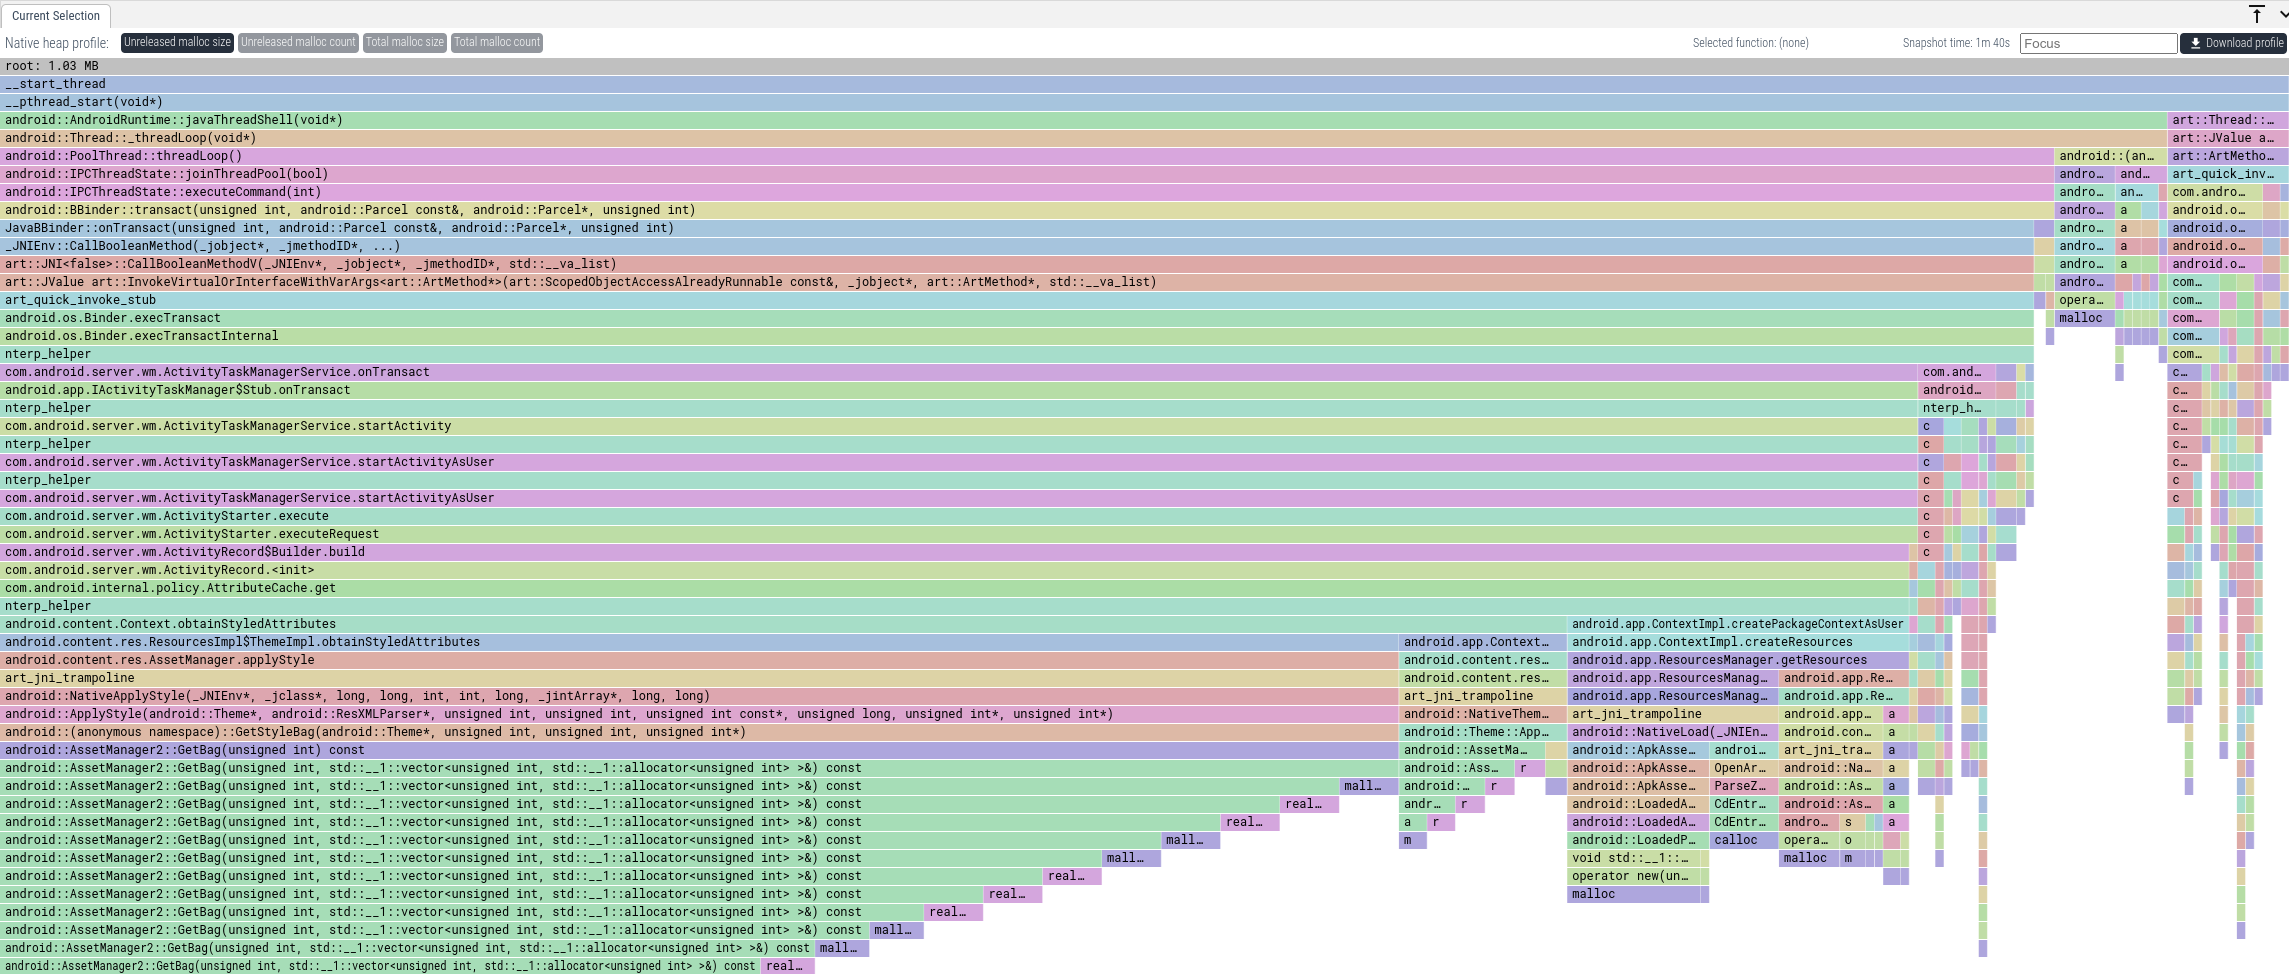
We can see that a lot of memory gets allocated in paths through
AssetManager.applyStyle. To get the total memory that was allocated this way,
we can enter "applyStyle" into the Focus textbox. This will only show callstacks
where some frame matches "applyStyle".
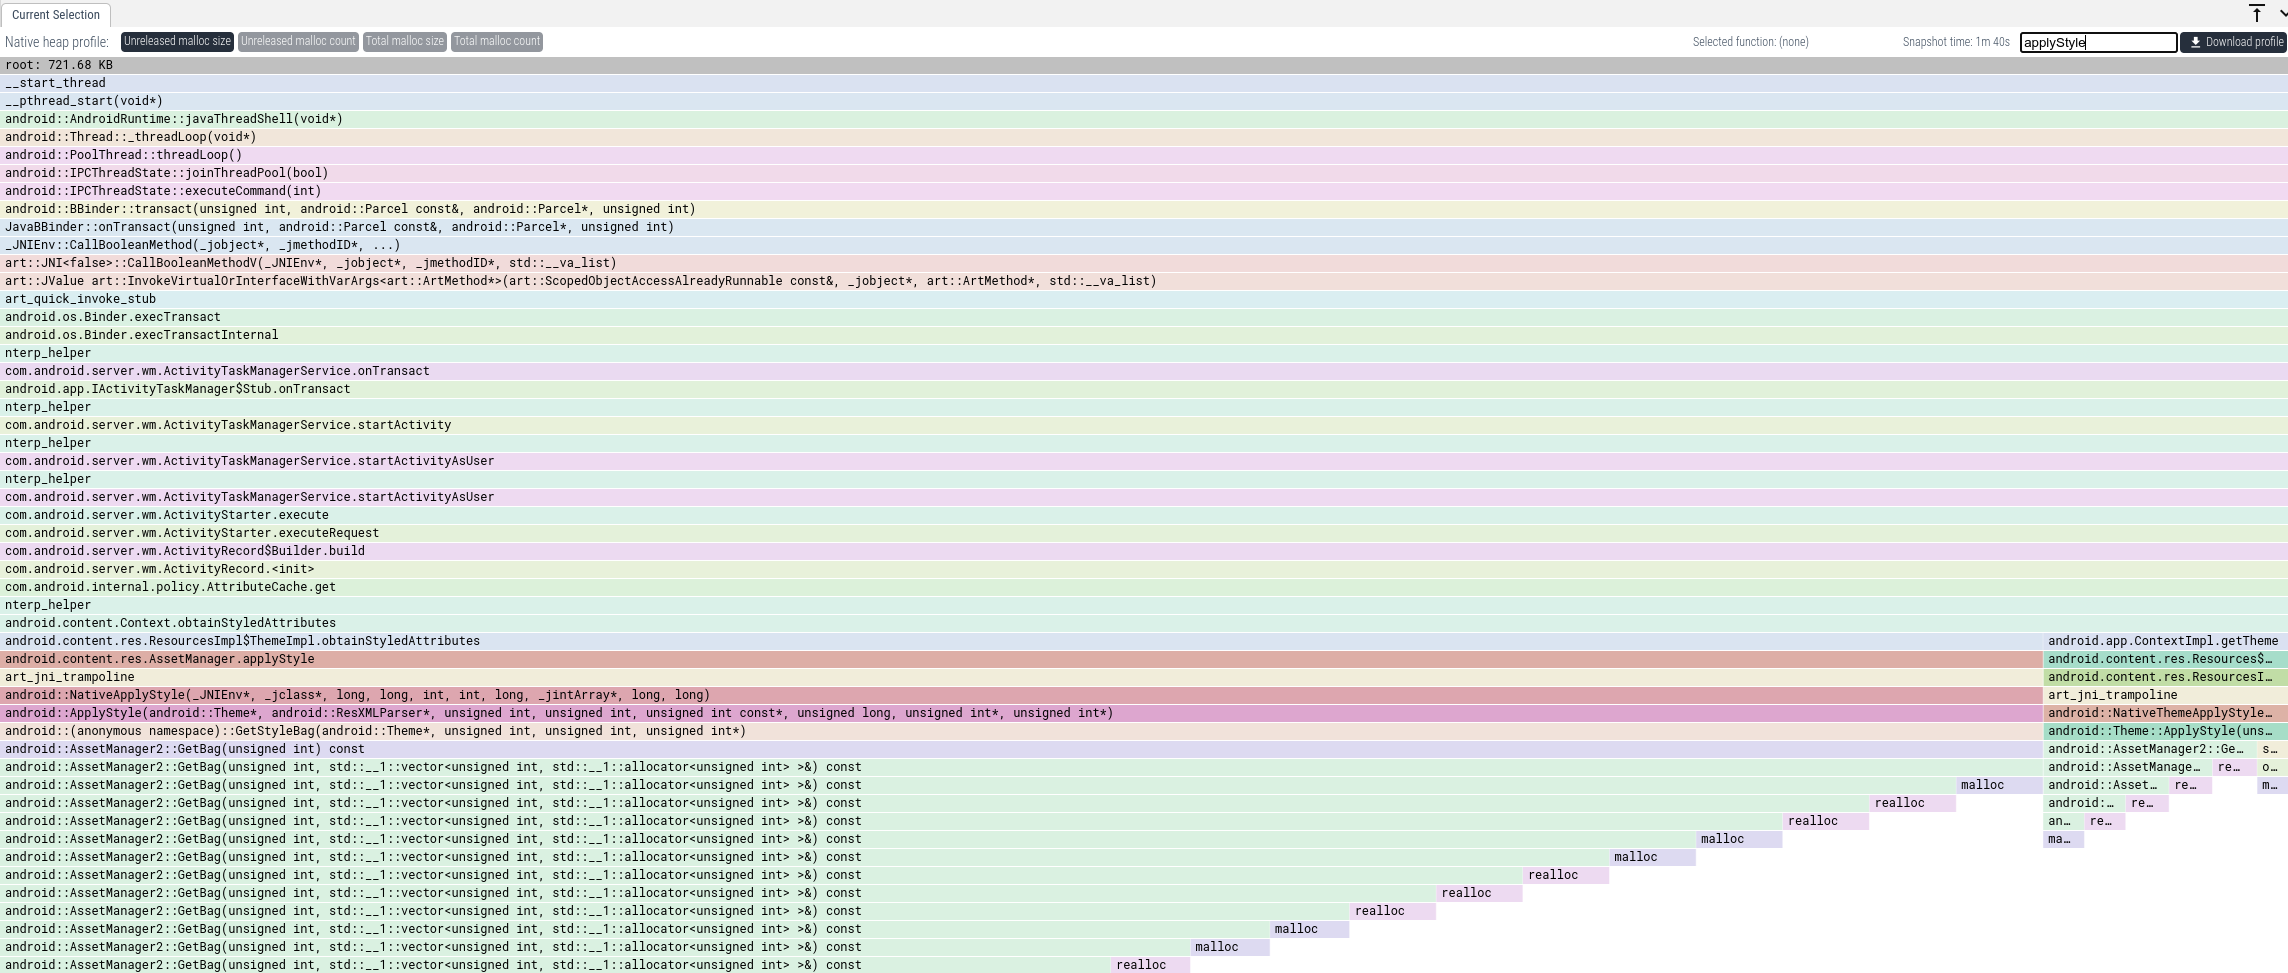
From this we have a clear idea where in the code we have to look. From the code we can see how that memory is being used and if we actually need all of it.
Profiling raw mmap calls
Most native memory allocations happen via malloc, which heapprofd (the Native
Heap Profiler above) sees. However, some components (e.g. ART, graphics drivers,
custom allocators) may request memory directly from the kernel using
mmap. These allocations are invisible to heapprofd.
To debug these, we can leverage the fact that mmap calls are relatively rare
(compared to malloc). Unlike CPU profiling where we sample frequently to
minimize overhead, for mmap we can record every single event without
significant performance impact.
We can achieve this using two data sources:
linux.ftracewithsyscall_events: This gives us the timestamp, arguments (size, flags), and return value of every mmap call. Requires Android 14 (U) or newer.linux.perf: We can configure the perf sampler to trigger on themmapsyscall. Crucially, we setperiod: 1to capture a callstack for every occurrence. Supported on Android 12 (S) or newer.
Using Perfetto
You can combine both data sources in a single Perfetto config.
Note: The syscall ID for mmap varies by architecture.
- arm64:
222(used in the example below) - x86_64:
9
buffers: {
    size_kb: 63488
    fill_policy: RING_BUFFER
}

data_sources: {
  config {
    name: "linux.ftrace"
    ftrace_config {
        # Use syscall names; Perfetto handles the ID mapping.
        # Requires Android 14+
        syscall_events: "sys_mmap"
        syscall_events: "sys_munmap"
        syscall_events: "sys_madvise"

        # Optional: Capture scheduling to see which thread is calling mmap
        ftrace_events: "sched/sched_switch"
    }
  }
}

data_sources {
  config {
    name: "linux.perf"
    perf_event_config {
      timebase {
        period: 1 # Capture every occurrence, no sampling!
        tracepoint {
          name: "raw_syscalls:sys_enter"
          # FILTER: 222 is mmap on arm64. Use 9 on x86_64.
          filter: "id == 222"
        }
      }
      callstack_sampling {
        # Optional: scope to specific target
        # scope { target_cmdline: "your.app.package" }
        kernel_frames: true
      }
    }
  }
}
duration_ms: 10000
Using Simpleperf
You can also use simpleperf with the --tp-filter flag to achieve the same result
if you only need callstacks (and not the ftrace arguments timeline).
# Record callstacks for every mmap (id == 222 on arm64)
adb shell 'simpleperf record -e raw_syscalls:sys_enter --tp-filter "id == 222" -a --duration 10 -g'
Analyzing the Java Heap
ART Heap Dumps require Android 11.
NOTE: For detailed instructions about capturing ART heap dumps and troubleshooting see the Data sources > ART heap dumps page.
Dumping the java heap
We can get a snapshot of the graph of all the Java objects that constitute the
Java heap. We use the tools/java_heap_dump script. If you are having trouble
make sure you are using the
latest version.
$ tools/java_heap_dump -n com.android.systemui

Dumping Java Heap.
Wrote profile to /tmp/tmpup3QrQprofile
This can be viewed using https://ui.perfetto.dev.
We can also collect a snapshot of the object graph when allocations start failing with java.lang.OutOfMemoryError.
Viewing the Data
Upload the trace to the Perfetto UI and click on diamond marker that shows.
This will present a set of flamegraph views as explained below.
"Object Size" and "Object Count" tabs
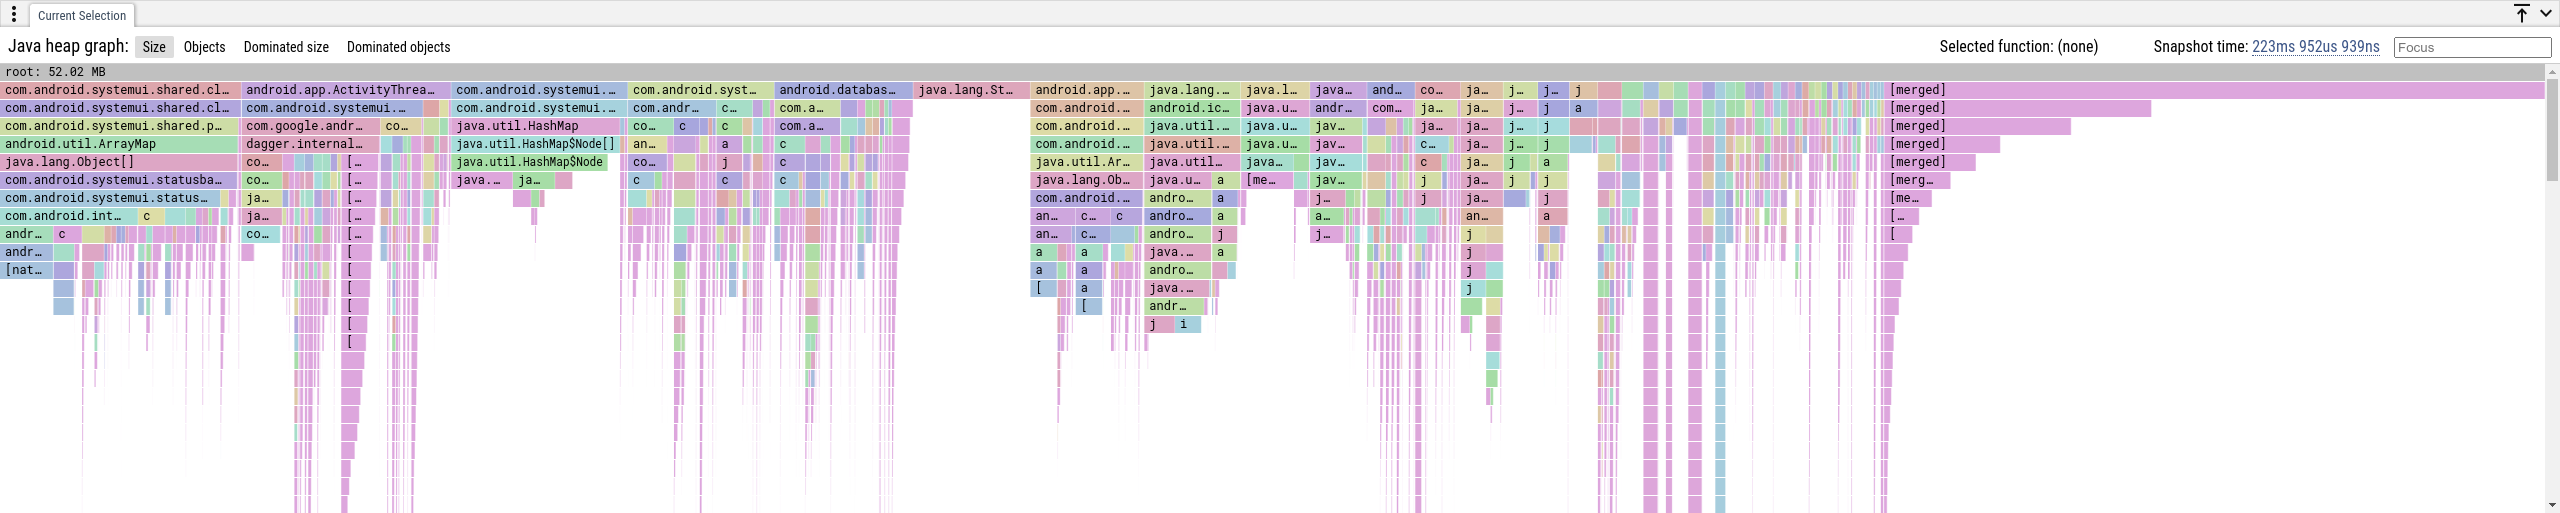
These views show the memory attributed to the shortest path to a
garbage-collection root. In general an object is reachable by many paths, we
only show the shortest as that reduces the complexity of the data displayed and
is generally the highest-signal. The rightmost [merged] stacks is the sum of
all objects that are too small to be displayed.
- Object Size: how many bytes are retained via this path to the GC root.
- Object Count: how many objects are retained via this path to the GC root.
If we want to only see callstacks that have a frame that contains some string, we can use the Focus feature. If we want to know all allocations that have to do with notifications, we can put "notification" in the Focus box.
As with native heap profiles, if we want to focus on some specific aspect of the graph, we can filter by the names of the classes. If we wanted to see everything that could be caused by notifications, we can put "notification" in the Focus box.
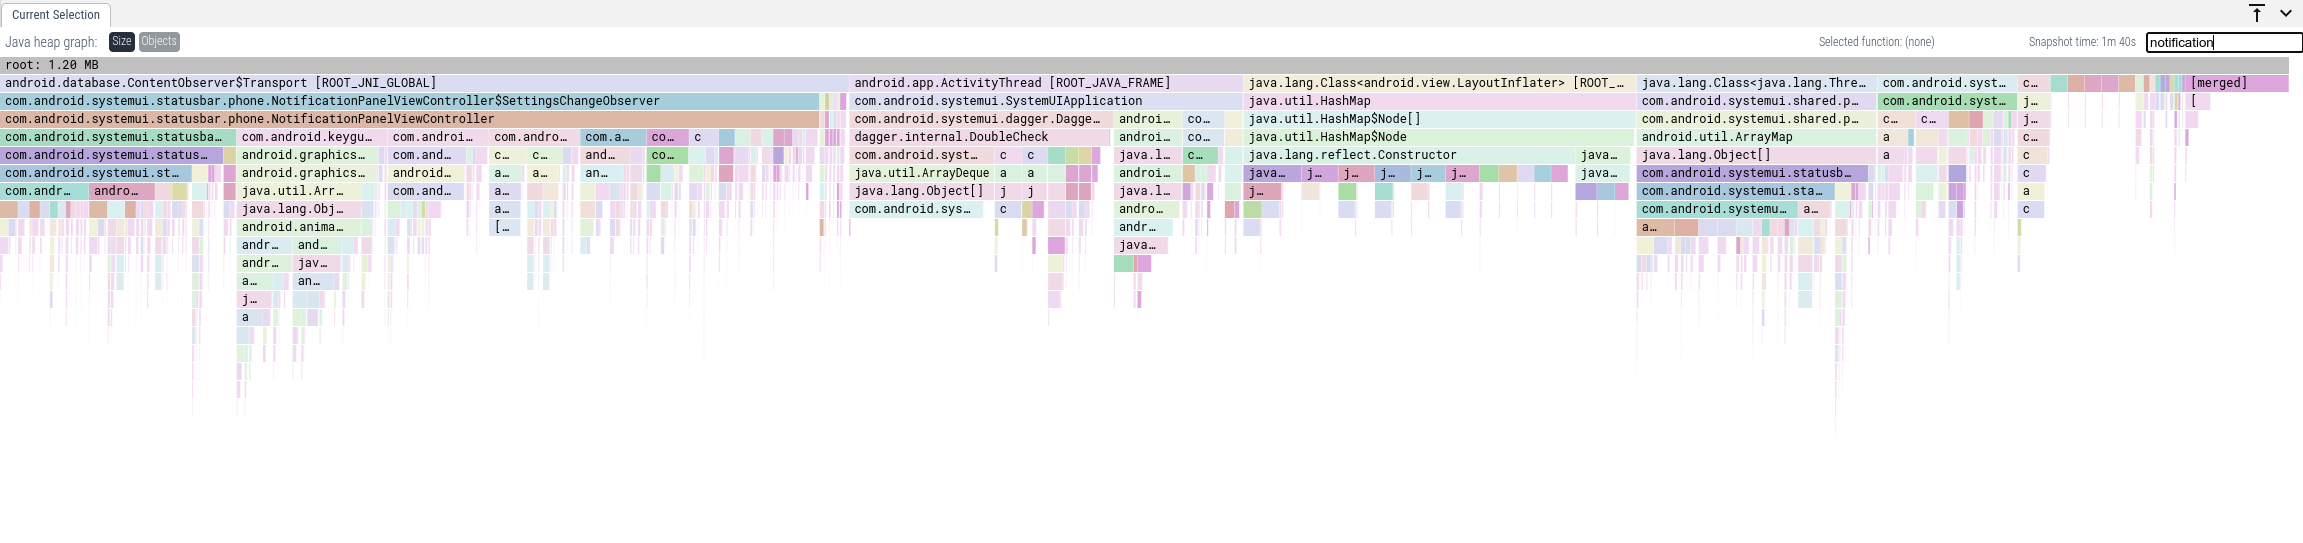
We aggregate the paths per class name, so if there are multiple objects of the
same type retained by a java.lang.Object[], we will show one element as its
child, as you can see in the leftmost stack above. This also applies to the
dominator tree paths as described below.
"Dominated Object Size" and "Dominated Object Count" tabs
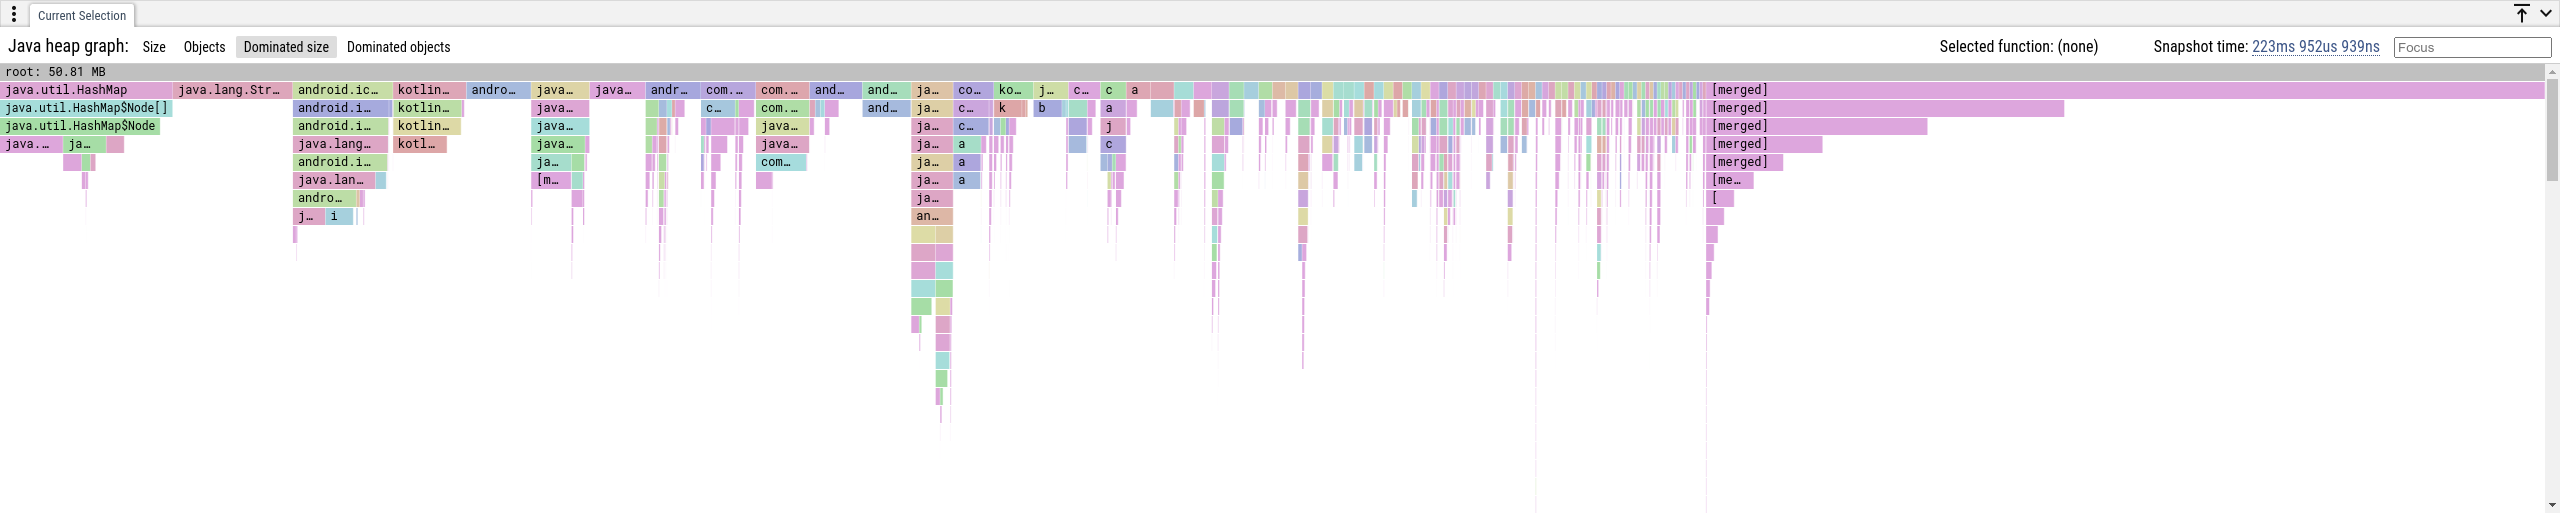
Another way to present the heap graph as a flamegraph (a tree) is to show its
dominator tree.
In a heap graph, an object a dominates an object b if b is reachable from
the root only via paths that go through a. The dominators of an object form a
chain from the root and the object is exclusvely retained by all objects on this
chain. For all reachable objects in the graph those chains form a tree, i.e. the
dominator tree.
We aggregate the tree paths per class name, and each element (tree node) represents a set of objects that have the same class name and position in the dominator tree.
- Dominated Object Size: how many bytes are exclusively retained by the objects in a node.
- Dominated Object Count: how many objects are exclusively retained by the objects in a node.