
Perfetto v55

We're excited to share Perfetto v55.1! Highlights include GPU-accelerated trace rendering, a new Heap Dump Explorer, native Linux heap profiling, a redesigned trace_processor shell, multi-GPU analysis, and a major docs refresh.
Note: v55.0 was never released due to a build failure on Windows and an issue with parsing of some important ftrace events. v55.1 includes fixes to these issues.
⚡ WebGL rendering & virtual track scrolling
Opening big traces (hundreds of processes, thousands of tracks, millions of slices) should be significantly smoother in v55. Two changes drive this:
- WebGL rendering for slice and counter tracks moves the per-frame drawing work onto the GPU, lifting the budget for dense tracks by a wide margin.
- Partial virtual track scrolling means that tracks off screen only render a "skeleton" of their layout to allow for browser Ctrl-F while not doing unnecessary work.
Note: for the largest traces, there's more coming with full virtual track scrolling in the works!
🧠 Heap Dump Explorer
Investigating Android and Java memory issues gets a significant improvement in Perfetto UI through the new Heap Dump Explorer page. Instead of just showing the flamegraph for the heap dump, this is an interactive exploration tool on the classes, objects and references in the dump. Specifically:
- A high-level Overview with retained bytes per heap.
- Classes ranked by retained / shallow size to help you find which type is hogging memory.
- An Objects browser for navigating individual instances and following references.
- Dominators view to find which objects "retain" the largest memory chunks.
- Bitmap gallery, Strings, and Arrays views (require an Java/ART
.hprofheap dump).
The Java HPROF importer also got a major upgrade: primitive fields, array contents, and Bitmap-specific metadata are now preserved when parsing the traces to power this functionality.
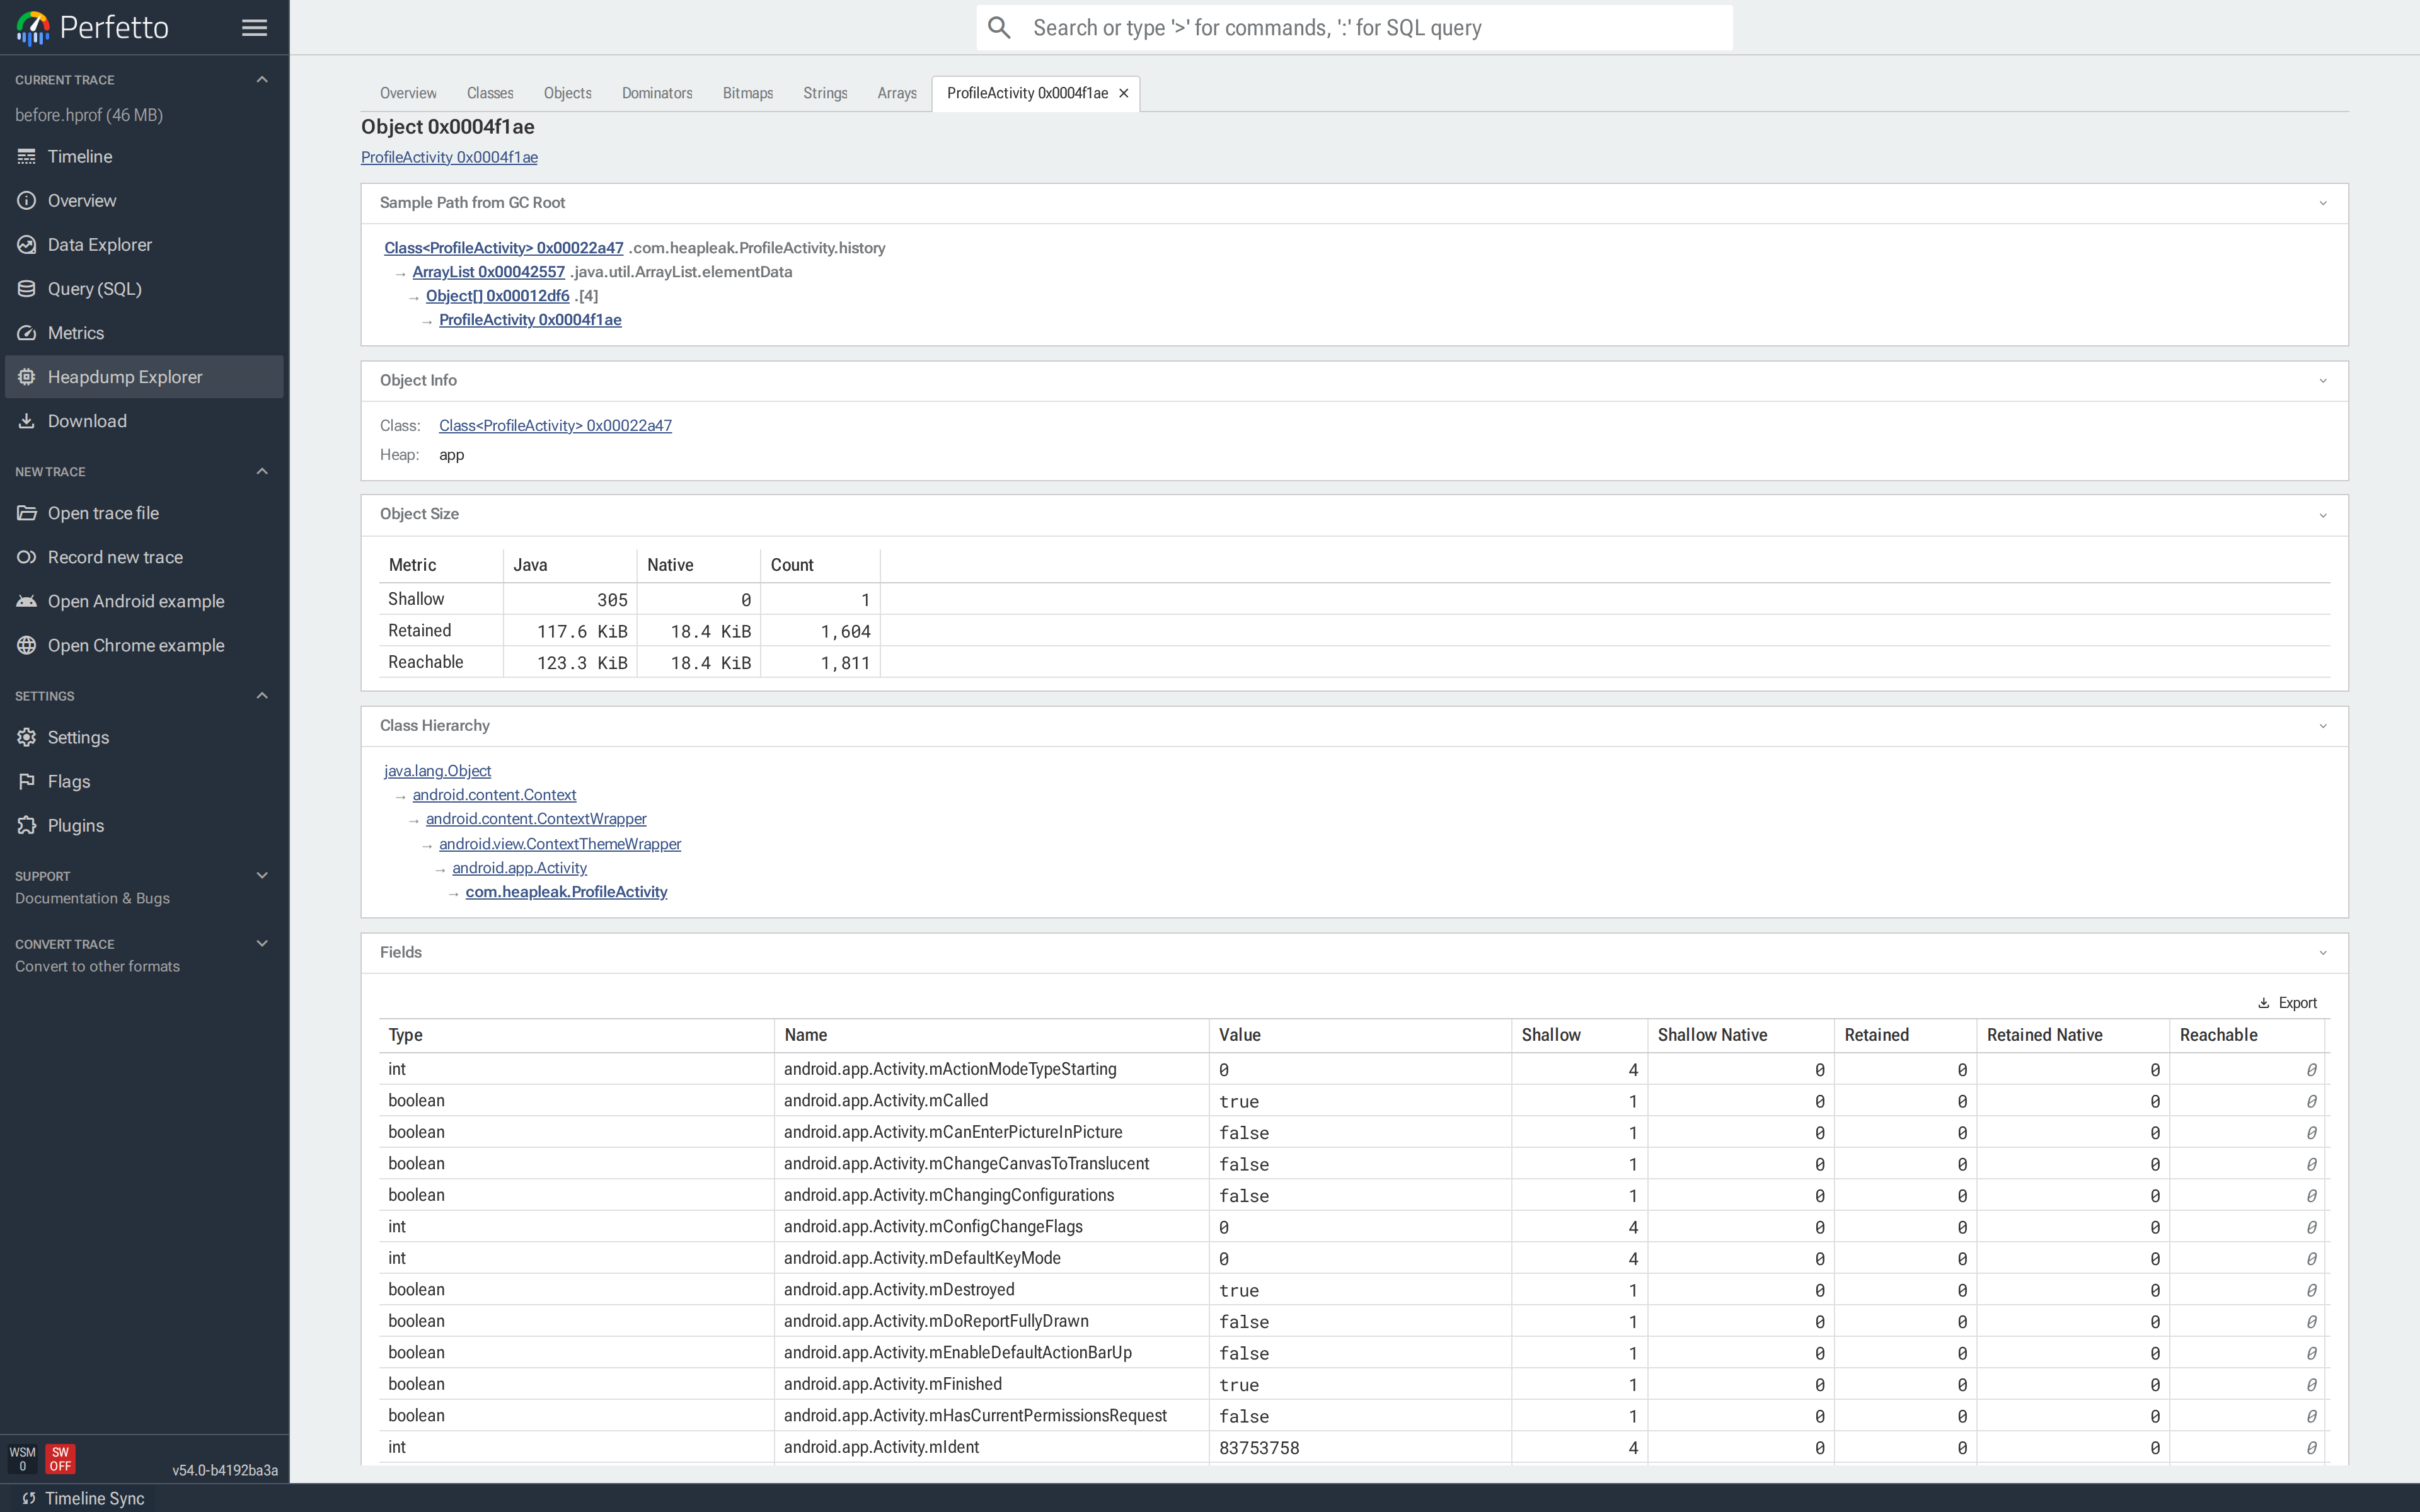
Learn more in the Heap Dump Explorer guide
🐧 heap_profile host: native Linux heap profiling
heap_profile is no longer Android-only. The new host subcommand lets you capture an allocation-attributed memory profile of a local Linux process and open the result in the same UI:
tools/heap_profile host -- ./my_binary --some-flagIt auto-downloads the bits it needs, launches a bundled daemon, and produces a flamegraph that behaves exactly like the Android equivalent (drill in by stack frame, deobfuscate symbols, etc.). The existing Android workflow lives under heap_profile android and is unchanged.
Get started with native heap profiling On Linux
🐚 Subcommand-based trace_processor_shell
trace_processor_shell has been rebuilt around purpose-built subcommands that read more like git, replacing the flat-CLI-with-flags model:
trace_processor query        # one-shot SQL
trace_processor interactive  # REPL
trace_processor server       # serve the UI over RPC
trace_processor metrics      # run metrics
trace_processor summarize    # high-level summaries
trace_processor export       # write to other formats
trace_processor convert      # legacy conversions
The query subcommand also gained a structured query mode for programmatic callers. Existing scripts that use the classic flat CLI keep working just as it is today but all new functionality will be exposed through subcommands only.
New trace_processor subcommand docs
🎮 Multi-GPU support
Trace Processor now models multiple GPUs as first-class citizens. The new gpu and gpu_context tables let you slice slice and memory tracks per-GPU and per-machine, so workloads spanning a discrete + integrated pair, a multi-GPU host, or a multi-machine setup attribute correctly all the way through analysis.
On the recording side, the GPU data source gained InstrumentedSamplingConfig for fine-grained sampling control, custom counter groups in GpuCounterConfig, and CUDA / HIP added to the graphics-context APIs; useful for compute workloads beyond traditional rendering.
🐍 Python: polars DataFrame support
The Python TraceProcessor API can now return query results as polars DataFrames as well as pandas.
df = tp.query("SELECT * FROM slice").as_polars_dataframe()📈 Data Explorer dashboards
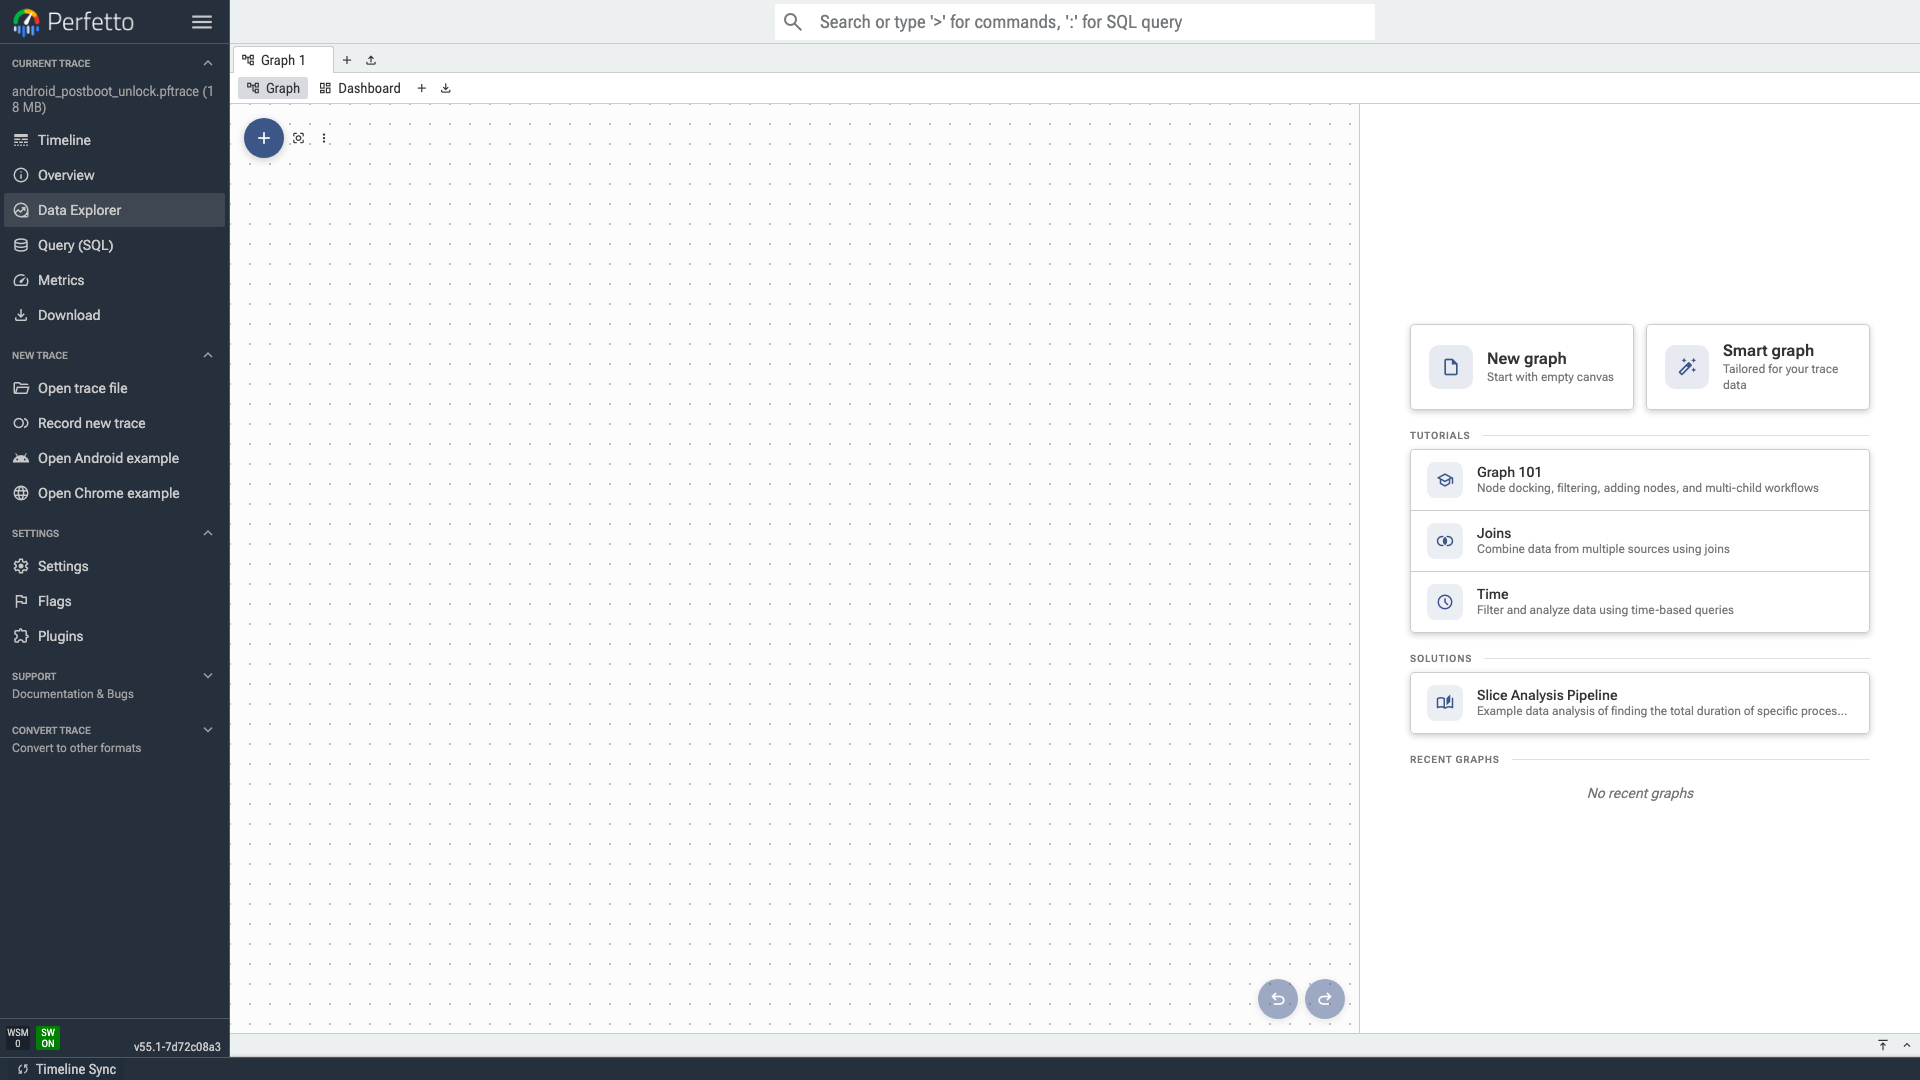
The Data Explorer (formerly "Explore") now has a full dashboard environment with side-by-side Graph and Dashboard views, an in-sidebar chart editor, smarter graph with cycle detection, import/export of dashboards between sessions, and built-in tutorials & solution recipes.
📊 New chart types and UI polish
A handful of new chart and aggregation types ship across the UI:
- Sankey chart for flow visualisations (scheduling transitions, call relationships, anything with sources and destinations).
- Stats widget for one-glance summaries (count, mean, min, max).
- New percentile and count-distinct aggregations in the SQL table viewer.
- Line charts now support stacking, series hovering, and selection alongside brushing.
- Counter detail panels now reflect counter mode and handle rate-delta counters correctly — particularly noticeable on Android GPU events.
🚀 Tracing service and probes
android.aflagsdata source captures Android aconfig flags in effect during the trace, surfaced through Trace Processor and the UI./proc/slabinfopolling added tosys_statsfor tracking kernel slab allocations.traced_perfgained a CPU filter for per-CPU sampling, and raw perf events can specify a dynamic PMU by name.- Any trace can now carry generic trace-level metadata for your own annotations. See
- Multi-machine tracing setups can restrict data sources to specific remote producers (
trace_all_machinesinTraceConfig). - Stack sampling can be filtered by source (user-space / kernel / hypervisor).
🌐 More importers
Perfetto can now ingest more formats end-to-end:
- ART Method v2 streaming traces from Android.
- Firefox profiler markers are imported as slices so you can correlate profiling information with high level timeline markers
☕ Java SDK
The Java SDK now understands @CompileTimeConstant annotations and static track names — so instrumentation can be more efficient when the compiler can prove the strings are constant.
📚 Refreshed documentation
The documentation site received a signifcant facelift
- Reorganised top-level table of contents.
- Filter chips for narrowing pages by topic (OS, role, cookbook, etc.).
- Refreshed typography, visuals, and navigation.
- Substantially rewritten or brand-new guides:
- PerfettoSQL getting started (rewritten)
- GPU data source (full rewrite)
- Symbolization & deobfuscation
- Heap Dump Explorer user guide
heap_profilewith bothhostandandroidsubcommandstraceconv(rewritten from scratch)trace_processorshell + C++ embedding- Multi-machine tracing with
traced_relay - Rust SDK getting started
- Periodic trace snapshots cookbook
trace_processorandtraceconvon Windows
- Community-maintained Chinese docs are now linked from the site.
⚠️ Breaking changes from previous releases
- The
TraceMetadataproto was renamed toTraceAttributes. - The
tidfield inthread_descriptor.protois nowint64(matters for Windows, which has large thread IDs). - Legacy trace actions are now disabled by default; they live in the
dev.perfetto.Catapultplugin if you need them. - Trace Processor: an
arg_set_idcolumn was added to thethreadtable — queries joiningthreadwith other tables that havearg_set_id(e.g.slice) may need to qualify the column name to avoid ambiguity.
🛠️ v55.1 patch fixes
- Infra: Fix build of prebuilts on Windows.
- Trace Processor: Fix parsing of timestamps for Adreno ftrace events.
A huge thanks to everyone — inside and outside Google — who contributed to making Perfetto v55 a success. ♥️
For complete details, see the changelog or view all changes on GitHub.
Download Perfetto v55.1 from our releases page, get started at docs.perfetto.dev, or try the UI directly at ui.perfetto.dev.