
Heap Dump Explorer
The Heap Dump Explorer is a page in the Perfetto UI for analyzing Android ART heap dumps. For every reachable object it shows the class, the shallow and retained sizes, and the reference path from a GC root — so you can answer what is in the heap, what is keeping each object alive, and how much memory each one retains.
This guide covers:
- Heap dumps vs. heap profiles and when to use which.
- Capturing a heap dump, both the lightweight Perfetto heap graph and the fuller ART HPROF formats.
- How to use each tab of the explorer, starting with inspecting a single object — the view most investigations end up at.
- A full reference for the flamegraph: what each node and number means (cumulative, self, self count), the four metrics, top-down vs. bottom-up, zooming, filters and pivoting.
- Worked case studies: a leaked
Activityand duplicate bitmaps.
Heap dumps vs. heap profiles
An ART allocation profile samples allocations over time as a flamegraph of call stacks. It answers which code paths are allocating memory while the trace is recorded. See the ART allocation sampler.
An ART heap dump is a snapshot of the heap at one point in time. It captures every reachable object, the references between them, GC roots and — depending on the format — field values, strings, primitive array bytes and bitmap pixel buffers.
The Heap Dump Explorer is for dumps. Use an ART allocation profile instead for allocation call-path analysis.
What heap dumps are good for
- Memory leaks. An object is reachable that shouldn't be. The
reference path from a GC root points at the holder — typically a
static field, a cached listener, or a
Handlerposting to a destroyed context. - Retention surprises. An object is small itself but retains many megabytes through its references. The dominator tree and the Immediately dominated objects section show exactly what it is holding on to.
- Duplicate content. Multiple copies of the same bitmap, string or primitive array. The Overview groups them by content hash and shows the wasted bytes.
- Bitmap accounting. Which bitmaps are alive, how large they are and what is holding them.
- Class breakdowns. Which classes own the largest share of retained memory.
What heap dumps are not good for
- Allocation call paths. A heap dump is a snapshot, not a recording — it doesn't tell you which code allocated an object. Use an ART allocation profile for that.
- Native-only memory. The dump covers the Java heap. For native allocations use the native heap profiler.
- Timing and performance. Heap dumps say nothing about when objects were created or how long operations took.
Capturing a heap dump
Two formats are supported.
Perfetto heap graph (lightweight)
Captures the object graph — classes, references, sizes, GC roots — but not field values, strings, primitive array bytes or bitmap pixels. Enough for retention, dominator and class-breakdown analysis.
Pros:
- Privacy-safe — no string values, pixel buffers or field contents leave the device, so it can be captured from real users in the field without leaking sensitive data.
- Does not require a
debuggableprocess. - Integrates with the rest of the Perfetto tooling: you can capture a heap graph alongside heap profiles, memory counters and other data sources in a single trace.
Cons:
- No content-based analysis — the Strings, Arrays and Bitmaps tabs and the duplicate-content detection on the Overview are unavailable.
Choose this format for leak investigations, dominator analysis and class breakdowns, especially when capturing from non-debuggable production builds.
$ tools/java_heap_dump -n com.example.app -o heap.pftrace

Dumping Java Heap.
Wrote profile to heap.pftrace
Use --wait-for-oom to trigger on OutOfMemoryError, or
-c <interval_ms> for continuous dumps. See
ART heap dumps for the
full config and
OutOfMemoryError heap dumps
for the OOM-triggered variant.
ART HPROF (full detail)
Everything the heap graph has, plus field values, primitive array contents, string values and bitmap pixel buffers. Required for the Strings, Arrays and Bitmaps tabs and for the duplicate-content detection on the Overview tab.
Pros:
- Full visibility — field values, string contents, bitmap pixels and primitive array bytes are all available.
- Enables duplicate-content detection and the Bitmaps gallery.
- The HPROF format is also understood by other tools such as Android Studio.
Cons:
- Much slower to capture and freezes the target process for several seconds (Perfetto works on a forked copy so the main process is unaffected).
- Produces larger files.
- Contains the full contents of the heap, so it is not suitable for capturing from real users — it will contain any sensitive data in memory.
- Requires a
debuggableprocess.
Choose this format when you need content-level detail: hunting duplicate bitmaps, inspecting string values, or exporting to other tools.
$ adb shell am dumpheap -g -b png com.example.app /data/local/tmp/heap.hprof
$ adb pull /data/local/tmp/heap.hprof

File: /data/local/tmp/heap.hprof
-b encodes bitmap pixel buffers as the given format (png, jpg,
or webp) and is required for the Bitmaps gallery to render pixels.
-g forces a GC before the dump, so unreachable instances don't
appear in the result — use it when hunting a suspected leak. The
target process must be debuggable (a userdebug/eng build, or an
APK with android:debuggable="true").
NOTE: Sections marked requires HPROF below are hidden on traces captured with the heap graph format.
Open the resulting trace by dragging it onto ui.perfetto.dev or clicking "Open trace file" in the sidebar.
Opening the explorer
There are two entry points:
Sidebar. Click "Heapdump Explorer" under the current trace. The entry only appears when the trace contains a heap dump.
From a heap graph flamegraph. Click a diamond in a "Heap Profile" track to open the heap graph flamegraph, click a node to select it, then click the menu icon in the node's details popup and pick "Open in Heapdump Explorer". This is covered in detail under Jumping from a flamegraph.
The explorer is organized as tabs across the top. Overview,
Flamegraph, Classes, Objects, Dominators, Bitmaps, Strings,
Arrays and Callstack are fixed (Callstack shows the allocation
stack that triggered the dump, and only has data for dumps captured on
OutOfMemoryError on recent Android versions). Tabs you open by
drilling into a specific object or flamegraph selection are appended on
the right and can be closed.
All tabs share the underlying heap_graph_* tables. Blue links — a
class name, an object id, a Copies count — navigate to the
corresponding tab pre-filtered.
Overview
NOTE: The duplicate sections require HPROF.
The Overview is the default landing page and summarizes the dump:
- General information. Reachable instance count and the list of
heaps in the dump (typically
app,zygote,image). - Bytes retained by heap. Java, native and total sizes per heap, with a total row at the top. Use this to see whether the problem is on the Java heap, in native memory, or both.
- Duplicate bitmaps / strings / primitive arrays. Duplicated content grouped by content hash. Each row shows the copy count and the wasted bytes; clicking Copies opens the relevant tab filtered to that group.

Flamegraph
The Flamegraph tab shows the whole heap at once, aggregated by class. Where Classes and Objects answer "how much memory does class X own", the flamegraph also shows where in the reference graph that memory sits: which chains of references, starting at the GC roots, lead to it. It is usually the fastest way to spot that one subtree of the heap is disproportionately large.
The same flamegraph appears in the timeline when you click a heap dump diamond in a "Heap Profile" track — every feature below works identically there. A few extras that only exist in the timeline variant are covered at the end under the timeline flamegraph.
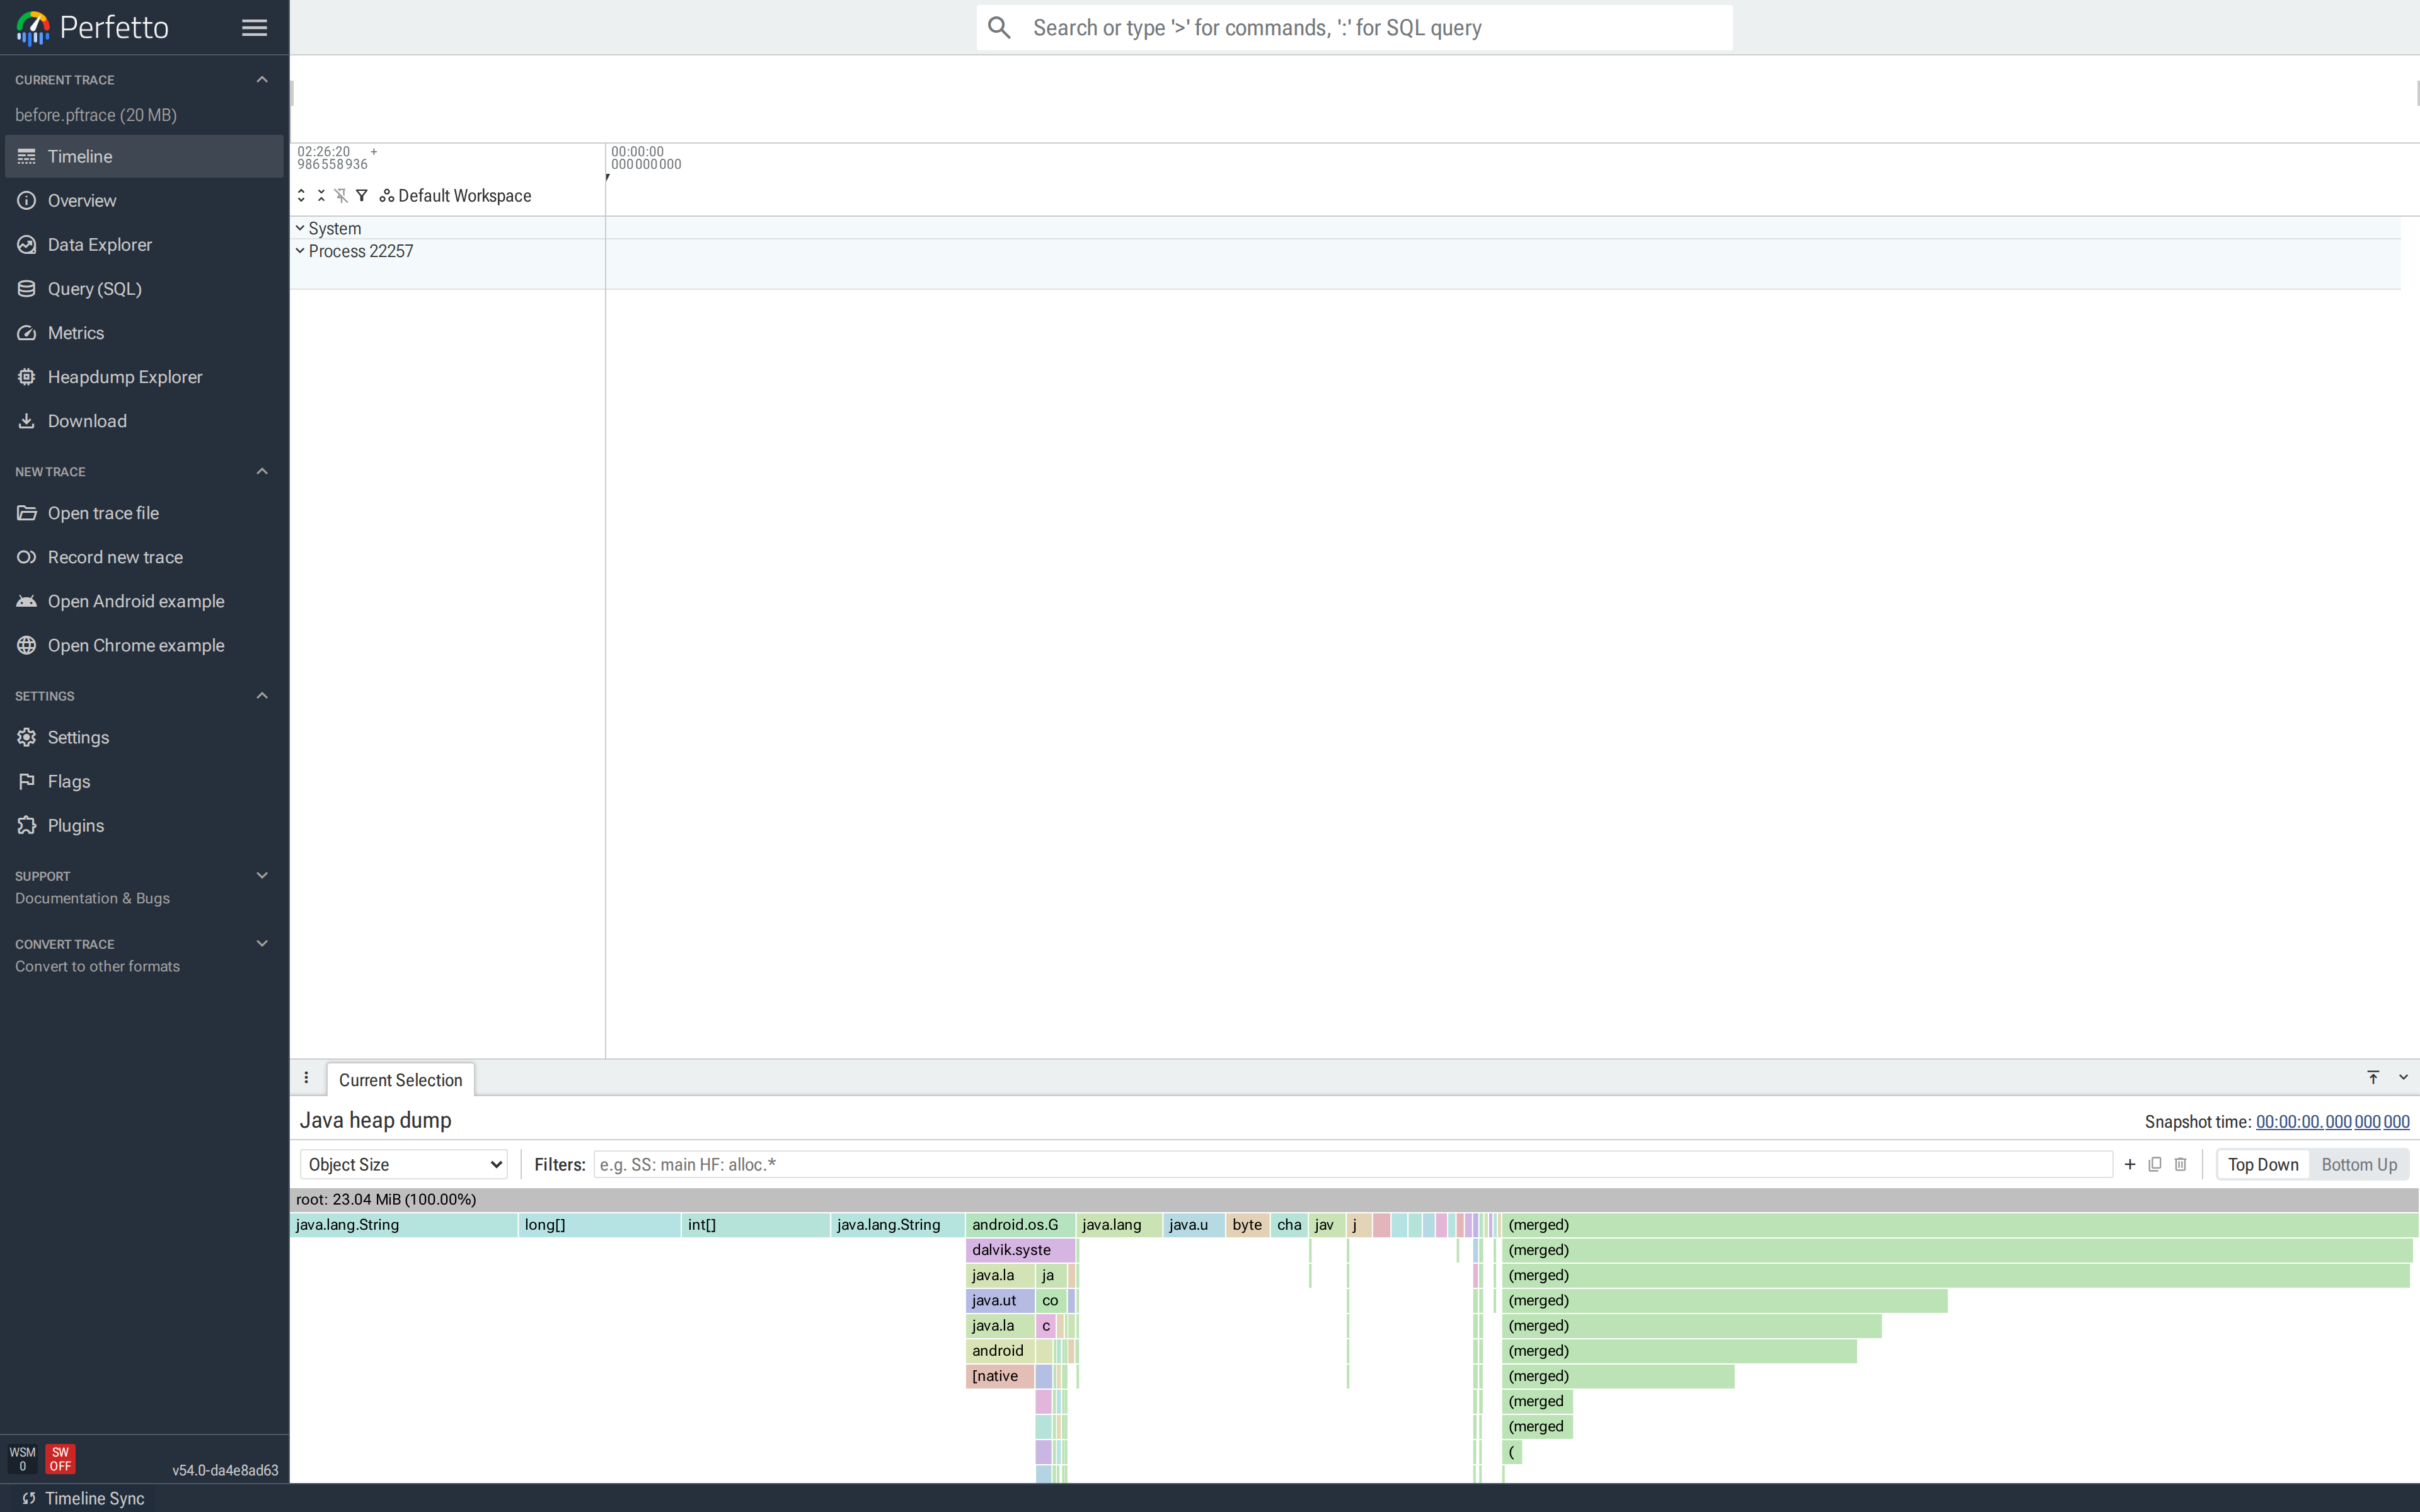
How to read it
A heap is a graph — objects reference each other freely — but a flamegraph draws a tree, so the graph is first converted:
- Starting from the GC roots, every reachable object is placed at its shortest reference path from a root (a breadth-first search; ties are broken deterministically). Each object appears in the tree exactly once.
- Objects at the same path are then merged by class: one node per
class per path. A node labelled
ArrayListsitting underClass<ProfileActivity>means "allArrayListinstances whose shortest path from a root goes through aProfileActivityclass object".
Reading top-down: the synthetic root row at the top spans the whole
dump; each row below it is one more reference hop away from the GC
roots. The width of a node is proportional to the selected metric
(bytes or object count) in that node's entire subtree. Objects with
no known class name show as [Unknown].
One caveat that trips people up: in this shortest-path tree, a node's subtree is not the same as its retained size. An object referenced from two places is drawn only under its shortest path, but it would survive the other reference being dropped. When you need "what would actually be freed", switch to the dominator metrics below.
Nodes too narrow to draw (less than ~3 pixels) are collapsed into a
grey (merged) node. They are still counted in every total; zoom in
or add a filter to see them individually.
Choosing a metric
The dropdown at the top-left switches what the flamegraph measures:
| Metric | Tree | Node width is |
|---|---|---|
| Object Size | Shortest-path | Shallow bytes of all objects in the subtree |
| Object Count | Shortest-path | Number of objects in the subtree |
| Dominated Object Size | Dominator | Bytes freed if the subtree's top object died |
| Dominated Object Count | Dominator | Objects freed if the subtree's top object died |
The two Dominated metrics build the tree from the dominator tree instead of shortest paths: each object hangs under the object that exclusively retains it. A node's cumulative value is therefore its true retained size — exactly what the garbage collector would reclaim if those objects became unreachable. Use Object Size to follow the actual reference structure of the heap, and Dominated Object Size to attribute memory to the objects responsible for keeping it alive.
Sizes count the Java shallow size of each object. Native memory
registered against a Java object (for example bitmap pixel buffers on
modern Android) is shown as a separate child node labelled
[native] <ClassName> and is counted in all cumulative totals.
Native memory that is not registered this way does not appear in the
dump at all; use the
native heap profiler
for that.
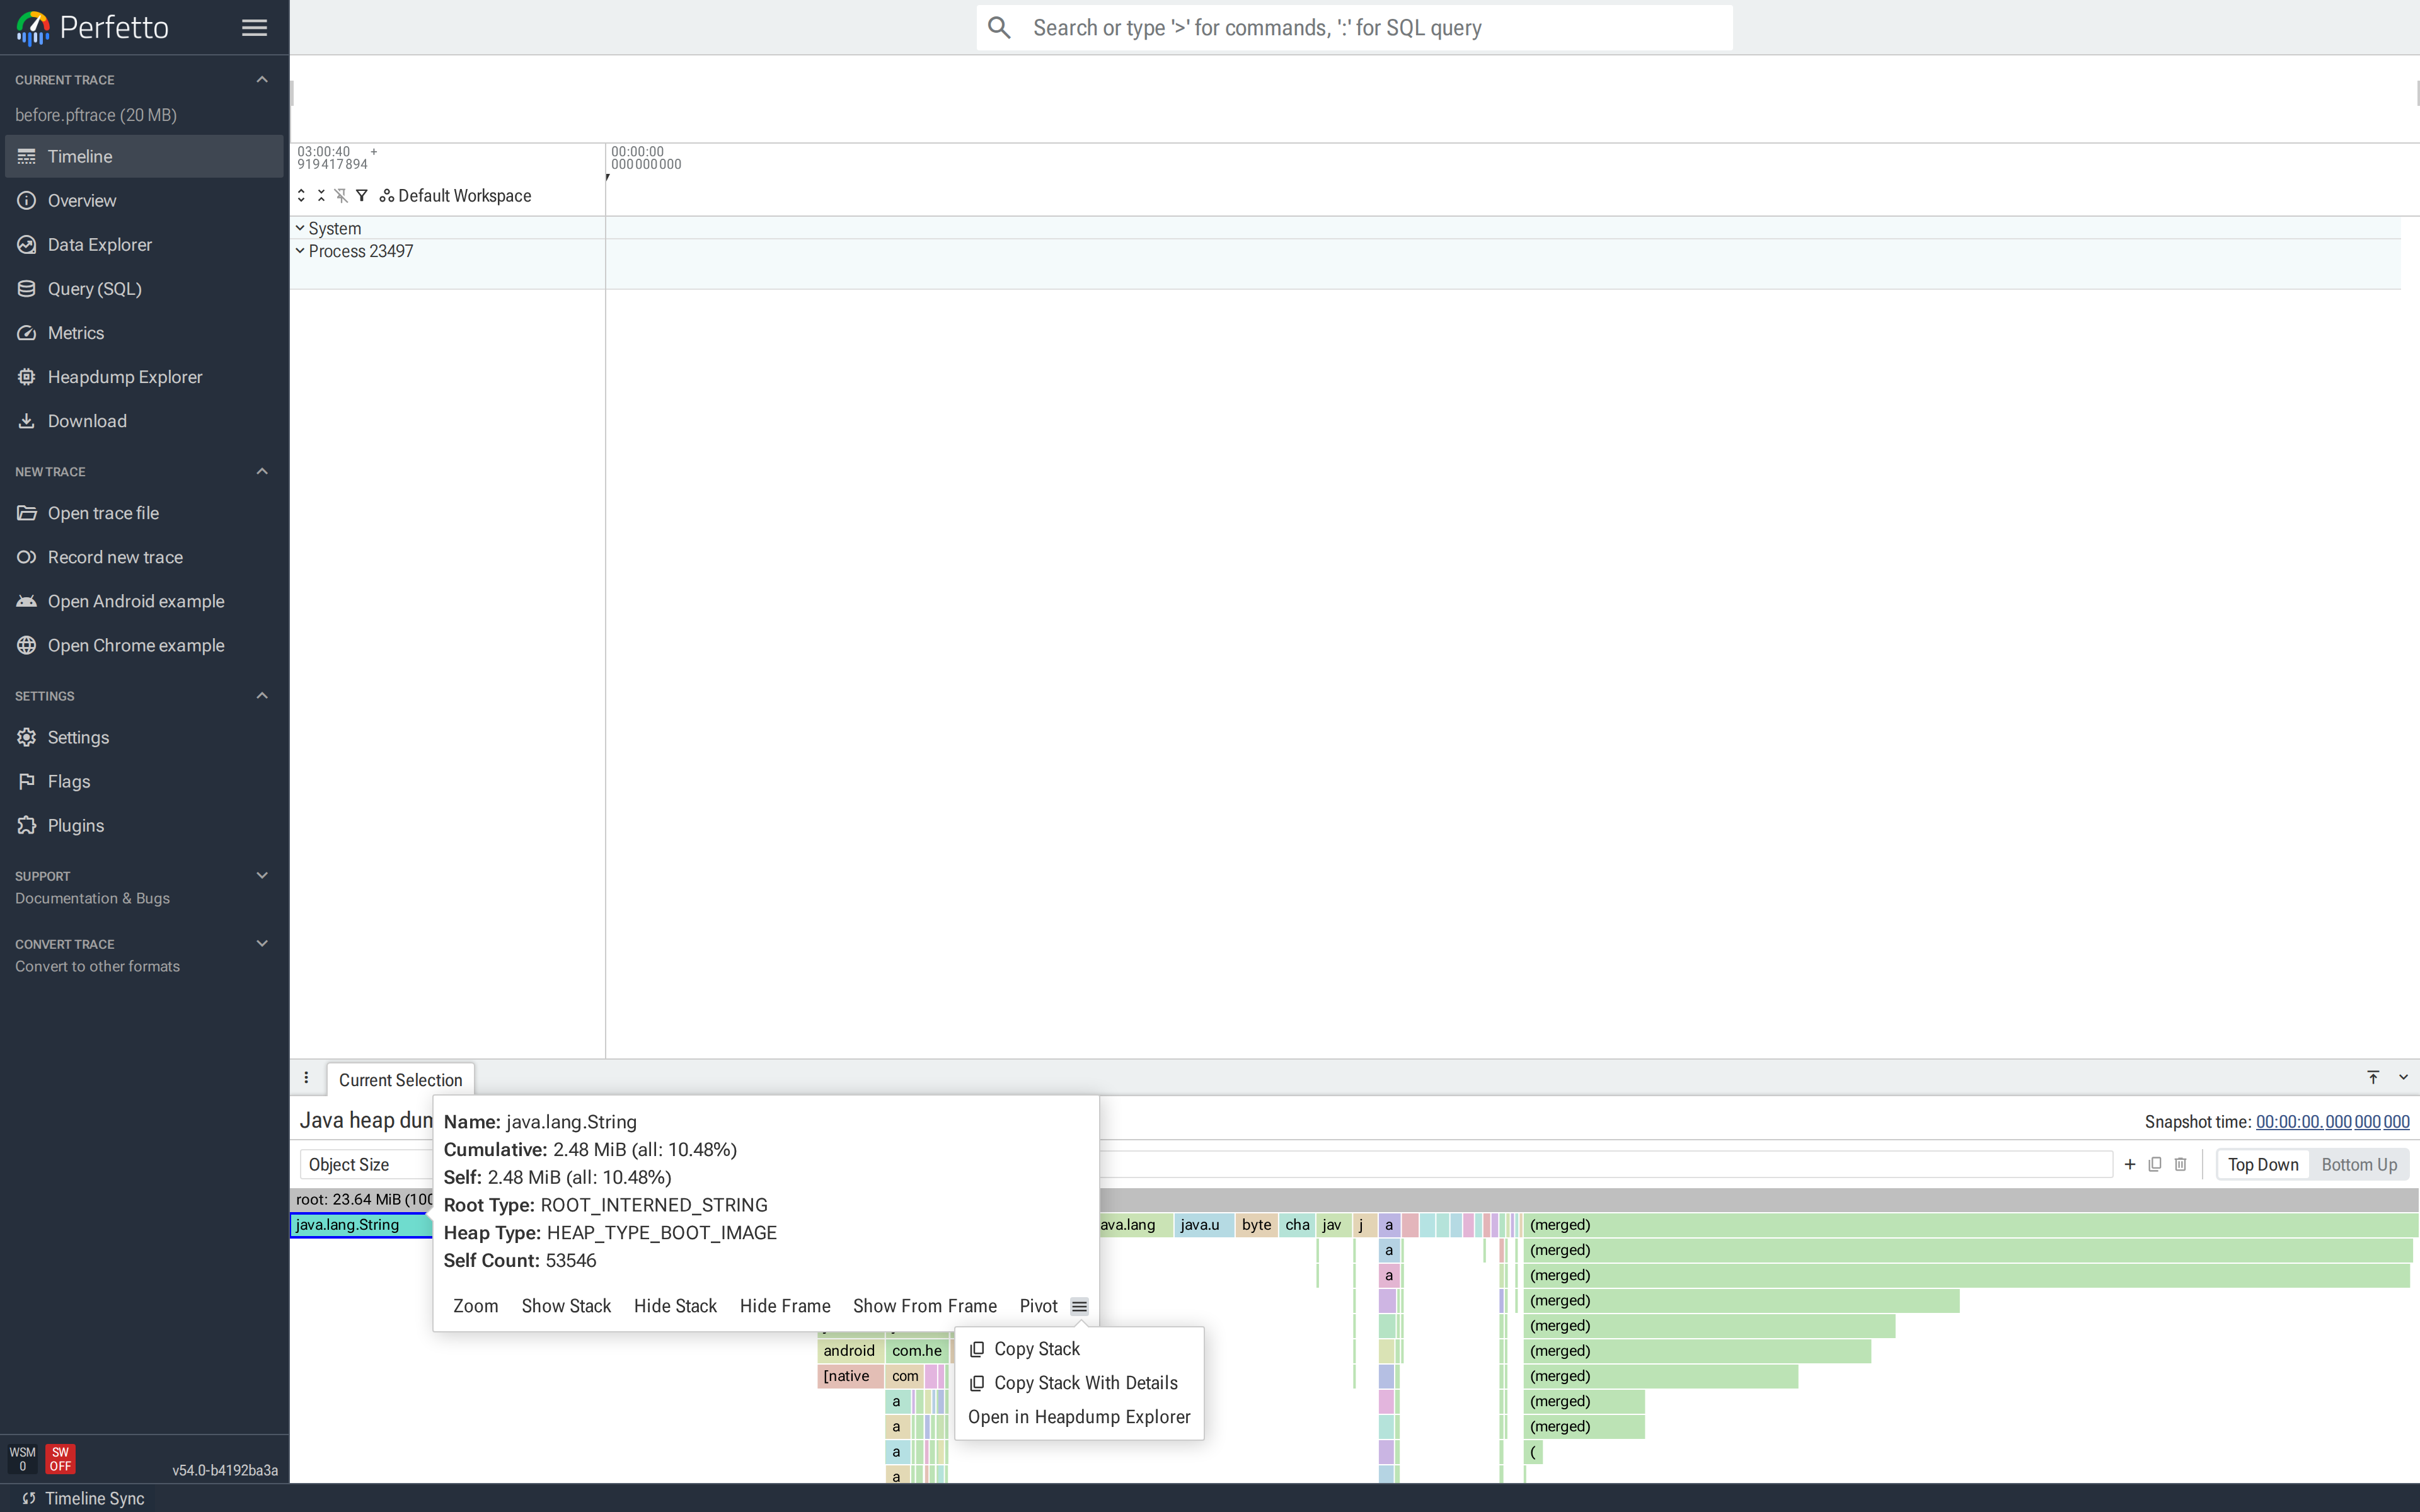
Cumulative, Self and Self Count
Hover or click a node to see its numbers:
- Cumulative — the metric summed over this node and everything
below it. This matches the node's width. Two percentages are
shown:
all(share of the entire unfiltered dump) andparent(share of the parent node's cumulative value). - Self — the metric for the objects merged into this node only, excluding descendants. For Object Size that is the summed shallow size of this node's own instances. A node with a large self value is itself heavy; a node with small self but large cumulative is a cheap container holding an expensive subtree.
- Self Count — the number of object instances merged into this
node. In the screenshot above, the
java.lang.Stringnode represents 53,546 individual strings that all share the same reference path. (Shown with the size metrics; with the count metrics the main value already is the count.) - Root Type — only on nodes that are themselves GC roots: how the
runtime is pinning them, e.g.
ROOT_STATIC(static fields),ROOT_JNI_GLOBAL(JNI global references),ROOT_JAVA_FRAME(a live thread's stack),ROOT_INTERNED_STRING. - Heap Type — which ART heap the objects live in:
app(your process's own allocations),zygote(inherited from the zygote at fork) orimage(the preloaded boot image). Leaks are almost always on theappheap.
Because nodes are only merged when Root Type and Heap Type match, the
same class can legitimately appear as several sibling nodes — e.g.
one java.lang.String node per heap.
Top Down and Bottom Up
The radio buttons at the top-right flip the direction of aggregation:
- Top Down (default) — as described above: roots at the top, each row one reference hop further from a root.
- Bottom Up — every occurrence of a class, wherever it sits in
the tree, is merged into a single row at the bottom; the referrer
chains that lead to it are stacked above, widest referrer first.
Use this to answer "how much do all
Xhold in total, regardless of path?" and "who are the biggest referrers ofX?" — the flamegraph equivalent of a reverse-reference query across the whole heap.
Zooming
Double-click a node (or use Zoom in from its popup) to stretch it
to the full width. Nothing is filtered out — ancestors stay visible,
greyed, and totals don't change. Double-click the root row to zoom
back out. Zooming is purely visual; to actually cut the data down,
use filters.
Filters
The filter bar reshapes the tree. Type into it directly, or press the
+ button for a guided form. Active filters show as chips;
double-click a chip to edit it, click its x to remove it, or use
the bin button to clear everything.
Patterns are regular expressions matched case-sensitively against
the class name; bare text is a substring match (String matches
java.lang.String), and ^/$ anchor it exactly. Patterns also
match against a node's Root Type and Heap Type values, so
SS: ROOT_JNI_GLOBAL or SS: zygote work too.
There are four filter types plus Pivot. In the filter bar,
prefix the pattern with the short or full name; with no prefix the
text becomes a Show Stack filter. Multiple filters can be typed in
one go, separated by spaces: SS: main HF: alloc.*.
- Show Stack (
SS:) — keep only paths that contain a matching node; everything else is removed. Therootrow shows how much of the dump survived, e.g.root: 1.2 MiB (4.92%). Multiple Show Stack filters AND together: a path must match all of them. - Hide Stack (
HS:) — the inverse: remove every path that contains a matching node. Called "Drop function" in some other profilers. - Show From Frame (
SFF:) — keep only matching nodes and their subtrees, dropping the ancestors above them. Useful to study one class's subtree in isolation without re-rooting the whole graph. Called "Focus on subtree" elsewhere. - Hide Frame (
HF:) — delete matching nodes themselves and splice their children onto their parent. This is the tool for collapsing noise rows:HF: java.lang.Object\[\]merges array containers away so container contents attach directly to whatever owns the container. Called "Merge function" elsewhere.
Filters persist when you switch metrics or between Top Down and Bottom Up, and the copy button next to the bar copies the active filter set as text so it can be shared or pasted back.
Pivot
Pivoting (P: in the filter bar, or Pivot on matching frames from
a node's popup) re-roots the flamegraph at every node matching the
pattern:
- The matched class becomes the central row.
- Everything it references grows downwards, as usual.
- Everything that references it grows upwards, inverted.
This is the "show me everything about this class in one picture"
view: its total footprint, what it is made of, and who is holding it,
without walking objects one at a time. A pivot shows as a
Pivot: ... chip; only one can be active at a time (setting a new
one replaces it), the Top Down / Bottom Up switch is disabled while
pivoted, and removing the chip returns to Top Down.
The object tab integrates with pivot directly: the
Shortest Path from GC Root and Dominator Tree Path sections each
have a View in Flamegraph button that opens this tab pivoted on
that specific instance's path (the chip reads
ClassName (this instance)), using the Object Size or
Dominated Object Size metric respectively.
Node actions
Clicking a node opens its details popup with four menus, grouping everything you can do from a node:
- Focus — reframe without removing data: Zoom in, Focus on matching subtrees (Show From Frame) and Pivot on matching frames.
- Filter — reshape the tree: Keep stacks matching name (Show Stack), Hide stacks matching name (Hide Stack) and Merge matching frames into caller (Hide Frame).
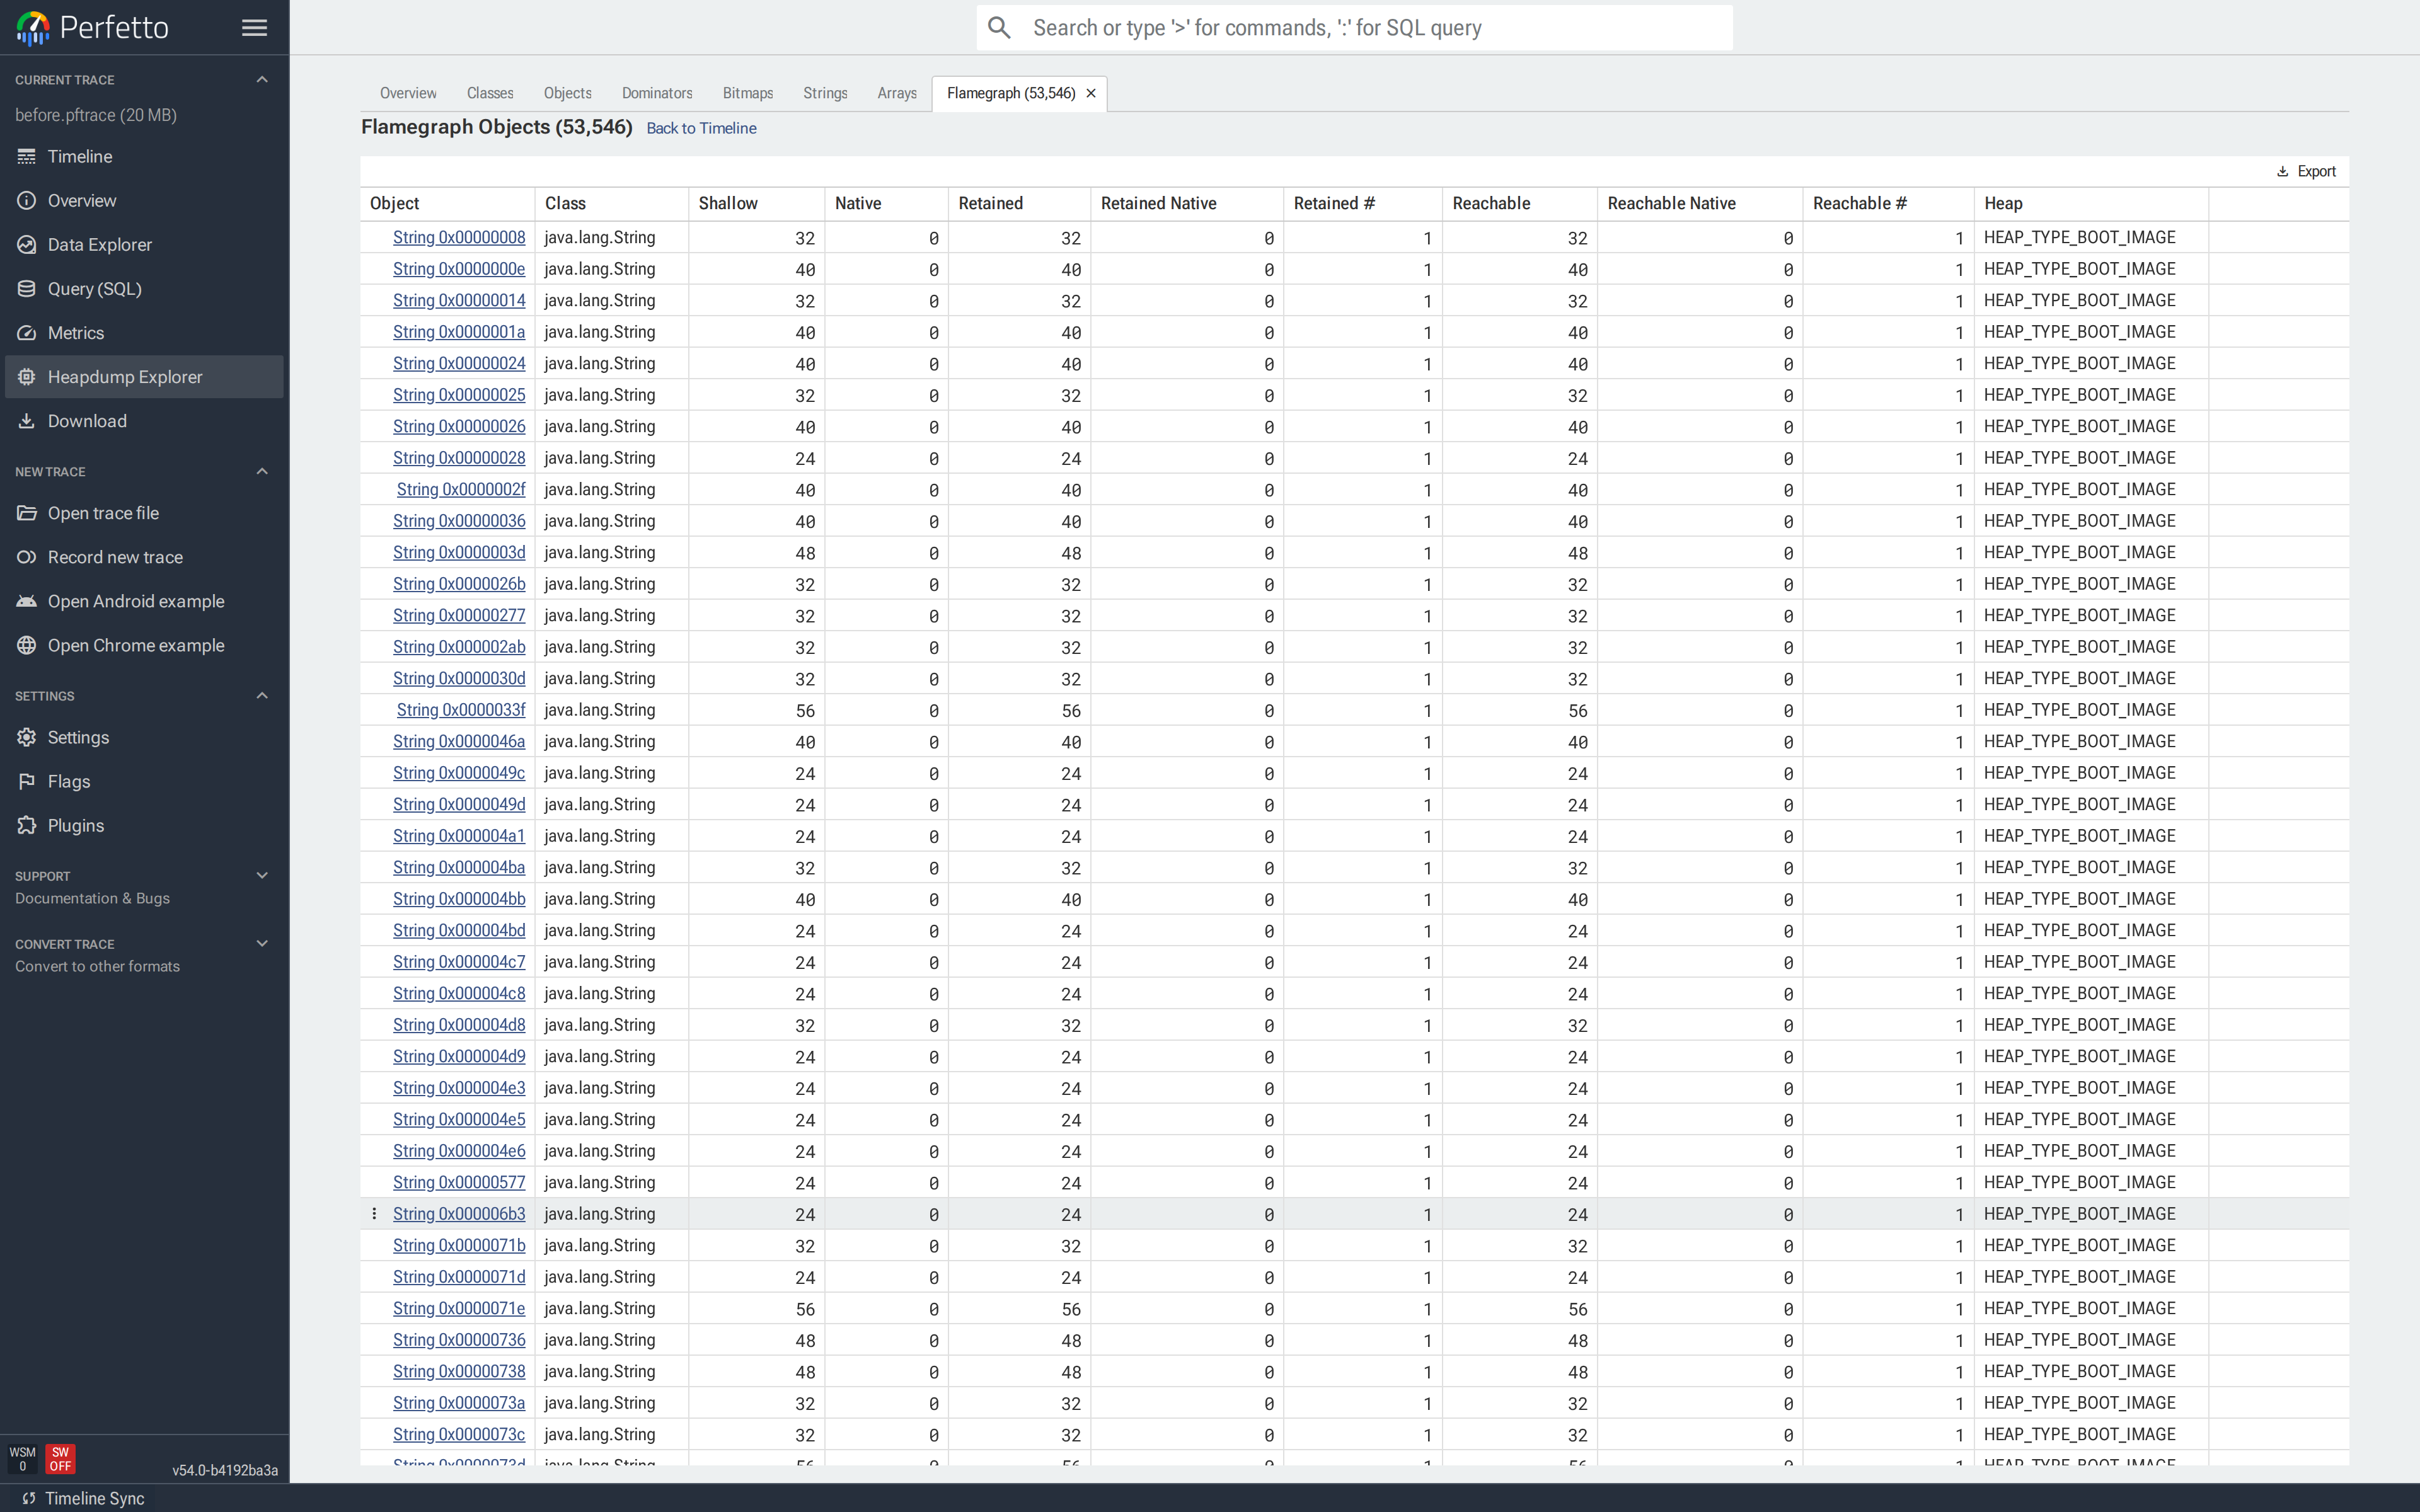
- Drill down — Show objects from this class opens a closable Flamegraph objects tab listing the individual instances behind the node, from which any object's object tab is one click away. (In the timeline flamegraph this action is called Open in Heapdump Explorer.)
- Copy — Copy stack copies the chain of class names from the root to this node as plain text; Copy stack with details copies it as a markdown table with Root Type, Heap Type, Cumulative, Self and Self Count per row — handy for bug reports and code review comments.
Actions launched from a node match that node exactly (the pattern is
anchored as ^name$), so filtering on java.lang.String will not
accidentally match java.lang.StringBuilder.
The timeline flamegraph
The flamegraph in the timeline's "Heap Profile" details panel has three extras:
- Each node's Drill down menu has Open in Heapdump Explorer, which jumps into the explorer with a Flamegraph objects tab open for that node — see Jumping from a flamegraph.
- The
rootnode's menu has Reference paths by class, which opens a table aggregating every distinct reference path: one row per class and path with the number of paths, object count, total size and total native size. It is the tabular twin of the flamegraph — the same data, but sortable and exportable. - If the heap graph in the trace is incomplete (the dump was cut short), a warning modal offers to show the import errors; the flamegraph still renders with whatever data arrived.
Classes
The Classes tab lists every class in the dump, sorted by Retained descending:
- Count — reachable instances.
- Shallow / Shallow Native — combined self-size of all instances.
- Retained / Retained Native — bytes freed if every instance became unreachable.
- Retained # — the number of objects that would go with them.
![Classes tab sorted by Retained; `byte[]` and `java.lang.String` at the top, `com.heapleak.ProfileActivity` further down with Count 1.](../images/heap_docs/05-classes.png)
Use this tab when you have a suspect class, or want a top-down view of which classes own the most memory. Clicking a class name opens Objects filtered to that class.
Objects
The Objects tab lists reachable instances. Opening it from Classes or from a duplicate group applies the filter automatically; opening it directly shows every object.
Each row has the object identifier (short class name + hex id), its
class, shallow and retained size, and its heap. java.lang.String
rows carry a badge with a preview of the value, so strings can be
scanned at a glance.
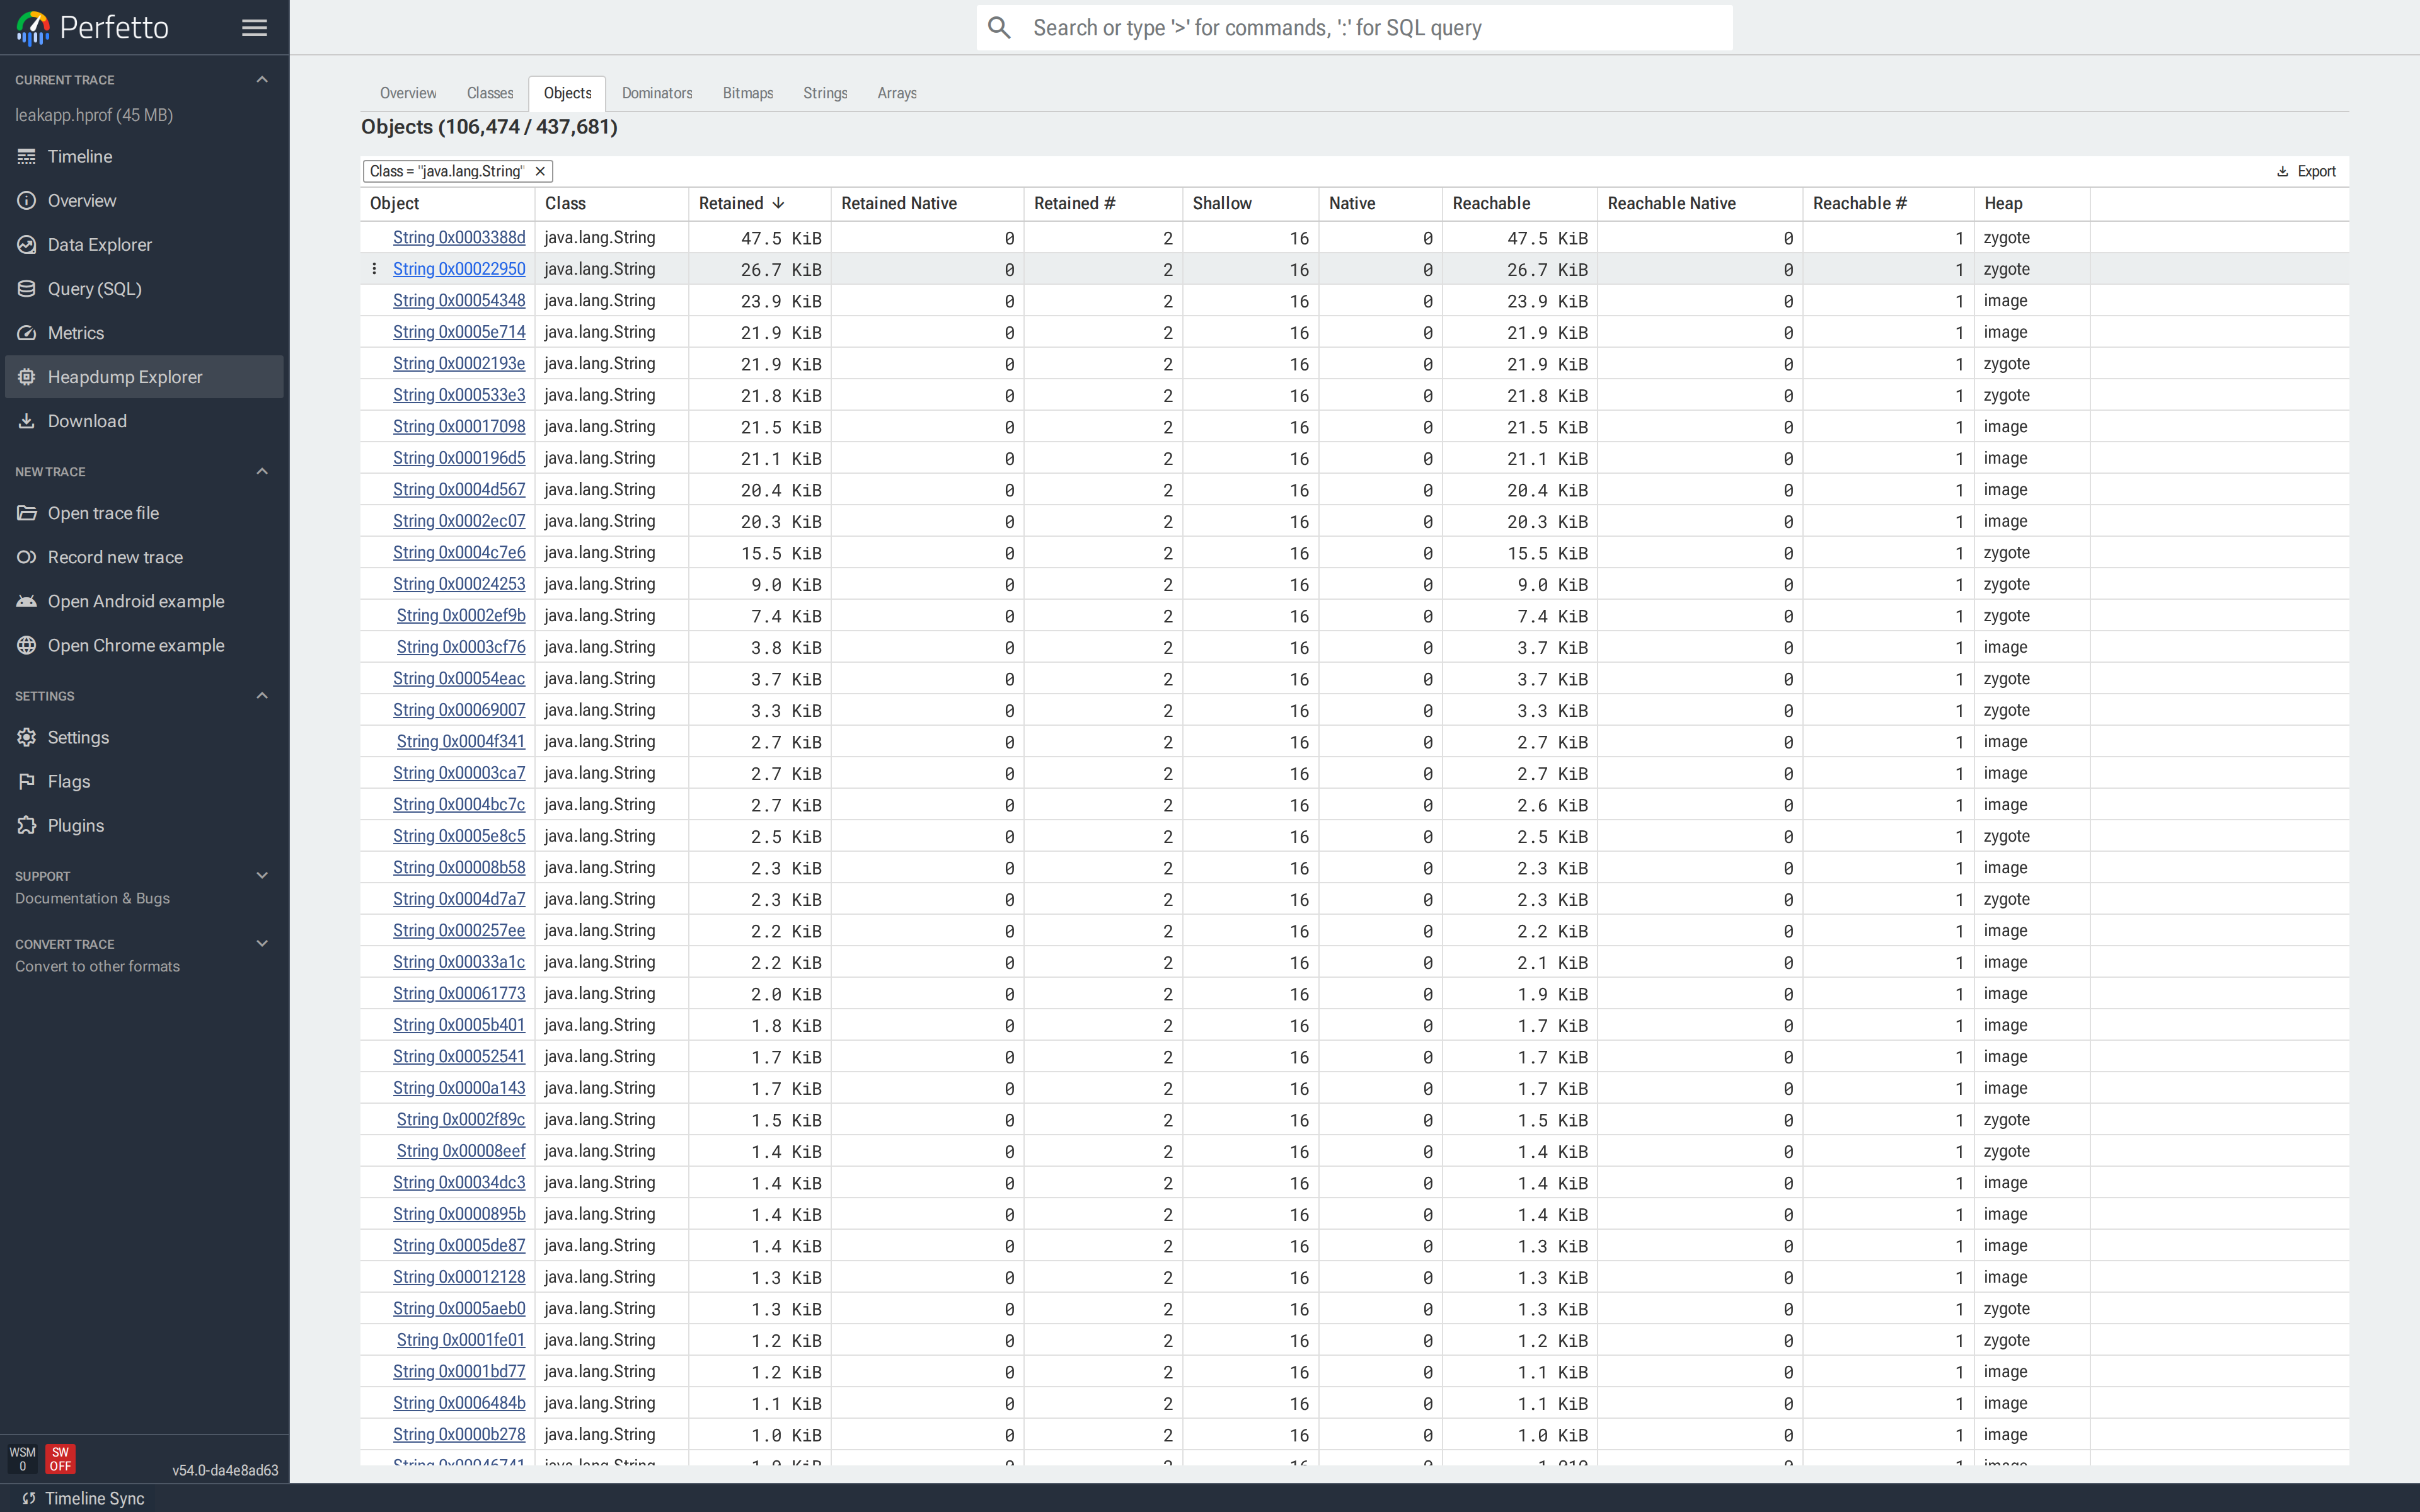
Clicking an object opens its object tab.
Typical uses: identifying a stale Activity after a leak, or the
instance of a data class holding the largest subgraph.
Inspecting a single object
The Shortest Path from GC Root, Dominator Tree Path and Objects with References to this Object are the key sections for most investigations. The shortest path shows the fewest reference hops keeping the object alive; the dominator tree path shows the chain of objects that exclusively retain it; the reverse references list every object holding a field pointer to it.
Clicking any object in any tab opens a closable tab for that instance. Multiple object tabs can be open at once.
The object tab contains everything known about the instance:
- Header with the object id, plus an Open in Classes shortcut
when the object is itself a
Class. - Bitmap preview for bitmap instances, with a download button.
- Shortest Path from GC Root — the shortest chain of references from a GC root to this object.
- Dominator Tree Path — the chain of dominators keeping this object alive, one step per row with the holder and the field name.
- Object info — class, heap, root type.
- Object size — shallow, retained and reachable sizes split by Java / native / count.
- Class hierarchy — the full inheritance chain up to
java.lang.Object, plus the instance size for class objects. Clicking any class opens Classes filtered to that class and its subclasses. - Static fields (for class objects), instance fields (for ordinary objects) or array elements (for arrays). Reference values are clickable and jump to the referenced object. For byte arrays, Download bytes exports the raw data.
- Objects with references to this object — the reverse references. Every instance that has a field pointing at this one.
- Immediately dominated objects — what would be freed if this instance became unreachable.
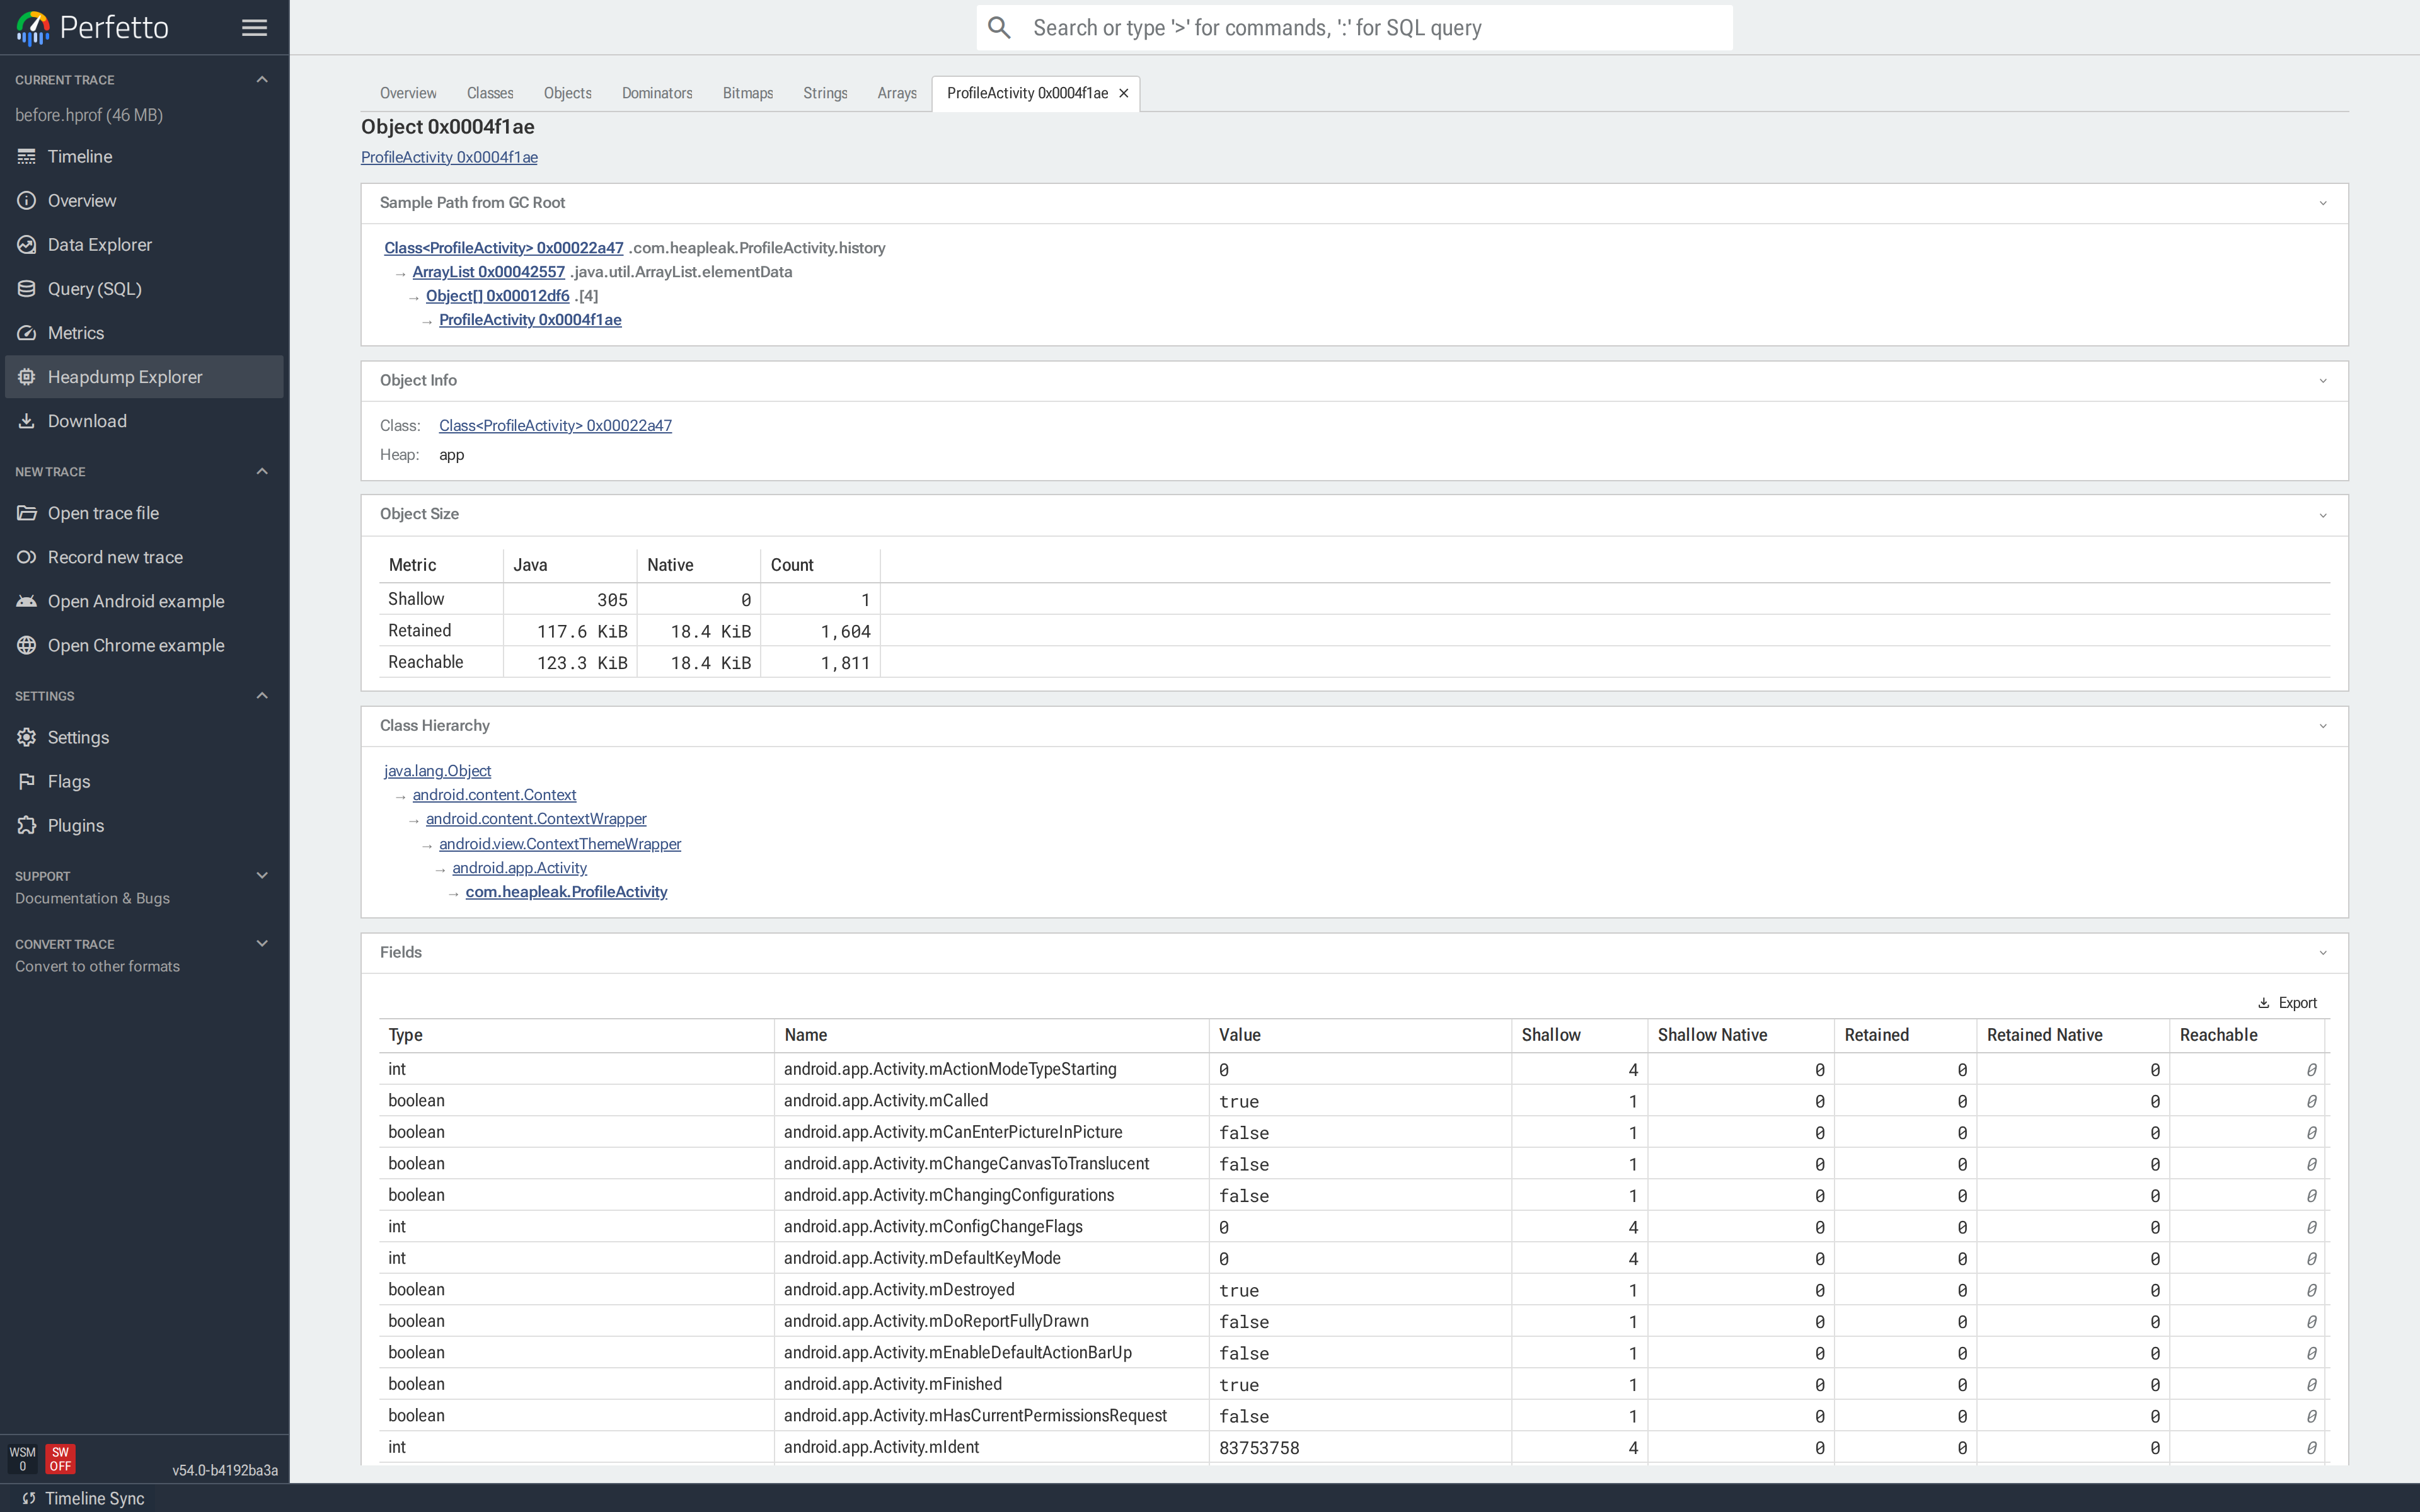
![Object tab (top) for `ProfileActivity 0x0004f1ae`: Sample Path from GC Root goes `Class<ProfileActivity> → com.heapleak.ProfileActivity.history → ArrayList → Object[0] → ProfileActivity`; retained 117.6 KiB across 1,604 objects.](../images/heap_docs/12-object-tab-top.png)
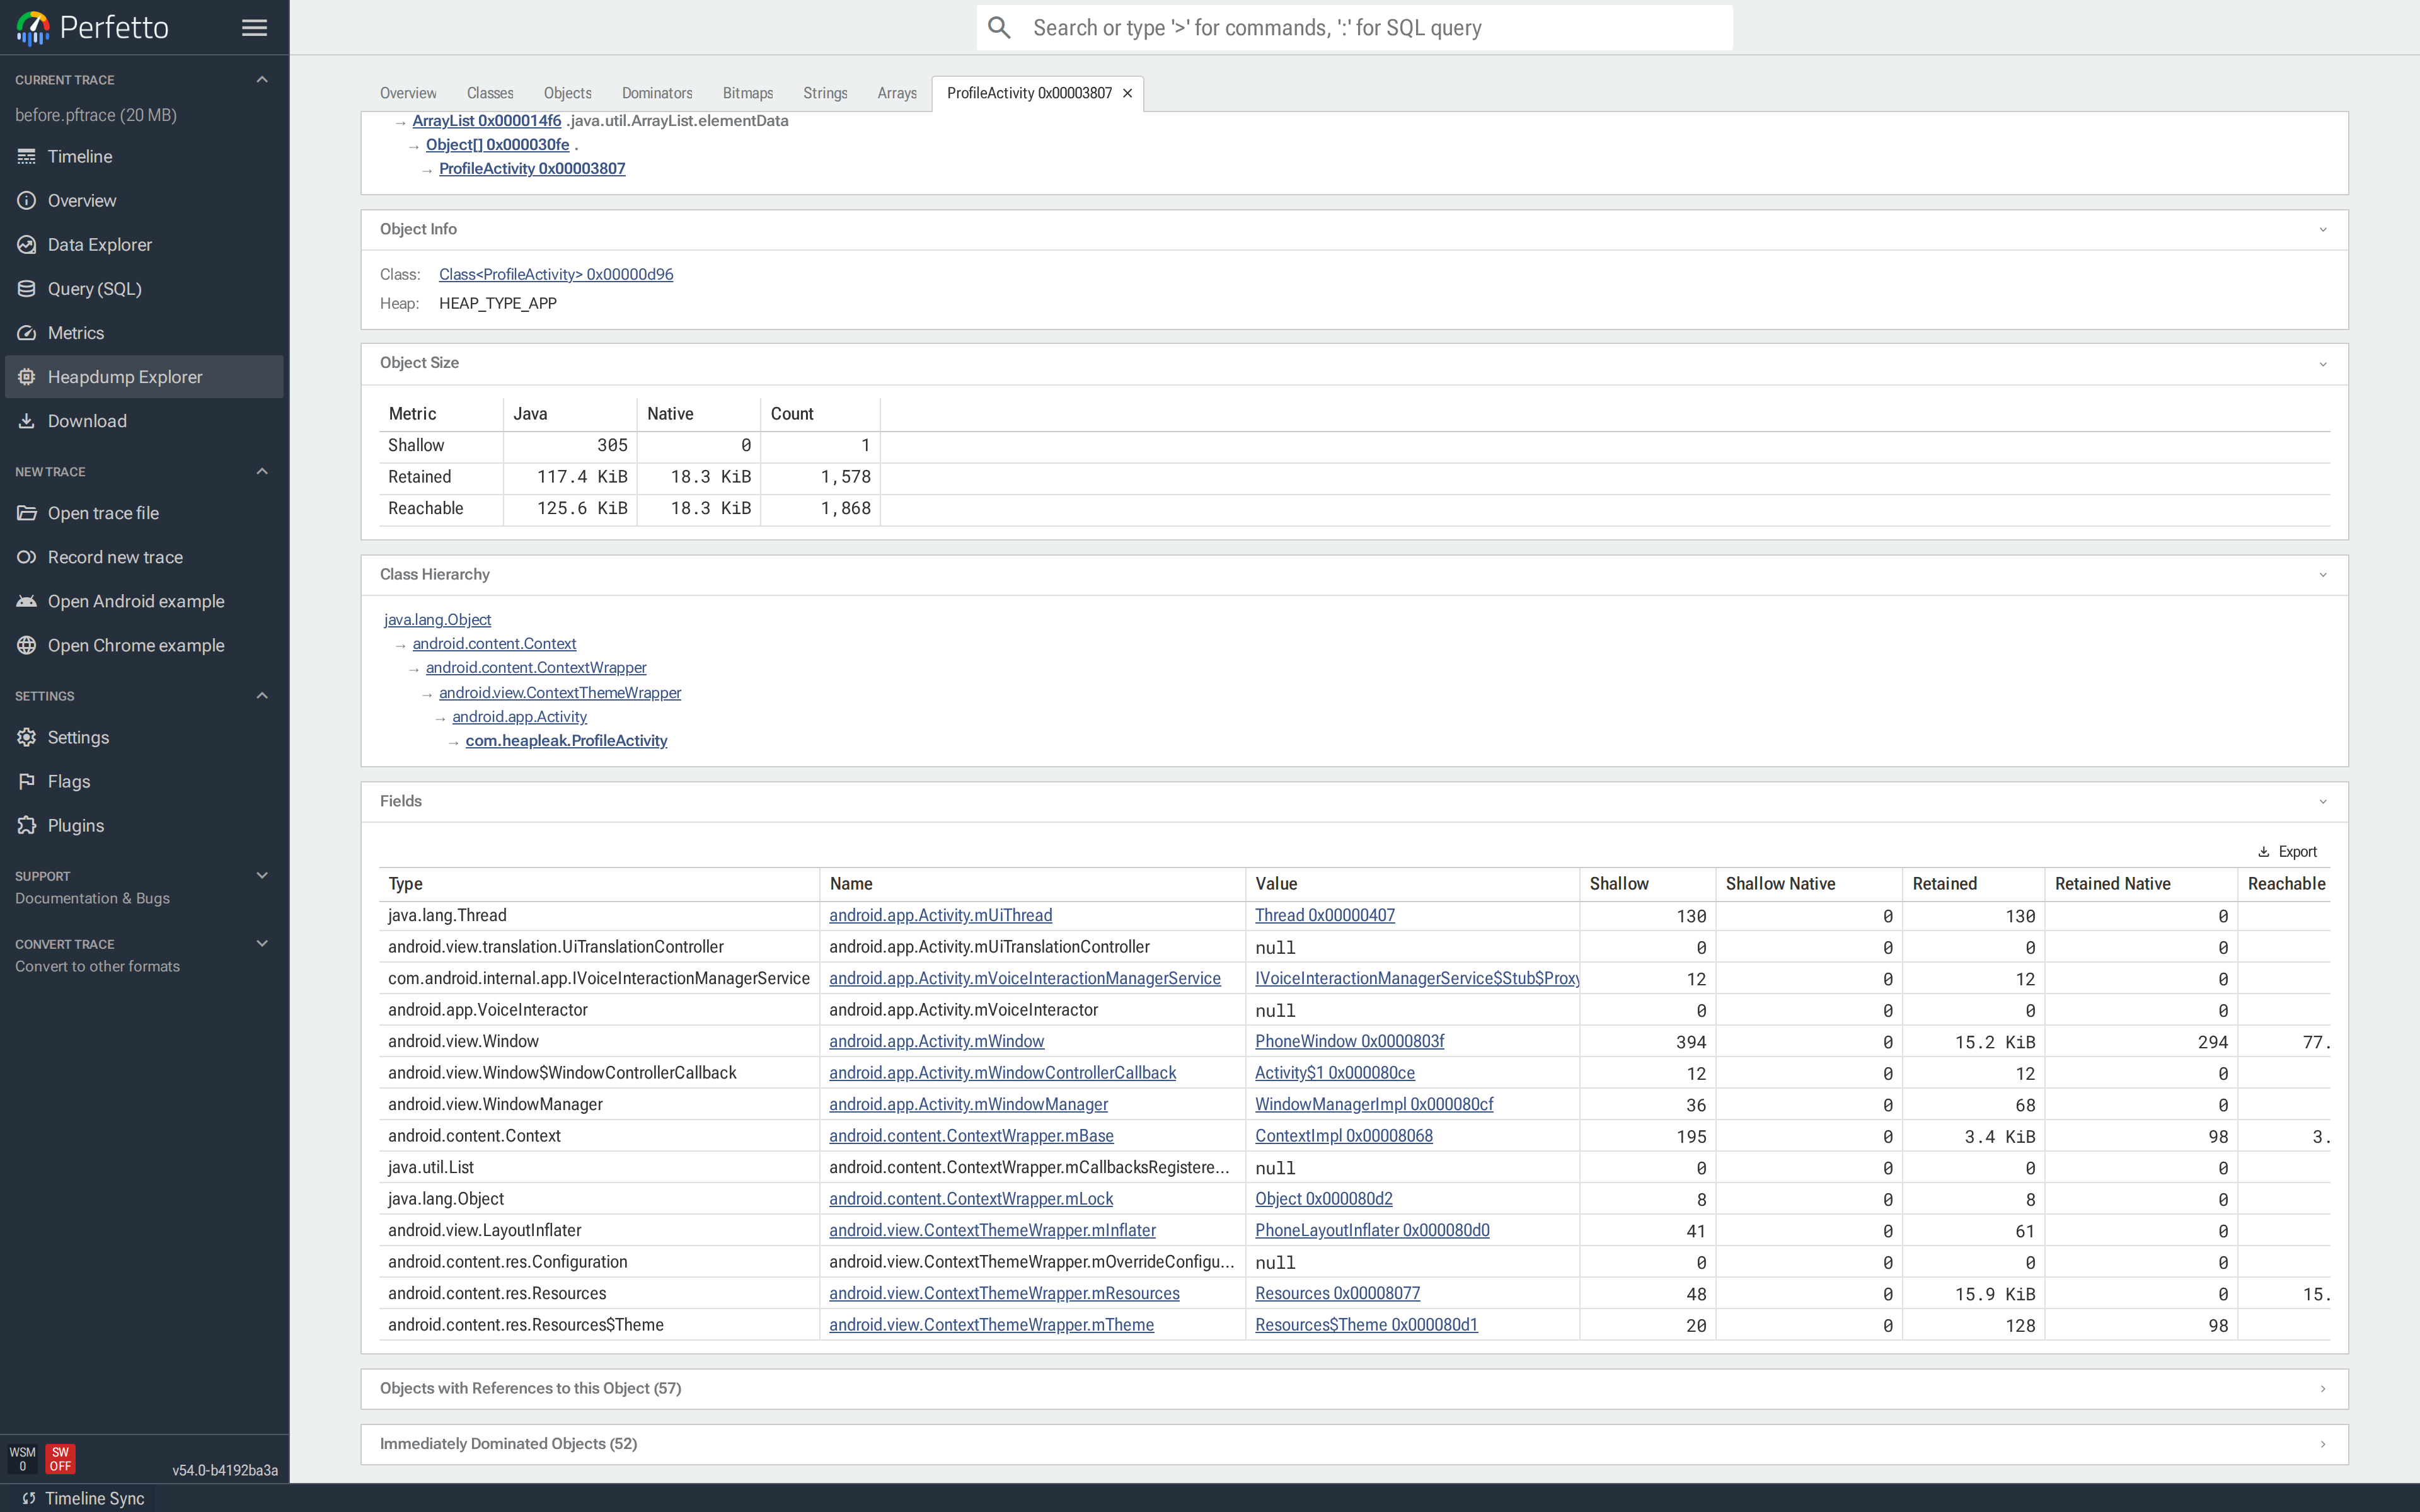
Both sections auto-collapse on large objects — click the header to expand.
Dominators
The Dominators tab shows the
dominator tree
of the heap. In a directed graph, node a dominates node b when
every path from a root to b must pass through a. Applied to a heap:
if you free a, everything it dominates — every object reachable
only through a — is also freed. The dominator tree groups the heap
into these "freed-together" subtrees, making it easy to see which
single objects gate the largest chunks of retained memory.
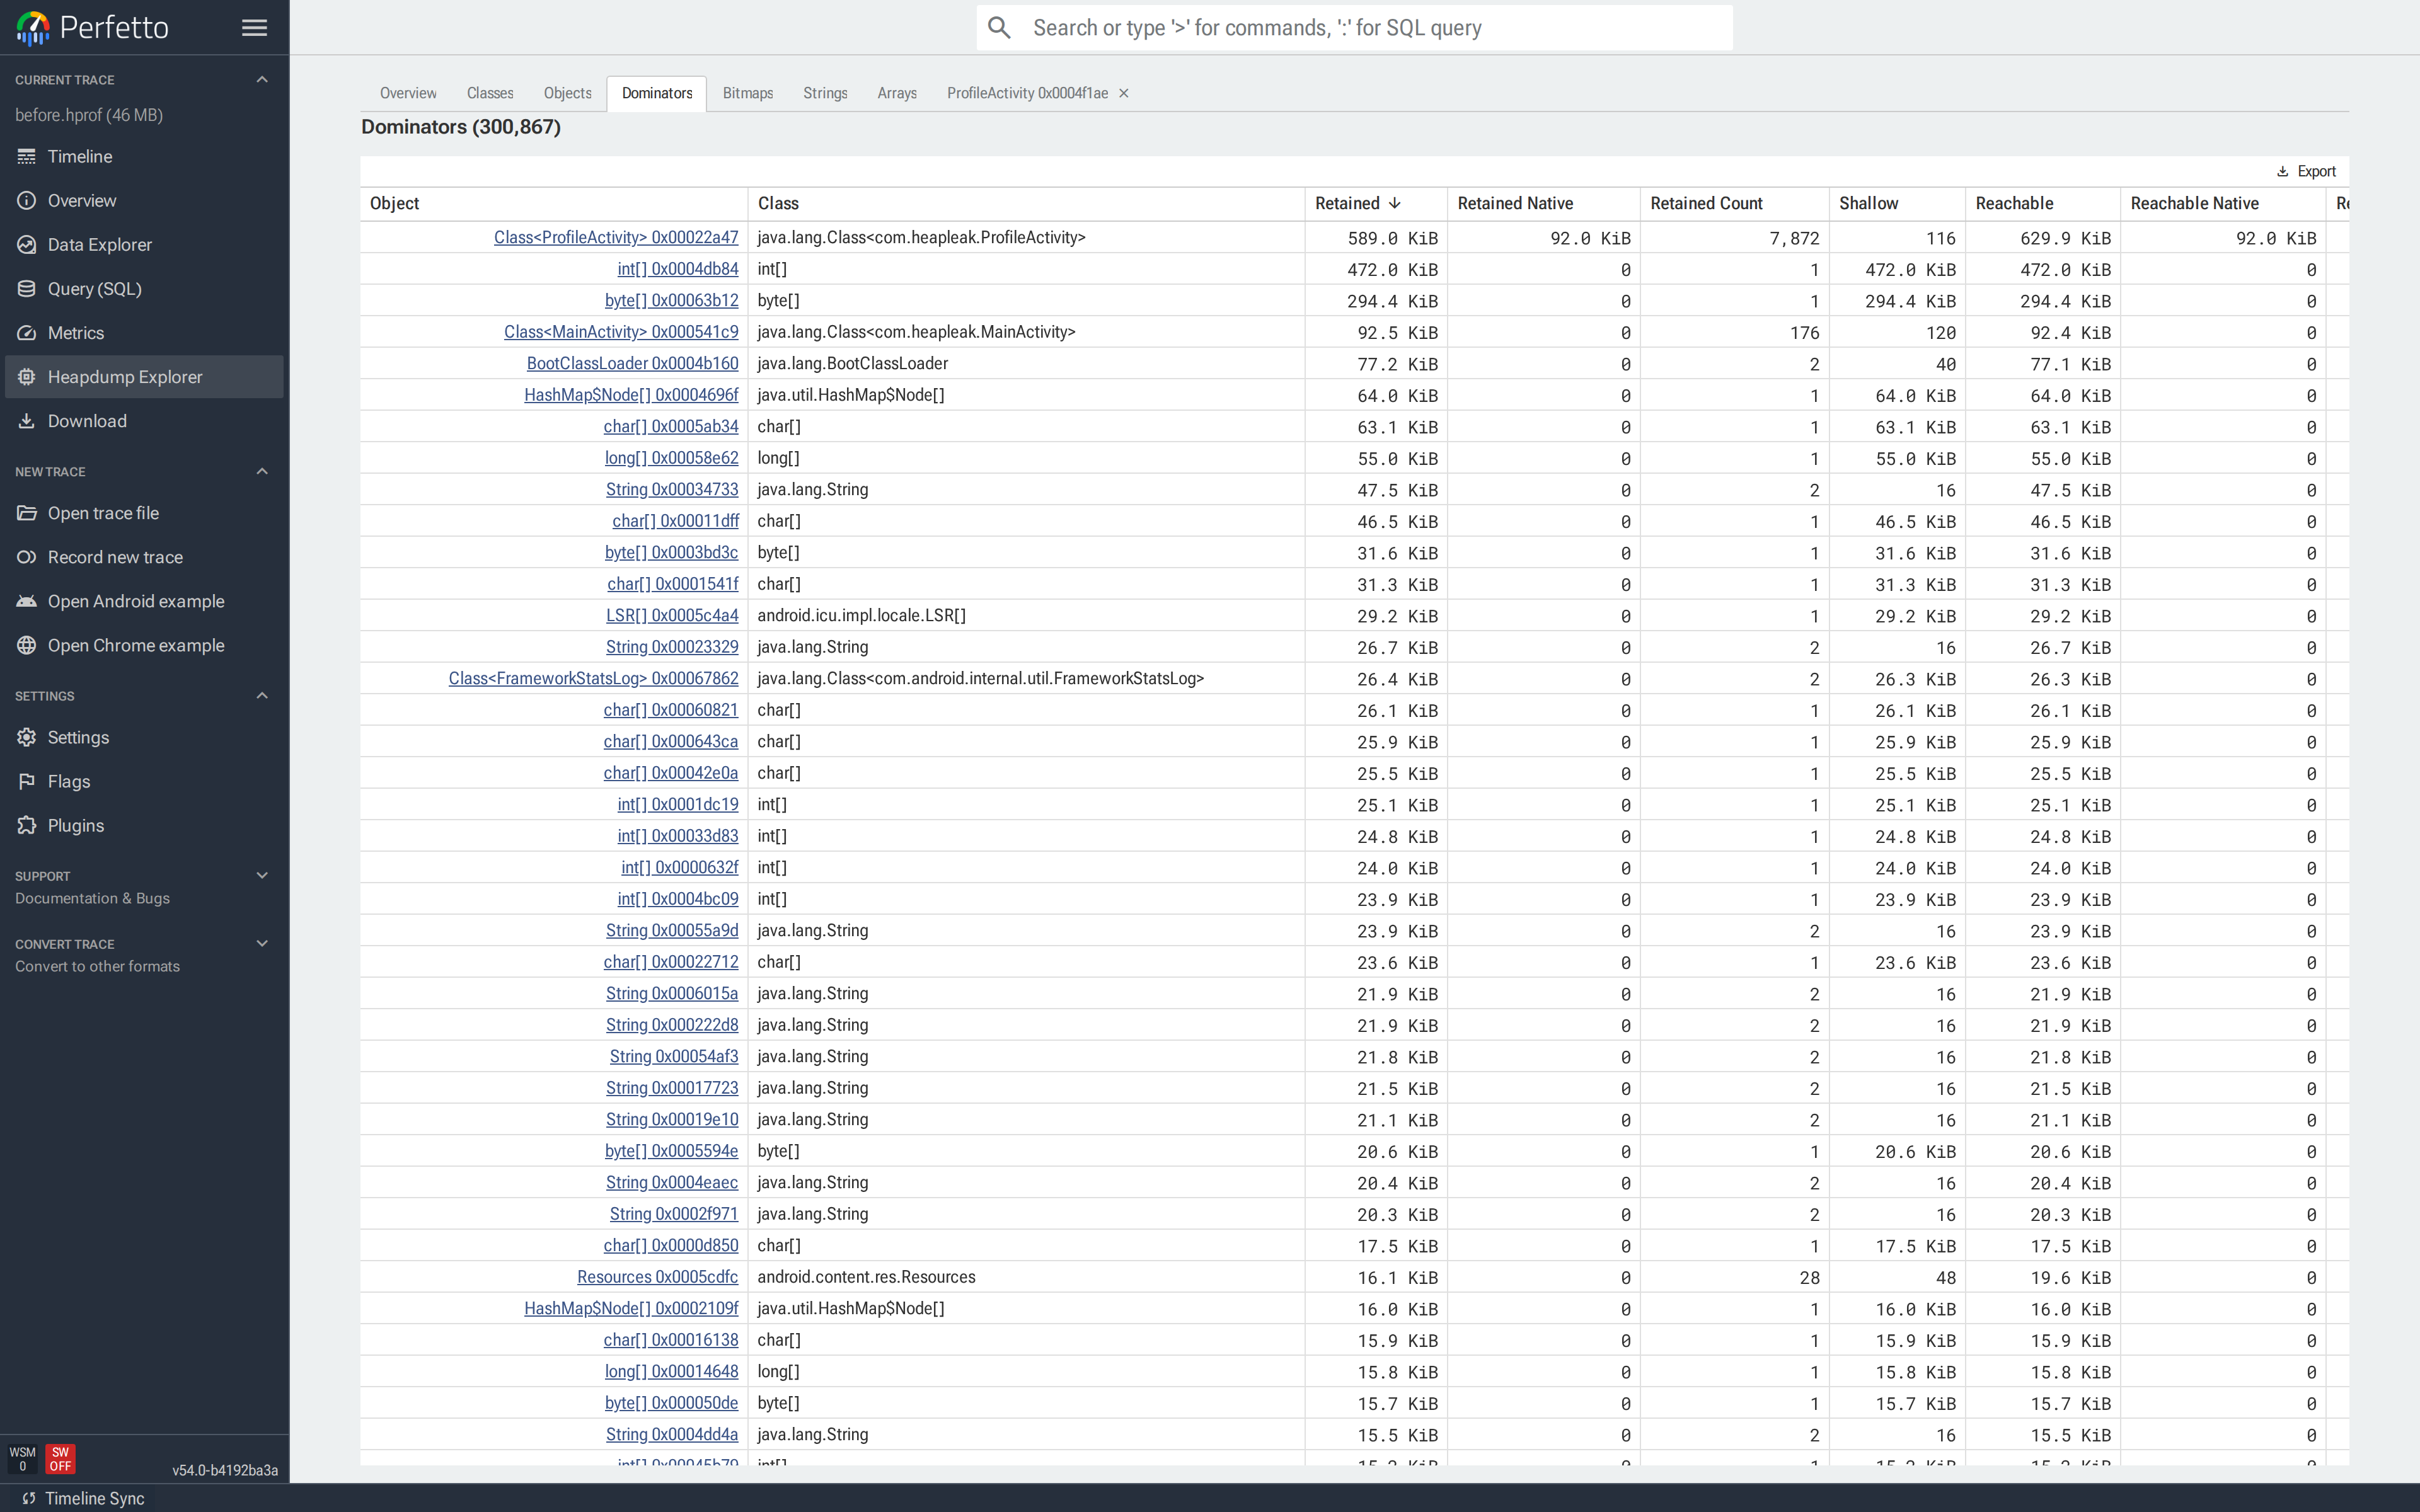
Root Type (e.g. THREAD, STATIC, JNI_GLOBAL) identifies how each
dominator is itself kept alive. Click a row to open its object tab and
walk the reference path.
Use this tab when there is no specific suspect and the question is simply where the memory has gone.
Bitmaps
NOTE: Pixel previews and duplicate detection require HPROF.
The Bitmaps tab is a gallery of every android.graphics.Bitmap in the
dump. With an HPROF, each bitmap's pixels are rendered inline.
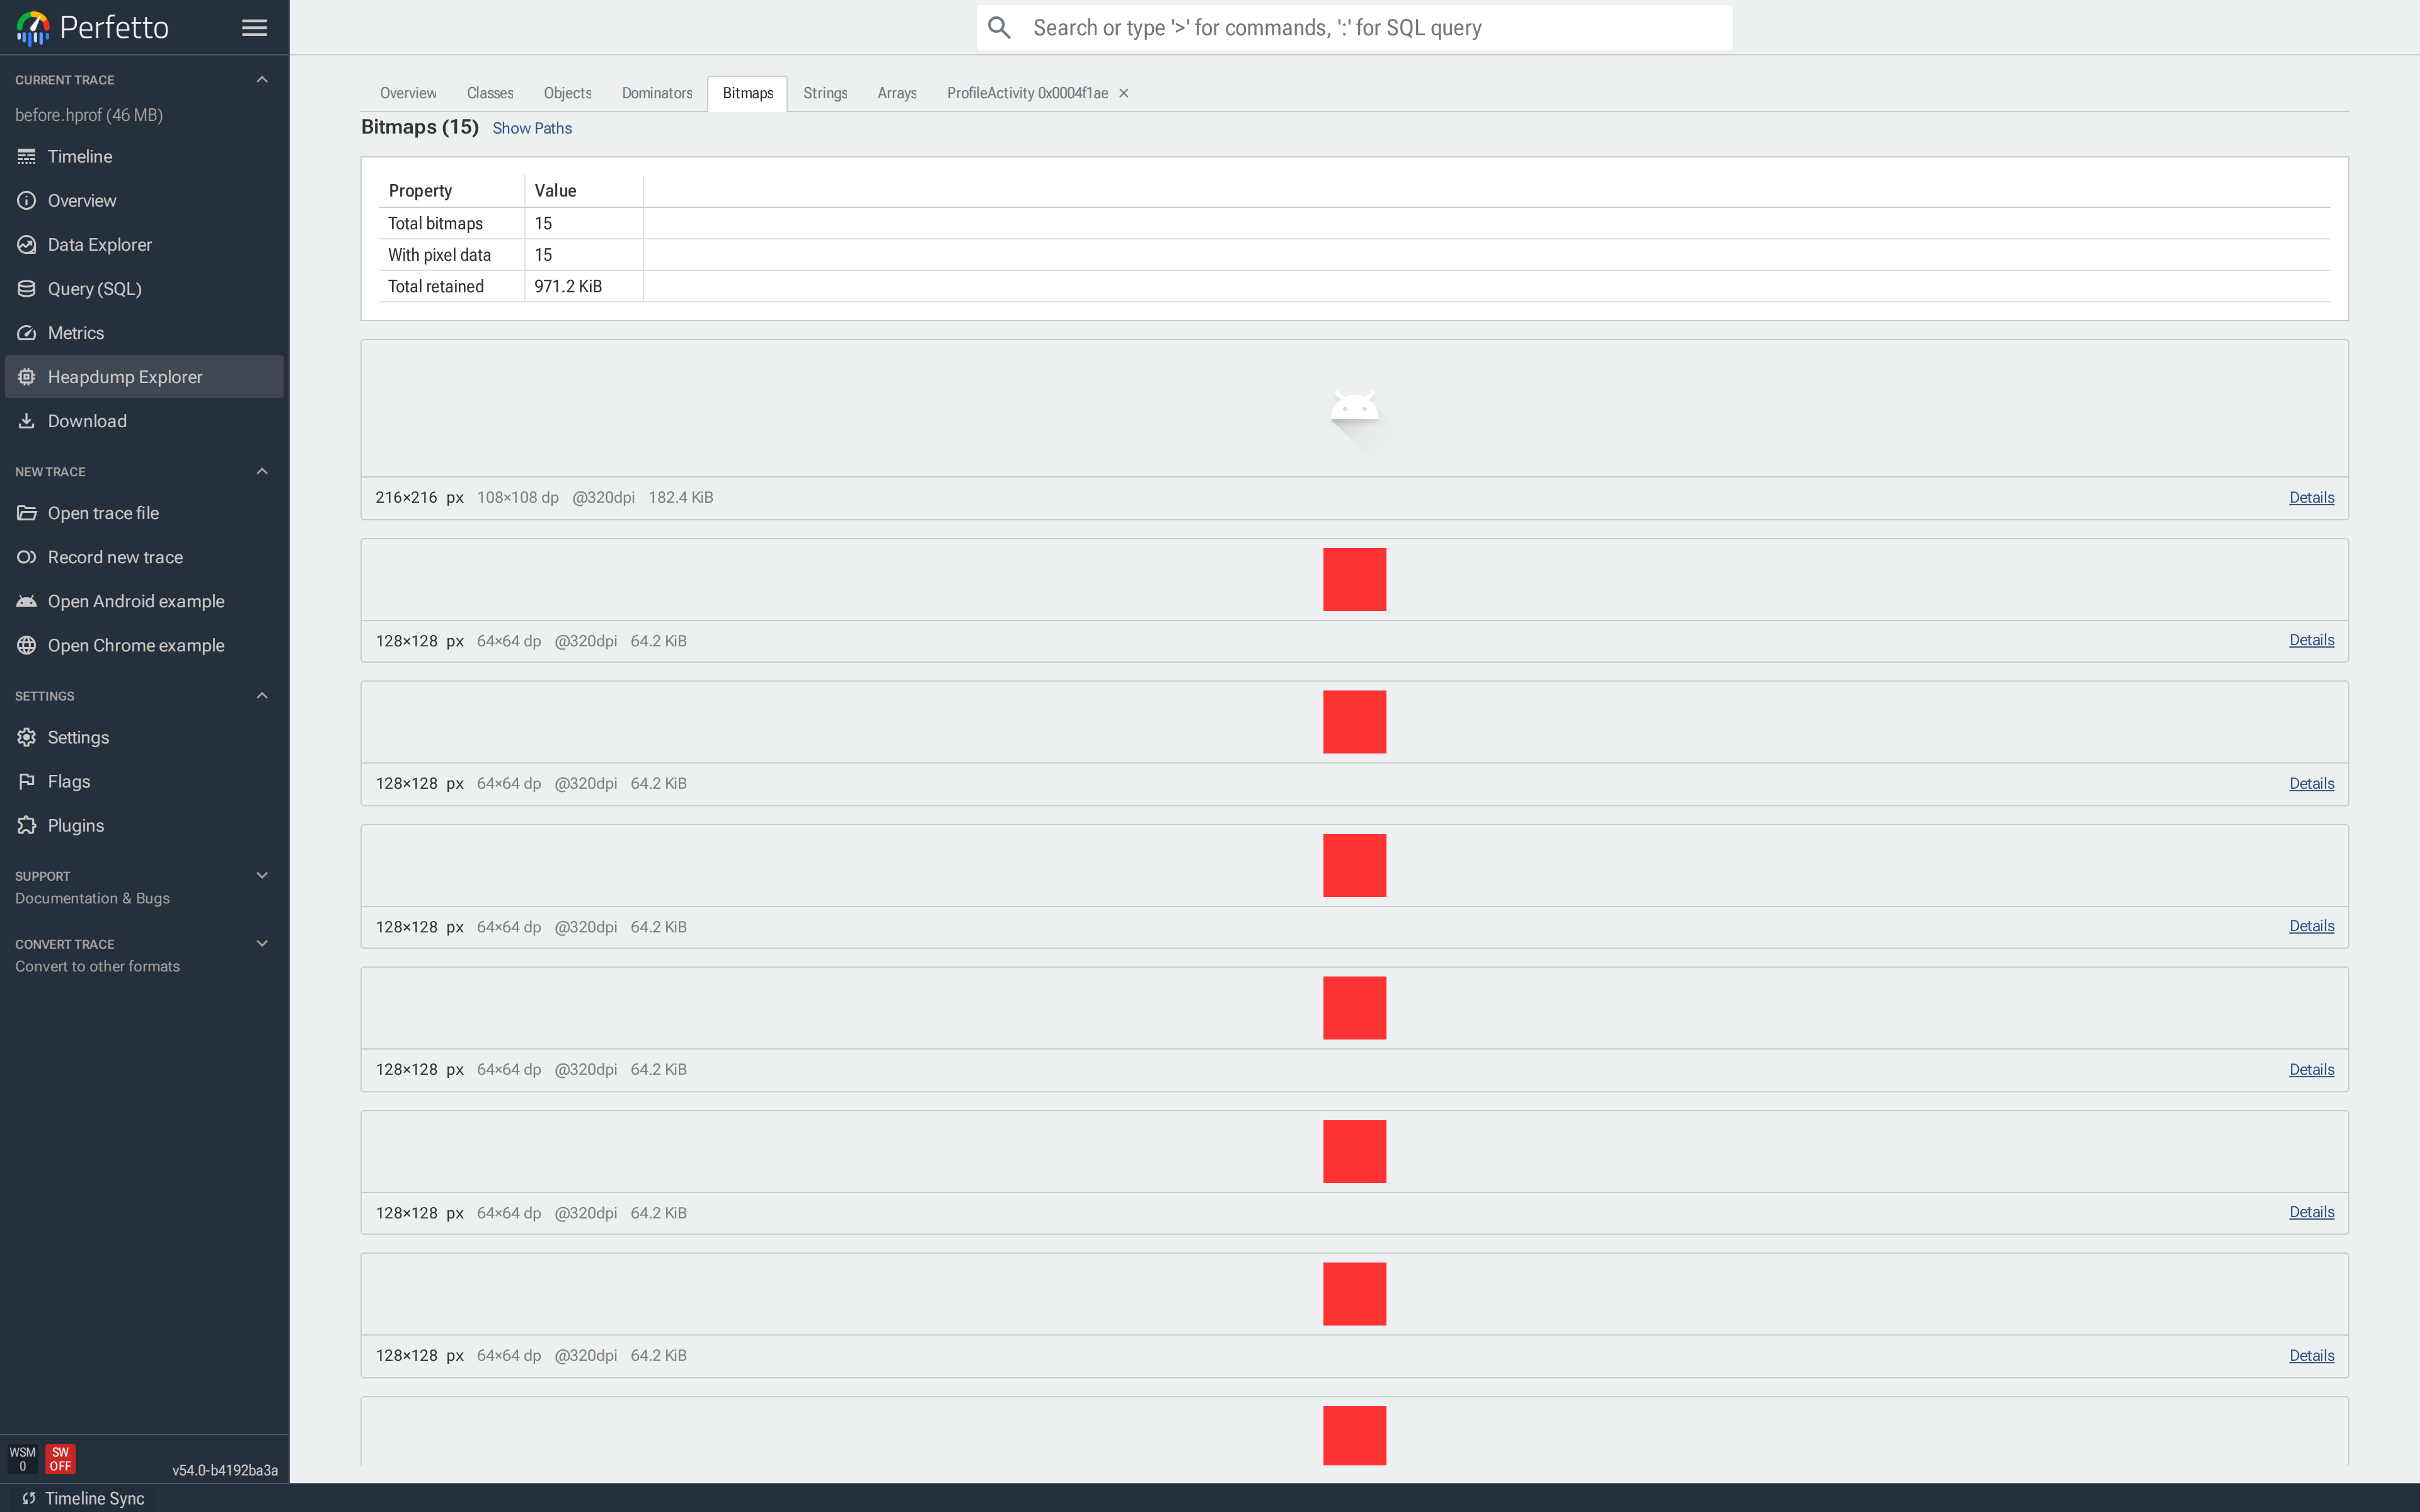
Each card shows the rendered pixels, dimensions (px and dp), DPI, retained memory and a Details button that opens the object tab. Pixel buffers may be RGBA, PNG, JPEG or WebP depending on how they were stored.
The path dropdown above the gallery picks which reference path to
overlay on each card: Shortest path (fewest edges from a GC root),
Dominator path (the chain of dominators), or No path. Showing a
path is the fastest way to spot an Activity, Fragment or
Handler holding leaked bitmaps.
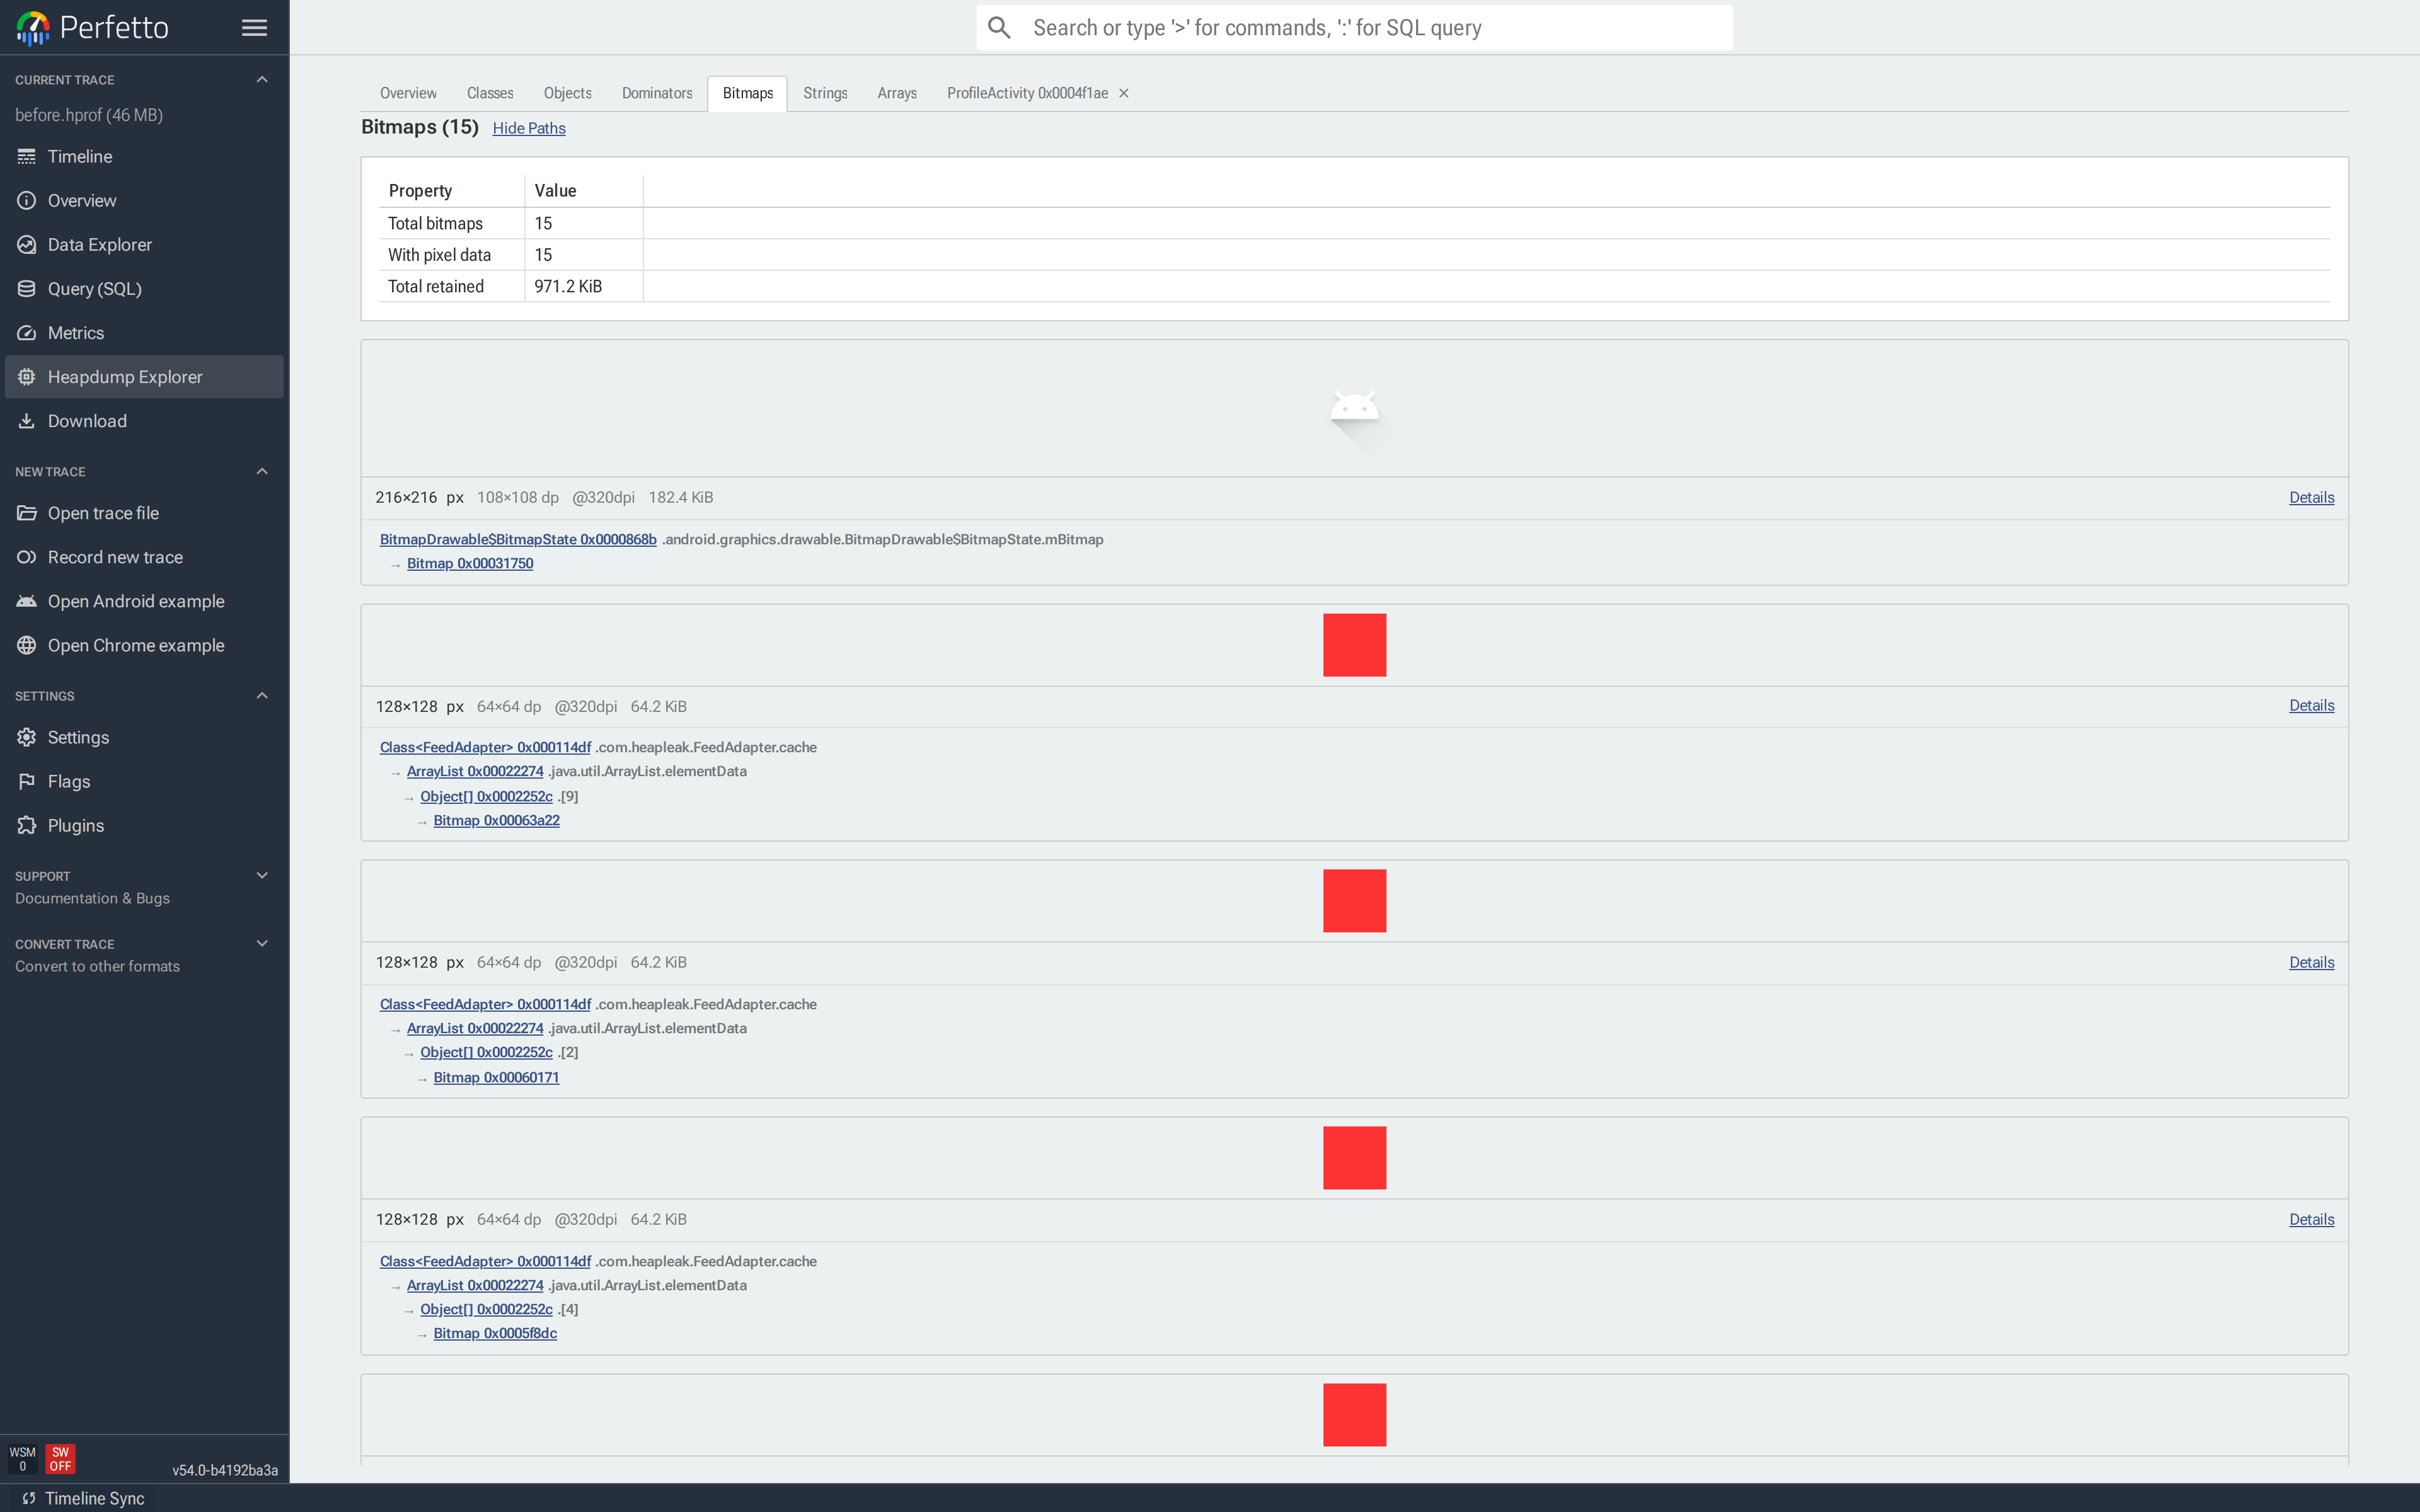
Two tables at the bottom list bitmaps with and without pixel data, with filter, sort and export controls. Arriving via Copies on Overview pre-filters the tab by buffer content hash, leaving only the visually identical bitmaps in that group.
Strings
NOTE: The Strings tab requires HPROF.
The Strings tab lists every java.lang.String with its value. The
summary card reports the total number of strings, the number of
distinct values and the total retained memory. The gap between total
and distinct is memory spent on duplicates.
Filter by value to find data that was expected to be unique: a user id, a serialized config payload, an error message repeated thousands of times. Clicking a row opens its object tab, where the reverse-references section lists every object holding that string.
Arrays
NOTE: The Arrays tab requires HPROF.
The Arrays tab lists primitive arrays (byte[], int[], long[],
...) together with a stable content hash. Filtering by Content Hash
returns every array with the same bytes; this is how the Overview
detects duplicate arrays.
Two common uses: finding a large duplicated byte[] that backs an
image or serialized buffer, and jumping from a container object to
the primitive array holding its data.
Jumping from a flamegraph
The timeline heap graph flamegraph (a full feature reference is in the Flamegraph section above) has an Open in Heapdump Explorer action that opens the explorer on the list of objects matching a selected reference path. Use it to inspect a flamegraph node object-by-object:
Click a diamond in a "Heap Profile" track to open the flamegraph.
Click a node to select it, then click the menu icon in the node's details popup. Pick "Open in Heapdump Explorer".
This opens a new closable Flamegraph Objects tab listing every object allocated along the selected path. Dominator flamegraph nodes produce a dominator-based selection; regular nodes produce a path-based selection.
From there, click any object to open its object tab, or use Back to Timeline to return to the flamegraph view.
Multiple flamegraph selections can be open at once, each as its own tab — useful for comparing two call stacks side by side.
Case studies
Finding a leaked Activity
A developer on a Kotlin app reports that rotating their profile
screen a few times drives the Java heap upward and never comes back
down. The screen is unremarkable — an Activity, a view hierarchy,
one avatar — and rotating should destroy the old instance. It
doesn't.
A quick grep turns up a "breadcrumb" list the team added a while
ago for crash reporting. It stores every ProfileActivity instance
created, and is never cleared:
class ProfileActivity : Activity() {
    companion object {
        val history = mutableListOf<ProfileActivity>()   // never cleared
    }

    override fun onCreate(state: Bundle?) {
        super.onCreate(state)
        setContentView(R.layout.profile)
        history += this                                   // <-- the bug
    }
}
The intent was to keep a lightweight trail of recent screens for
crash reports. What it actually does is pin every ProfileActivity
ever created: onDestroy runs on the old one, but the class's
static history list keeps a strong reference — along with the old
Activity's entire view hierarchy.
Capturing. The heap graph format is enough to chase an Activity leak; it carries the full object graph and GC roots:
$ tools/java_heap_dump -n com.example.app -o /tmp/profile.pftrace

Dumping Java Heap.
Wrote profile to /tmp/profile.pftrace
Rotate the device a handful of times first so multiple instances accumulate. Drag the file onto ui.perfetto.dev and click Heapdump Explorer in the sidebar.
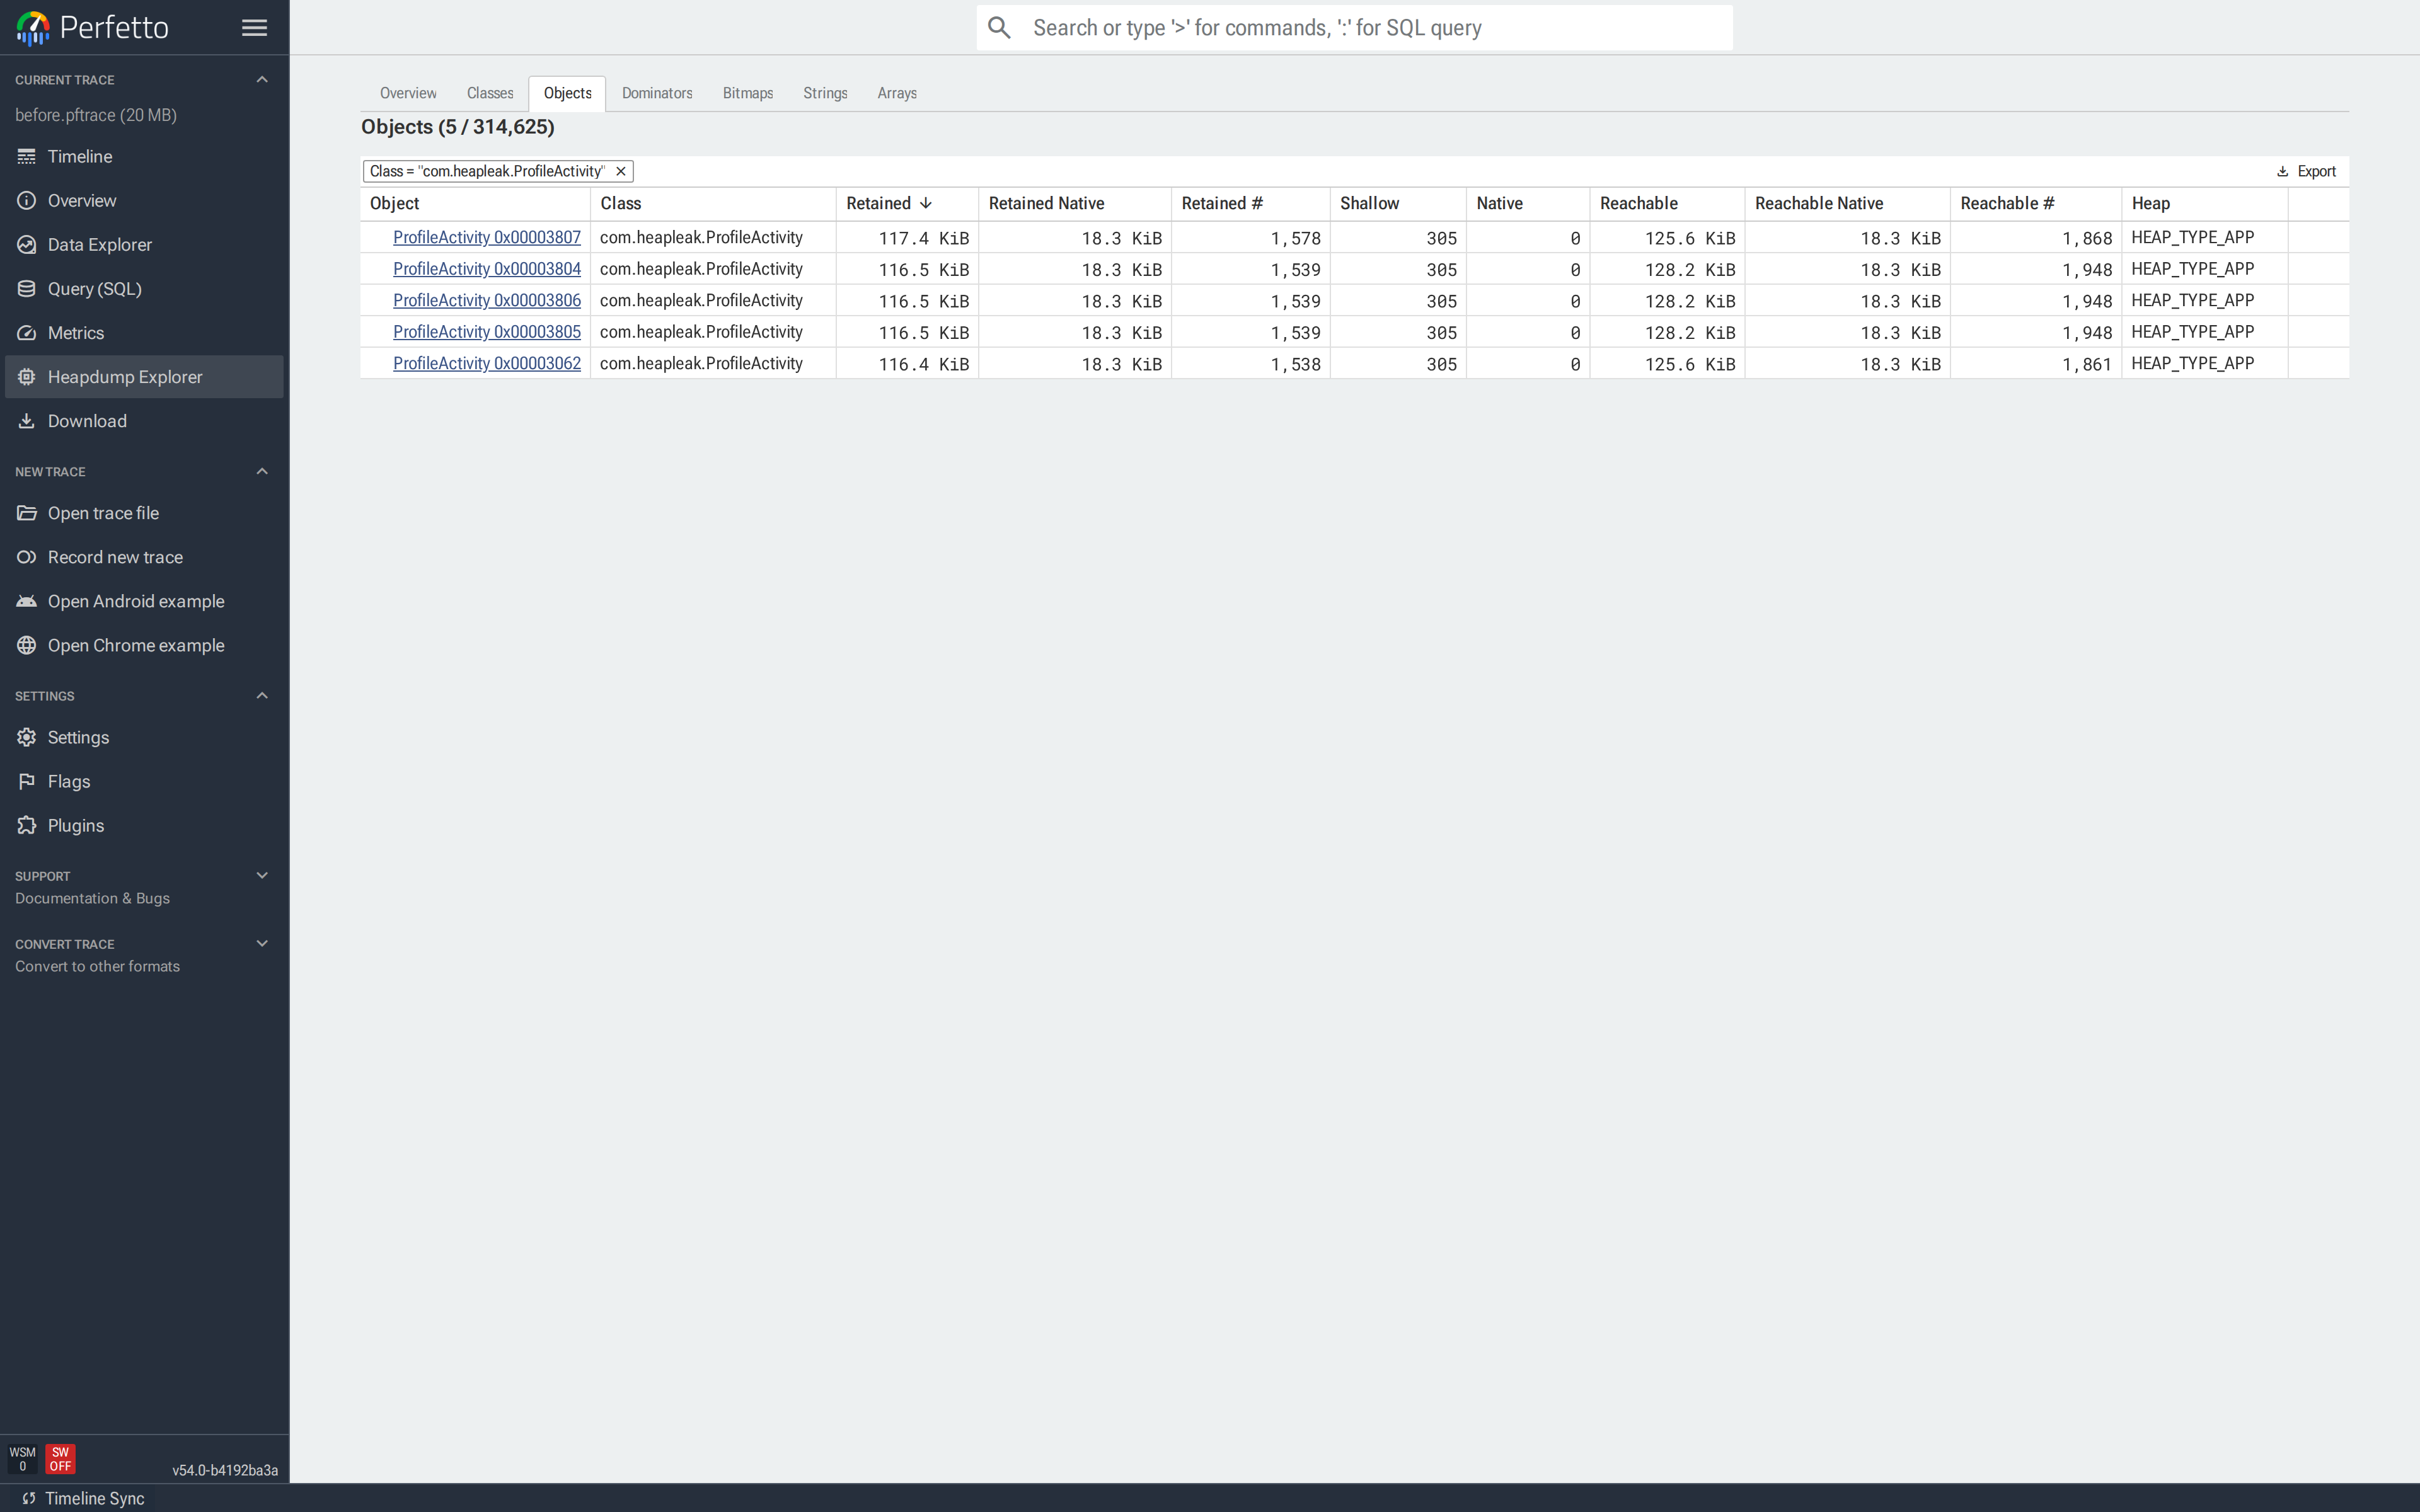
Confirming the leak. Open Classes and find
com.heapleak.ProfileActivity. Count should be 0 after the user
has navigated away; here it's 5, one per rotation:
Clicking the class name opens Objects filtered to
ProfileActivity. Every row is one live instance:
Reading the reference path. Click the top row to open its object tab. The Sample Path from GC Root is the chain of field references keeping this instance alive:
Read bottom-up: the runtime keeps the java.lang.Class<ProfileActivity>
alive (as it does for every loaded class); that class has a
companion-object field history; that field points at an ArrayList
whose element 0 is this ProfileActivity. The hop from the class
object to history names the bug — a static list of Activities.
The Object Size block quantifies the cost: one leaked Activity is
pinning 117.6 KiB and ~1,600 reachable objects. Multiply by
five (the Count) and the leak is already ~600 KiB of Activity
graphs sitting in the heap. Further down the same tab are the
Objects with References to this Object and Immediately Dominated
Objects sections:
Expanding Immediately Dominated Objects shows everything going
down with the leak — the Activity's view hierarchy and the rest
of the state it transitively retains. None of it is supposed to
outlive the Activity; all of it does, because one companion-object
list is holding the root.
Fix. Never store an Activity in a static or companion-object
container. If you want a breadcrumb trail for crash reports, store
strings with a bounded capacity instead:
object Breadcrumbs {
private const val CAPACITY = 16
private val trail = ArrayDeque<String>(CAPACITY)
fun record(event: String) {
while (trail.size >= CAPACITY) trail.removeFirst()
trail.addLast("${System.currentTimeMillis()} $event")
}
}
class ProfileActivity : Activity() {
override fun onCreate(state: Bundle?) {
super.onCreate(state)
setContentView(R.layout.profile)
Breadcrumbs.record("ProfileActivity.onCreate")
}
}Re-run the same repro and re-dump. The Classes tab now shows
exactly one ProfileActivity — the currently visible screen —
instead of one per rotation.
This tiny demo saves ~1.5 MiB of app heap; a real screen with a
live view hierarchy sees the difference in tens of megabytes. Any
Activity subclass showing Count > 0 in a dump captured after
the user navigated away is a leak.
The same recipe finds the other common shapes of Activity leak —
delayed-message Handlers, unregistered listeners, coroutines that
outlived their scope. The last hop before the Activity in the
reference path always names the holder; the fix is to clear that
field at the right lifecycle callback.
Tracking down duplicate bitmaps
A Kotlin feed app is running out of memory on long scrolls. dumpsys meminfo com.example.feed reports a Graphics: line several times
bigger than the pixels actually on screen, and the in-app image
cache looks small. Something else is holding pixels.
The suspect turns out to be a RecyclerView adapter that decodes
each row's thumbnail from resources on every bind, and appends the
result to a companion-object list:
class FeedAdapter(private val res: Resources) : RecyclerView.Adapter<VH>() {
    companion object {
        val cache = mutableListOf<Bitmap>()     // grows without bound
    }

    override fun onBindViewHolder(holder: VH, position: Int) {
        val bmp = BitmapFactory.decodeResource(res, R.drawable.thumb)
        cache += bmp                            // "cache" — actually just accumulates
        holder.image.setImageBitmap(bmp)
    }
    // ...
}
Every bind decodes a fresh copy of the same PNG. Every copy is then
held forever by cache. The pixels all hash to the same value, but
they're different Bitmap instances with different backing
byte[]s.
Capturing. Duplicate detection needs the hash of each bitmap's
pixel buffer, which only the HPROF format carries. -b png encodes
the pixels so the Bitmaps gallery can render previews:
$ adb shell am dumpheap -g -b png com.example.feed /data/local/tmp/feed.hprof
$ adb pull /data/local/tmp/feed.hprof
Scroll the feed long enough to reproduce the bloat before dumping —
the adapter's cache only grows on bind.
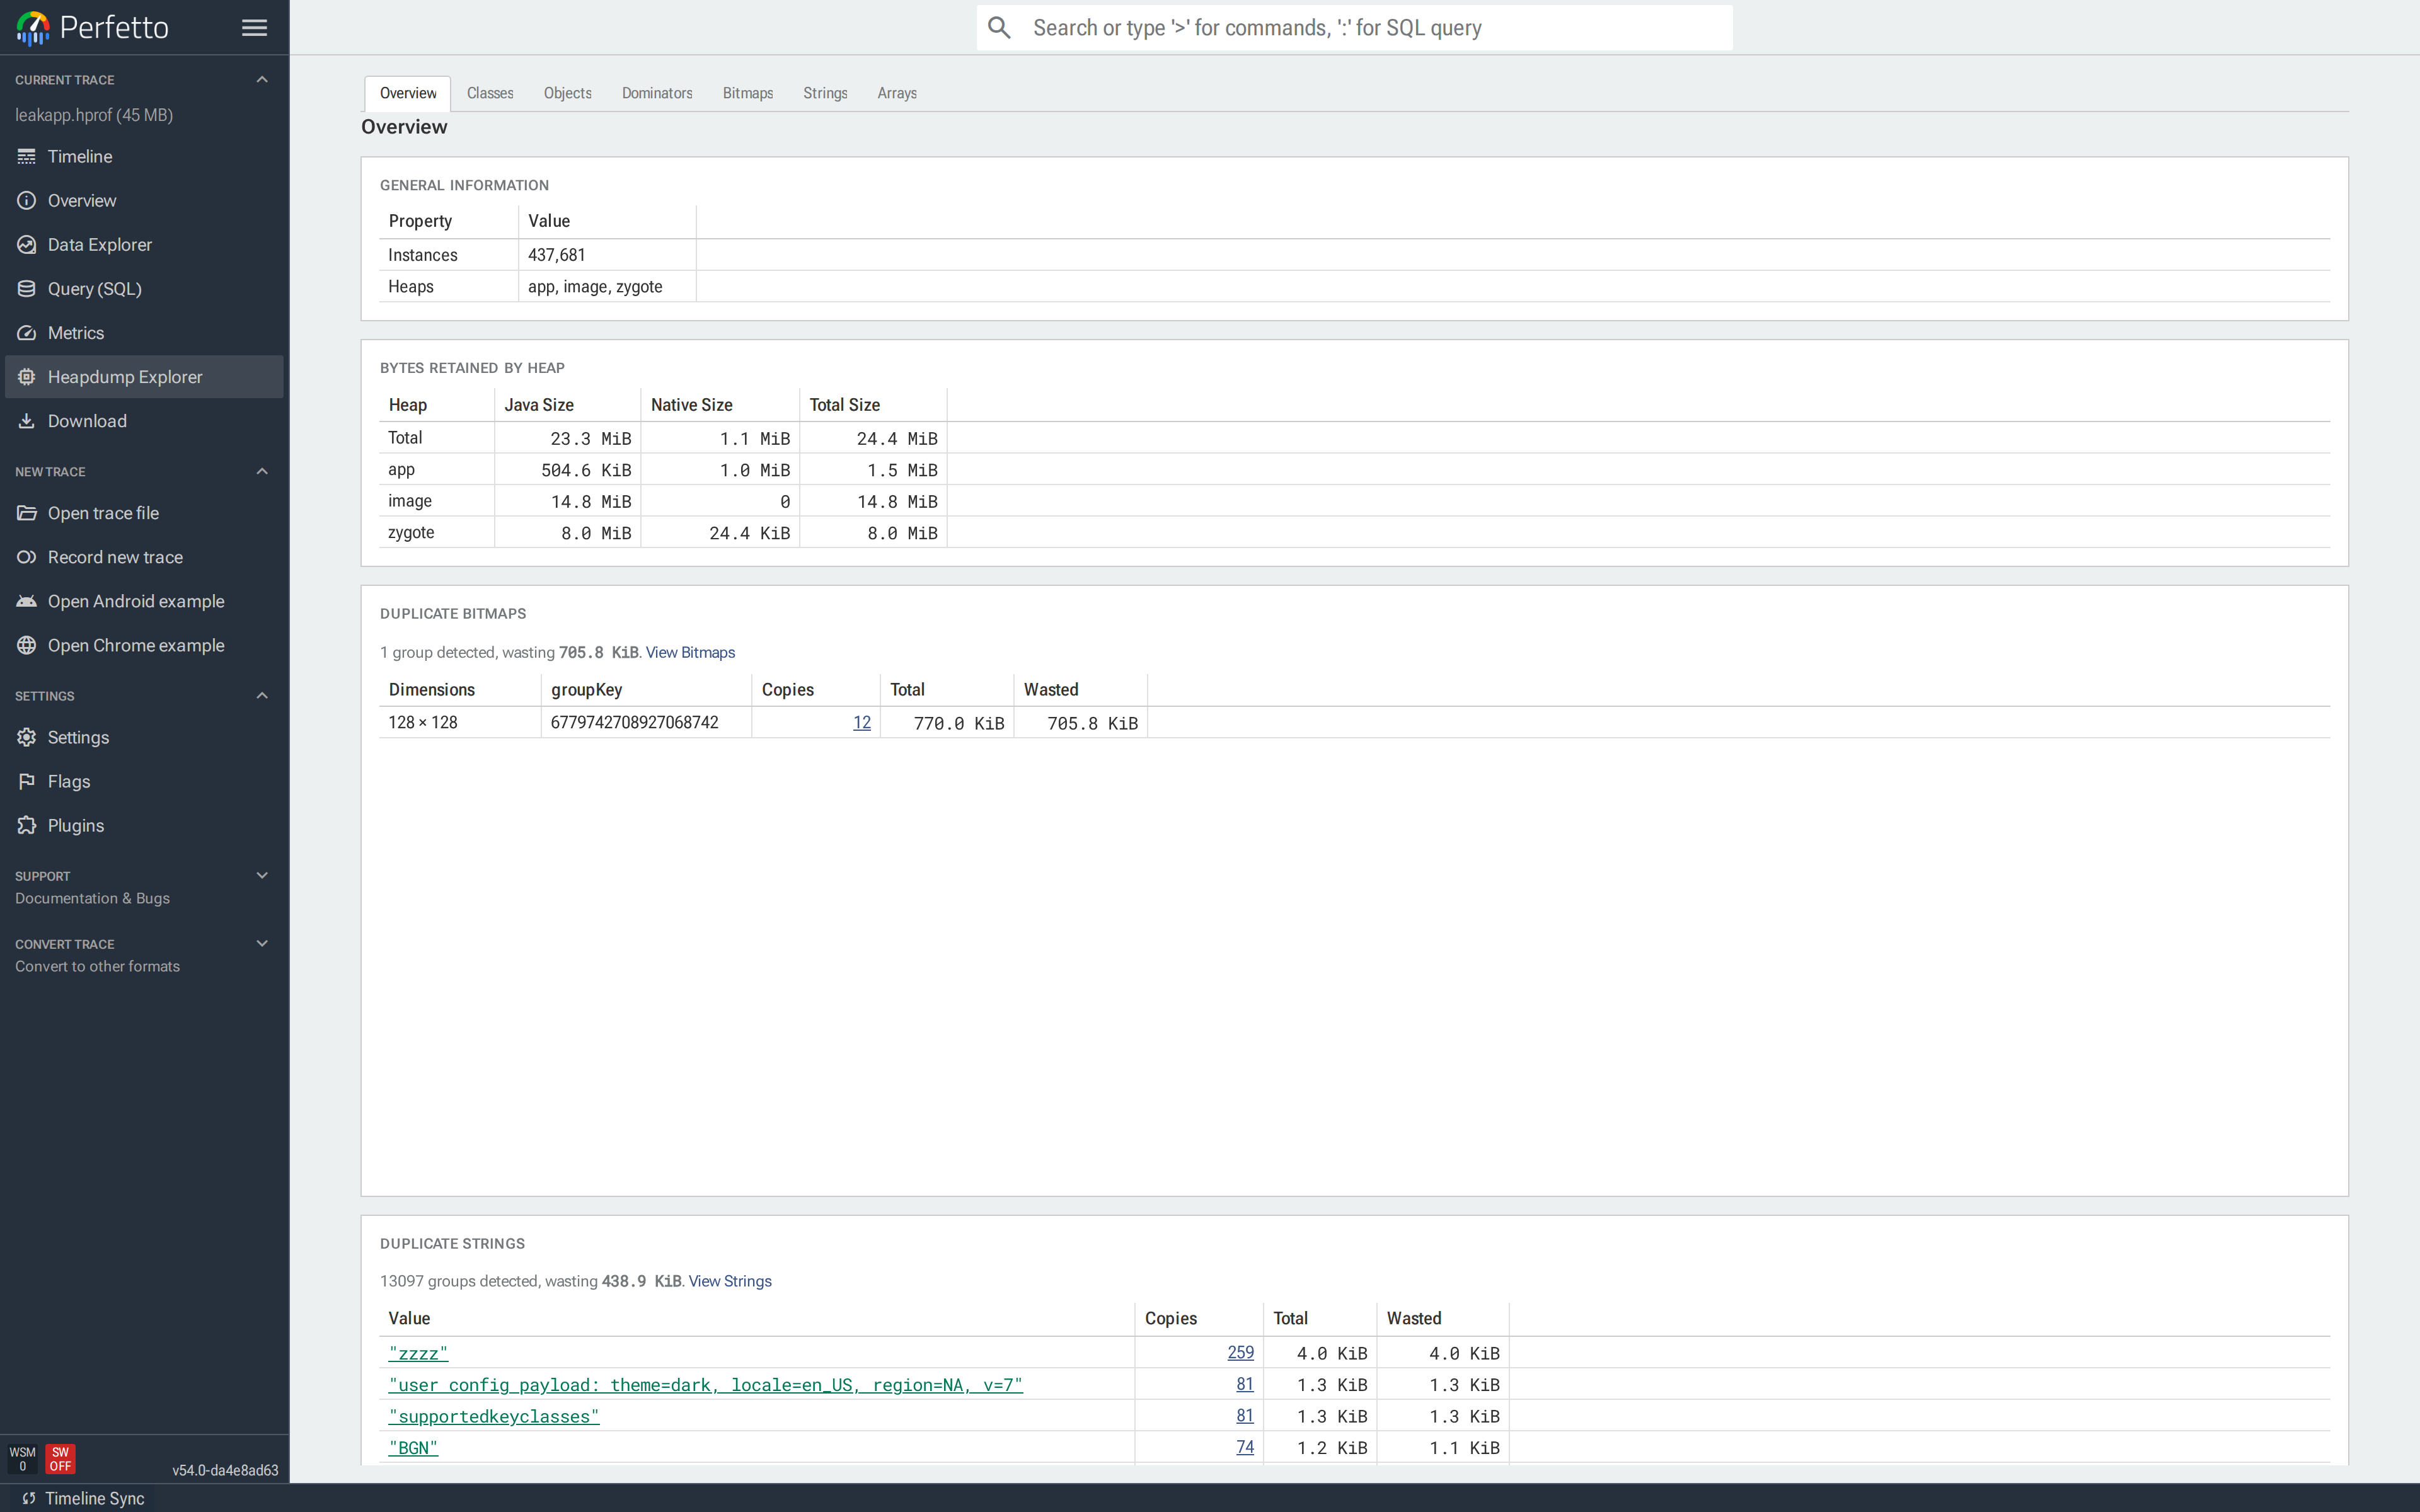
Triage on the Overview. The Overview groups bitmaps by pixel-buffer hash. Each row shows copy count, total bytes across all copies, and wasted bytes — what deduplicating to a single copy would save:
The row shows what was accumulated: twelve copies of one 128×128 asset, all with the same content hash. The Duplicate Strings and Duplicate Primitive Arrays cards below work the same way — same grouping, same sizing — and are useful when the wasted memory is in text (e.g. a config payload duplicated thousands of times) or primitive buffers. All three duplicate detectors require HPROF because they hash the actual content, which the heap graph format doesn't carry.
Drill into the copies. Click Copies on that row. Bitmaps opens pre-filtered to that content-hash group, so only those copies render as cards:
Find the holder. Set the path dropdown to Shortest path. The reference chain below each card is the fields keeping that bitmap alive:
Every chain in the gallery is identical: Class<FeedAdapter>.cache → ArrayList → Bitmap. All twelve copies share one holder — a
cache-layer bug, one field to fix.
The shape of the chains is the diagnostic. Two other patterns to recognize on future investigations:
- Each copy has a different chain → call-site bug. There's no cache, or callers are bypassing it.
- The chain passes through an
Activity→ fix the Activity leak first (previous case study); the bitmaps will follow.
Fix. There's no real reason to keep a side list of Bitmaps at
all — Android already has a LruCache<K, Bitmap>, scoped to the
application, with eviction you control:
class FeedAdapter(private val res: Resources) : RecyclerView.Adapter<VH>() {
    companion object {
        private val cache = object : LruCache<Int, Bitmap>(4) {
            override fun sizeOf(key: Int, value: Bitmap) = 1
        }
    }

    override fun onBindViewHolder(holder: VH, position: Int) {
        val key = R.drawable.thumb
        val bmp = cache[key] ?: BitmapFactory.decodeResource(res, key).also { cache.put(key, it) }
        holder.image.setImageBitmap(bmp)
    }
    // ...
}
Verify. Scroll the feed the same distance, re-dump, re-open.
The Overview should declare No duplicate bitmaps found, and the
app-heap retained bytes should drop accordingly:
The wasted bytes total across all groups on the Overview is the cleanest single-number scorecard — watching it drop from dump to dump is how you confirm each fix and catch regressions.
See also
- ART heap dumps — recording config, troubleshooting and SQL schema reference.
- Memory case study — end-to-end guide
to investigating Android memory issues, covering
dumpsys meminfo, native heap profiles and ART heap dumps together. - OutOfMemoryError heap dumps — capturing a heap dump automatically on OOM.
- Native heap profiler — for allocation call-path analysis rather than heap contents.