
Trace Processor (C++)
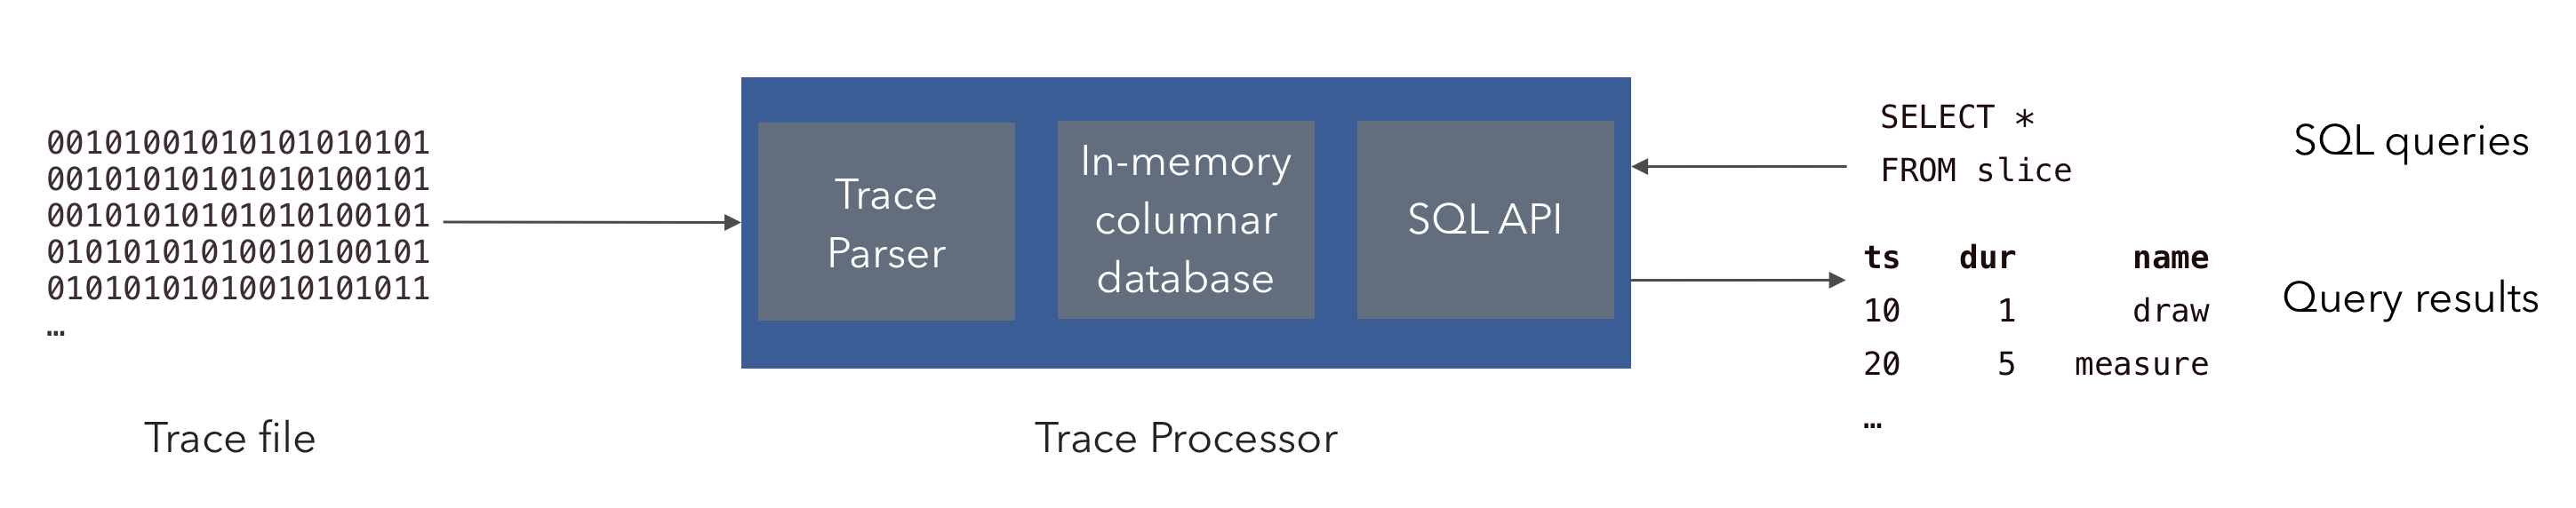
The Trace Processor is a C++ library (/src/trace_processor) that ingests traces encoded in a wide variety of formats and exposes an SQL interface for querying trace events contained in a consistent set of tables. It also has other features including computation of trace summaries, annotating the trace with user-friendly descriptions and deriving new events from the contents of the trace.
Most users will interact with Trace Processor through the
trace_processor shell, a command-line wrapper around the library
that opens an interactive PerfettoSQL prompt. Embedders that want to integrate
Trace Processor into another C++ application should jump to
Embedding the C++ library. Python users should see the
Python API instead.
The trace_processor shell
The trace_processor shell is a command-line binary which wraps the C++
library, providing a convenient way to interactively analyze traces.
Downloading the shell
The shell can be downloaded from the Perfetto website. The download is a thin
Python wrapper that fetches and caches the correct native binary for your
platform (including trace_processor_shell.exe on Windows) under
~/.local/share/perfetto/prebuilts on first use.
curl -LO https://get.perfetto.dev/trace_processor
chmod +x ./trace_processor
curl.exe -LO https://get.perfetto.dev/trace_processorPython 3 is required to run the wrapper script. curl ships with Windows 10
and later.
Running the shell
Once downloaded, you can immediately use it to open a trace file:
./trace_processor trace.perfetto-tracepython trace_processor trace.perfetto-traceThis will open an interactive SQL shell where you can query the trace. For more information on how to write queries, see the Getting Started with PerfettoSQL guide.
TIP: the trace file can also be a ZIP or TAR archive containing several traces: they are merged onto a single timeline. See Merging traces with Trace Processor.
For example, to see all the slices in a trace, you can run the following query:
> SELECT ts, dur, name FROM slice LIMIT 10;
ts                   dur                  name
-------------------- -------------------- ---------------------------
     261187017446933               358594 eglSwapBuffersWithDamageKHR
     261187017518340                  357 onMessageReceived
     261187020825163                 9948 queueBuffer
     261187021345235                  642 bufferLoad
     261187121345235                  153 query
...
Or, to see the values of all counters:
> SELECT ts, value FROM counter LIMIT 10;
ts                   value
-------------------- --------------------
     261187012149954          1454.000000
     261187012399172          4232.000000
     261187012447402         14304.000000
     261187012535839         15490.000000
     261187012590890         17490.000000
     261187012590890         16590.000000
...
Subcommand interface
In addition to launching an interactive REPL, trace_processor exposes a
subcommand-based CLI for non-interactive workflows: running a SQL query,
computing trace summaries, exporting to SQLite, starting an RPC server, and
converting between trace formats. The general invocation is:
trace_processor <command> [flags] [positional args]Run trace_processor --help for the top-level summary, or
trace_processor help <command> (equivalently trace_processor <command> --help)
for the flags accepted by a specific subcommand. The top-level help looks
like this:
Perfetto Trace Processor.
Usage: trace_processor [command] [flags] [trace_file]

If no command is given, opens an interactive SQL shell on the trace file.

Commands:
  query         Load a trace and run a SQL query.
  interactive   Interactive SQL shell (default if no command is given).
  server        Start an RPC server (http or stdio).
  summarize     Compute a trace summary from specs and/or built-in metrics.
  export        Export a trace to a database file.
  metrics       Run v1 metrics (deprecated; use 'summarize --metrics-v2').
  convert       Convert trace format.

Common flags (apply to all commands):
  -h, --help                  Show help (per-command if after a command).
  -v, --version               Print version.
      --full-sort             Force full sort ignoring windowing.
      --no-ftrace-raw         Prevent ingestion of typed ftrace into raw table.
      --add-sql-package PATH  Register SQL files from a directory as a package.
  -m, --metatrace FILE        Enable metatracing, write to FILE.
Backwards compatibility. The previous flat-flag interface (e.g.
-q,-Q,--httpd,--summary,--run-metrics,-e,--stdiod) is fully supported via an internal translation layer; existing scripts and integrations continue to work unchanged. Runtrace_processor --help-classicto see the full classic flag reference.
query — run SQL
Loads a trace, runs one or more ;-separated SQL statements, prints the
result to stdout, and exits. SQL can be supplied as an inline positional
argument, read from a file with -f/--query-file, or piped on stdin
(either by passing - to --query-file or by piping when no SQL was
specified):
# 1. Inline query.
trace_processor query trace.pftrace "SELECT ts, dur, name FROM slice LIMIT 5"

# 2. From a file.
trace_processor query -f queries.sql trace.pftrace

# 3. From stdin.
cat queries.sql | trace_processor query trace.pftrace
Useful flags:
-f, --query-file FILE— read SQL fromFILE(or-for stdin).-i, --interactive— drop into the interactive REPL after the queries finish.-W, --wide— double-width columns when printing results.--perf-file FILE— write trace-load and query timings toFILE.--structured-query-id ID+--summary-spec FILE(advanced) — execute a single structured query by ID from one or more TraceSummarySpec files. The spec(s) replace the inline/file/stdin SQL source.
interactive — REPL
Opens the same interactive PerfettoSQL prompt shown in the previous
section. This is the default subcommand when none is specified, so
trace_processor trace.pftrace and
trace_processor interactive trace.pftrace are equivalent. The only
subcommand-specific flag is -W, --wide.
server — HTTP / stdio RPC
Exposes trace processor over a remote-procedure-call protocol.
# HTTP server (used by ui.perfetto.dev). Listens on 9001 by default.
trace_processor server http

# Pre-load a trace and serve it over HTTP.
trace_processor server http trace.pftrace

# stdio server (length-prefixed RPC; used by tooling that embeds
# trace_processor as a subprocess).
trace_processor server stdio
Server-specific flags:
--port PORT— HTTP port (default 9001).--ip-address IP— HTTP bind address.--additional-cors-origins O1,O2,...— extra CORS-allowed origins on top of the defaults (https://ui.perfetto.dev,http://localhost:10000,http://127.0.0.1:10000).
The trace file is optional in http mode: clients can also load traces
remotely. The most common client is the Perfetto UI, which auto-detects a
local server and offloads trace parsing to it; see
Visualising large traces for the
end-user flow, or
trace_processor.proto
for the RPC wire schema.
summarize — trace summaries and v2 metrics
Computes a trace summary. Spec files are passed as
extra positional arguments after the trace file; built-in v2 metrics are
selected with --metrics-v2:
# Run all available v2 metrics.
trace_processor summarize --metrics-v2 all trace.pftrace

# Run two specific metric ids defined in spec.textproto.
trace_processor summarize \
  --metrics-v2 startup_metric,memory_metric \
  trace.pftrace spec.textproto
Subcommand flags:
--metrics-v2 IDS— comma-separated metric ids, or the literalall.--metadata-query ID— query id used to populate the summary'smetadatafield.--format text|binary— output format for theTraceSummaryproto (default:text).--post-query FILE— SQL file run after summarization. When set, the summary proto is not printed; the SQL output is printed instead.--perf-file FILE— write load/query timings toFILE.-i, --interactive— drop into the REPL after summarization finishes.
Spec files are auto-detected as binary or text based on extension
(.pb → binary, .textproto → text) with a content-sniffing fallback.
Global flags (apply to every subcommand)
These flags are accepted in addition to the subcommand-specific flags above and behave identically across subcommands:
- Trace ingestion:
--full-sort,--no-ftrace-raw,--analyze-trace-proto-content,--crop-track-events. - PerfettoSQL packages:
--add-sql-package PATH[@PKG],--override-sql-package PATH[@PKG],--override-stdlib PATH(requires--dev). - Metric extensions:
--metric-extension DISK_PATH@VIRTUAL_PATH. - Auxiliary file content:
--register-files-dir PATH— exposes the contents of files underPATHto importers (e.g. ETM decoders). - Development:
--dev,--dev-flag KEY=VALUE,--extra-checks. - Metatracing:
-m, --metatrace FILE,--metatrace-buffer-capacity N,--metatrace-categories CATEGORIES— produces a Perfetto trace of trace processor itself, which can be loaded back into the UI for performance debugging.
Embedding the C++ library
The public API is centered on the TraceProcessor class defined in
trace_processor.h. All
high-level operations — parsing trace bytes, executing SQL queries, computing
summaries — are member functions on this class.
A TraceProcessor instance is created via CreateInstance:
using namespace perfetto::trace_processor;
Config config;
std::unique_ptr<TraceProcessor> tp = TraceProcessor::CreateInstance(config);Loading a trace
To ingest a trace, call Parse repeatedly with chunks of trace bytes, then
NotifyEndOfFile once the entire trace has been pushed:
while (/* more data available */) {
  TraceBlobView blob = /* ... */;
  base::Status status = tp->Parse(std::move(blob));
  if (!status.ok()) { /* handle error */ }
}
base::Status status = tp->NotifyEndOfFile();
Because reading a trace from the filesystem is a common case, a helper
ReadTrace is provided in
read_trace.h:
base::Status status = ReadTrace(tp.get(), "/path/to/trace.pftrace");ReadTrace reads the file from disk, calls Parse with the contents, and
calls NotifyEndOfFile for you.
Executing queries
Queries are submitted via ExecuteQuery, which returns an Iterator that
streams rows back to the caller:
auto it = tp->ExecuteQuery("SELECT ts, name FROM slice LIMIT 10");
while (it.Next()) {
  int64_t ts = it.Get(0).AsLong();
  std::string name = it.Get(1).AsString();
  // ...
}
if (!it.Status().ok()) {
  // Query produced an error.
}
Two important rules when using the iterator:
- Always call
Nextbefore accessing values. The iterator is positioned before the first row when returned, soGetcannot be called untilNexthas returnedtrue. - Always check
Statusafter iteration finishes. A query may fail partway through;Nextreturningfalseonly means iteration stopped, not that it succeeded. InspectStatus()to distinguish EOF from an error.
See the comments in
iterator.h for the full
iterator API.
Other functionality
The TraceProcessor class also exposes:
- Trace summarization (
Summarize) — computes structured summaries of a trace. See Trace Summarization for the user-facing description of this feature. - Custom SQL packages (
RegisterSqlPackage) — registers PerfettoSQL files under a package name so they can beINCLUDEd by queries. - Out-of-band file content (
RegisterFileContent) — passes auxiliary data to importers, e.g. binaries used to decode ETM traces. - Metatracing (
EnableMetatrace/DisableAndReadMetatrace) — traces the Trace Processor itself for performance debugging.
Refer to the comments in
trace_processor.h for
the complete API surface.