
GPU
Perfetto supports tracing GPU activity across a range of use-cases, from Android mobile graphics to high-end multi-GPU compute workloads.
Data sources
The following data sources are available for GPU tracing:
| Data Source | Config | Purpose |
|---|---|---|
gpu.counters |
gpu_counter_config.proto | Periodic or instrumented GPU counter sampling |
gpu.renderstages |
gpu_renderstages_config.proto | GPU render stage and compute activity timeline |
vulkan.memory_tracker |
vulkan_memory_config.proto | Vulkan memory allocation and bind tracking |
gpu.log |
(none) | GPU debug log messages |
linux.ftrace |
ftrace_config.proto | GPU frequency, memory totals, DRM scheduler events |
GPU producers commonly register data sources with a hardware-specific suffix,
e.g. gpu.counters.adreno or gpu.renderstages.mali. The tracing service uses
exact name matching, so the trace config must use the same suffixed name. The
trace processor parses GPU data based on proto field types, so all suffixed
variants are handled identically. When targeting a specific GPU vendor's
producer, use the suffixed name in your trace config:
data_sources: {
    config {
        name: "gpu.counters"
        gpu_counter_config {
            counter_period_ns: 1000000
            counter_ids: 1
        }
    }
}
Traces include a gpu_id field to distinguish between GPUs and a machine_id
field to distinguish between machines in
multi-machine setups.
GPU hardware metadata (name, vendor, architecture, UUID, PCI BDF) is recorded
via the GpuInfo trace
packet.
Android
GPU frequency
GPU frequency is collected via ftrace:
data_sources: {
    config {
        name: "linux.ftrace"
        ftrace_config {
            ftrace_events: "power/gpu_frequency"
        }
    }
}
GPU counters
Android GPU producers must use counter descriptor mode 1: the
GpuCounterDescriptor is embedded directly in the first GpuCounterEvent
packet of the session, and counter IDs are global. This is required for
CDD/CTS compliance.
GPU counters are sampled by specifying device-specific counter IDs. The
available counter IDs are described in GpuCounterSpec in the data source
descriptor.
data_sources: {
    config {
        name: "gpu.counters"
        gpu_counter_config {
            counter_period_ns: 1000000
            counter_ids: 1
            counter_ids: 3
            counter_ids: 106
            counter_ids: 107
            counter_ids: 109
        }
    }
}
counter_period_ns sets the desired sampling interval.
Alternatively, counters can be selected by name using counter_names. Use one
or the other, not both. Not all producers support this — check
supports_counter_names in the GpuCounterDescriptor data source descriptor.
Glob patterns may be used in counter_names to match multiple counters by
name; check supports_counter_name_globs in the descriptor for support.
GPU memory
Total GPU memory usage per process is collected via ftrace:
data_sources: {
config {
name: "linux.ftrace"
ftrace_config {
ftrace_events: "gpu_mem/gpu_mem_total"
}
}
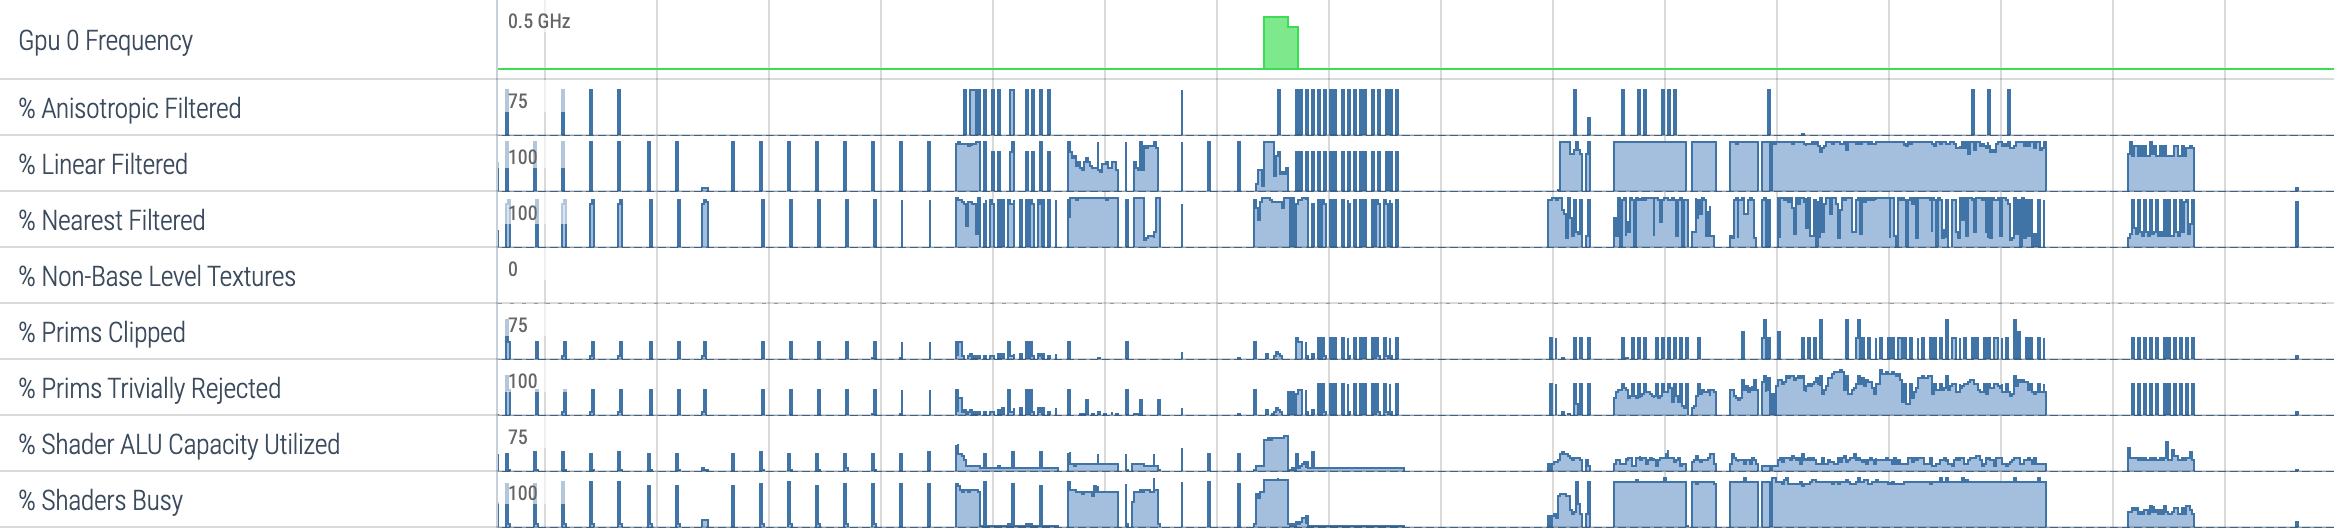
}GPU render stages
Render stage tracing provides a timeline of GPU activity (graphics and compute submissions):
data_sources: {
    config {
        name: "gpu.renderstages"
    }
}
Vulkan memory
Vulkan memory allocation and bind events can be tracked with:
data_sources: {
    config {
        name: "vulkan.memory_tracker"
        vulkan_memory_config {
            track_driver_memory_usage: true
            track_device_memory_usage: true
        }
    }
}
GPU log
GPU debug log messages can be collected by enabling the data source:
data_sources: {
    config {
        name: "gpu.log"
    }
}
High-end GPGPU
For high-performance and data-center GPU workloads (CUDA, OpenCL, HIP), Perfetto supports multi-GPU and multi-machine tracing with instrumented counter sampling.
Instrumented counter sampling
Instead of global sampling, counters can be sampled by instrumenting GPU command buffers. This provides per-submission counter values:
data_sources: {
    config {
        name: "gpu.counters"
        gpu_counter_config {
            counter_ids: 1
            counter_ids: 2
            instrumented_sampling: true
        }
    }
}
For more control over which GPU activities are instrumented, use
instrumented_sampling_config instead of the instrumented_sampling bool.
This enables a pipeline of filters applied in the following order:
Activity name filtering: If
activity_name_filtersis non-empty, the activity must match at least one filter. Each filter requires aname_globpattern and an optionalname_base(defaults toMANGLED_KERNEL_NAMEif not specified). If empty, all activities pass this step.TX range filtering: If
activity_tx_include_globsis non-empty, the activity must fall within a TX range (e.g. NVTX range for CUDA) matching one of the include globs. Activities in TX ranges matchingactivity_tx_exclude_globsare excluded (excludes take precedence over includes). TX ranges can be nested, and an activity matches if any range in its nesting hierarchy matches. If both are empty, all activities pass this step.Range-based sampling: If
activity_rangesis non-empty, only activities within the specified skip/count ranges are instrumented.skipdefaults to 0 andcountdefaults to UINT32_MAX (all remaining activities) when not specified. If empty, all activities that passed the previous steps are instrumented.
Example configuration that instruments only activities with demangled kernel
names matching "myKernel*" within TX ranges matching "training*",
skipping the first 10 matching activities and then instrumenting 5:
data_sources: {
    config {
        name: "gpu.counters"
        gpu_counter_config {
          counter_names: "sm__cycles_elapsed.avg"
          counter_names: "sm__cycles_active.avg"
          instrumented_sampling_config {
            activity_name_filters {
              name_glob: "myKernel*"
              name_base: DEMANGLED_KERNEL_NAME
            }
            activity_tx_include_globs: "training*"
            activity_ranges {
              skip: 10
              count: 5
            }
          }
        }
    }
}
Counter descriptor mode 2 is recommended for GPGPU use-cases: the producer
emits an InternedGpuCounterDescriptor referenced by IID, giving each
trusted sequence its own scoped counter IDs. This avoids the global
coordination required by mode 1 and supports multiple producers and GPUs
naturally. See
gpu_counter_event.proto
for details on both modes.
Counter names and IDs are advertised by the GPU producer via GpuCounterSpec in
the data source descriptor, which includes measurement units and descriptions.
Counter groups
Counter groups are used by the Perfetto UI to organize counter tracks into
groups. Counters can be assigned to built-in groups (SYSTEM, VERTICES,
FRAGMENTS, PRIMITIVES, MEMORY, COMPUTE, RAY_TRACING) via
GpuCounterSpec.groups. Producers can also define custom counter groups
using the GpuCounterGroupSpec message in GpuCounterDescriptor:
message GpuCounterGroupSpec {
    optional uint32 group_id = 1;
    optional string name = 2;
    optional string description = 3;
    repeated uint32 counter_ids = 4;
}
Custom groups can also be used to provide display names and descriptions for
the fixed GpuCounterGroup enum values (SYSTEM, VERTICES, etc.). To do this,
set group_id to the enum value and provide a name and/or description.
A counter's group membership is the union of groups assigned via
GpuCounterSpec.groups (the fixed enum) and GpuCounterGroupSpec.counter_ids
(custom groups).
For example, with custom groups "Compute Core" and "L2 Cache":
GPU > Counters > Compute Core > Counter A
GPU > Counters > Compute Core > Counter B
GPU > Counters > L2 Cache > Counter C
Multi-GPU
Each GPU in the system is assigned a gpu_id. Counter events, render stages,
and other GPU trace data carry this ID so the UI can group tracks per GPU. GPU
hardware details are recorded via the
GpuInfo message, which
includes:
name,vendor,model,architectureuuid(16-byte identifier)pci_bdf(PCI bus/device/function)
Multi-machine
When tracing across multiple machines, each GPU trace event also carries a
machine_id to distinguish which machine the GPU belongs to. The Perfetto UI
displays machine labels alongside GPU tracks.
Render stage event correlation
GPU render stage events can declare dependencies on other render stage events
using the event_wait_ids field on GpuRenderStageEvent. Each entry is the
event_id of another render stage event that this event had to wait on before
it could run. The trace processor uses these to create flow arrows between
the correlated GPU slices.
Example: a matmul kernel that depends on a previous asynchronous memcpy:
gpu_render_stage_event {
    event_id: 1
    duration: 50000
    hw_queue_iid: 1
    stage_iid: 2
    context: 0
    name: "Memcpy HtoD"
}

gpu_render_stage_event {
    event_id: 2
    duration: 40000
    hw_queue_iid: 3
    stage_iid: 4
    context: 0
    name: "matmul_kernel"
    event_wait_ids: 1
}
This creates a flow from the memcpy event (event_id 1) to the matmul kernel (event_id 2), visualizing the dependency in the Perfetto UI.
Host-to-GPU correlation
Host-side track events can be correlated with GPU render stage events using
the GpuCorrelation TrackEvent extension. This is useful for connecting
host API calls (e.g. cudaLaunchKernel, cudaMemcpyAsync) with the
corresponding GPU work.
The extension provides two fields:
render_stage_submission_event_ids: event IDs of GPU render stage events that this host event submitted.render_stage_wait_event_ids: event IDs of GPU render stage events that this host event waited on to complete.
Example: a host kernel launch correlated with a GPU compute kernel:
track_event {
    type: TYPE_SLICE_BEGIN
    name: "cudaLaunchKernel"
    [perfetto.protos.GpuTrackEvent.gpu_correlation] {
        render_stage_submission_event_ids: 1
    }
}

gpu_render_stage_event {
    event_id: 1
    duration: 50000
    hw_queue_iid: 1
    stage_iid: 2
    context: 0
    name: "matmul_kernel"
}
UI plugins
The Perfetto UI ships several plugins that consume GPU trace data. They
register tracks, groups, and detail panes under the standard GPU group in
the workspace tree (and, for per-process plugins, under each process group).
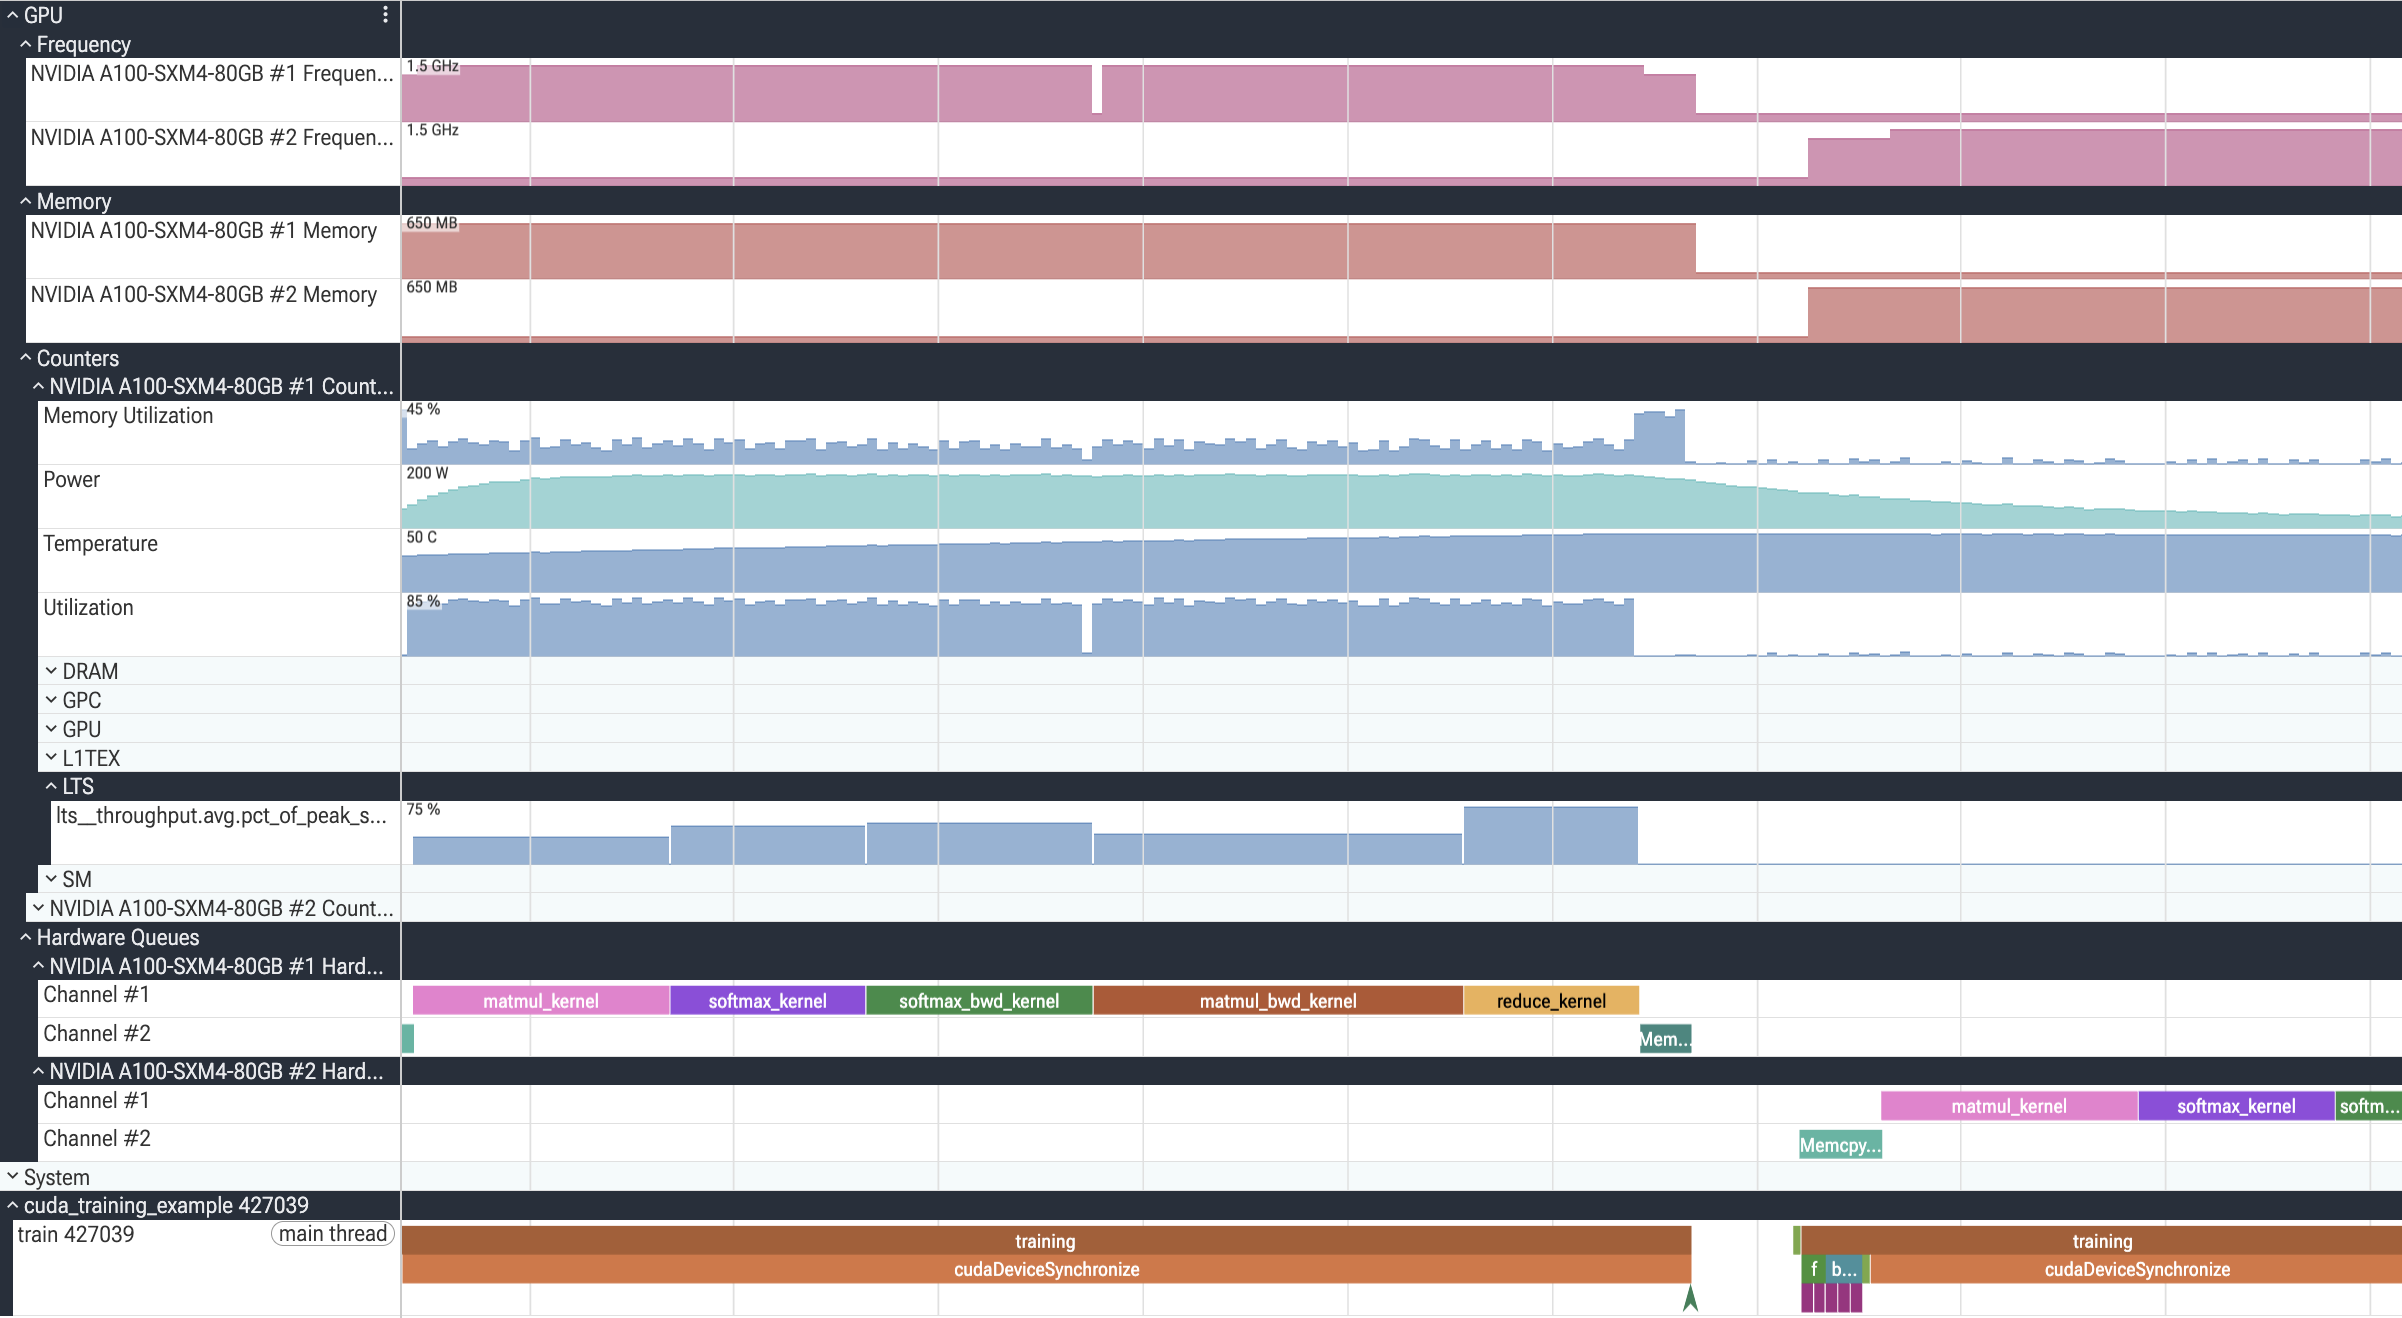
dev.perfetto.Gpu
The base plugin that lays out a GPU group per GPU and populates it with
the leaf and summary tracks for everything in the gpu_counter_track,
gpu_render_stage, gpu_log, vulkan_events, and graphics_frame_event
families. Multi-GPU and multi-machine traces are split into per-GPU
sub-groups (with machine labels appended when more than one machine is
present); custom counter groups declared in GpuCounterDescriptor /
GpuCounterGroupSpec show up as collapsible sub-groups under Counters.
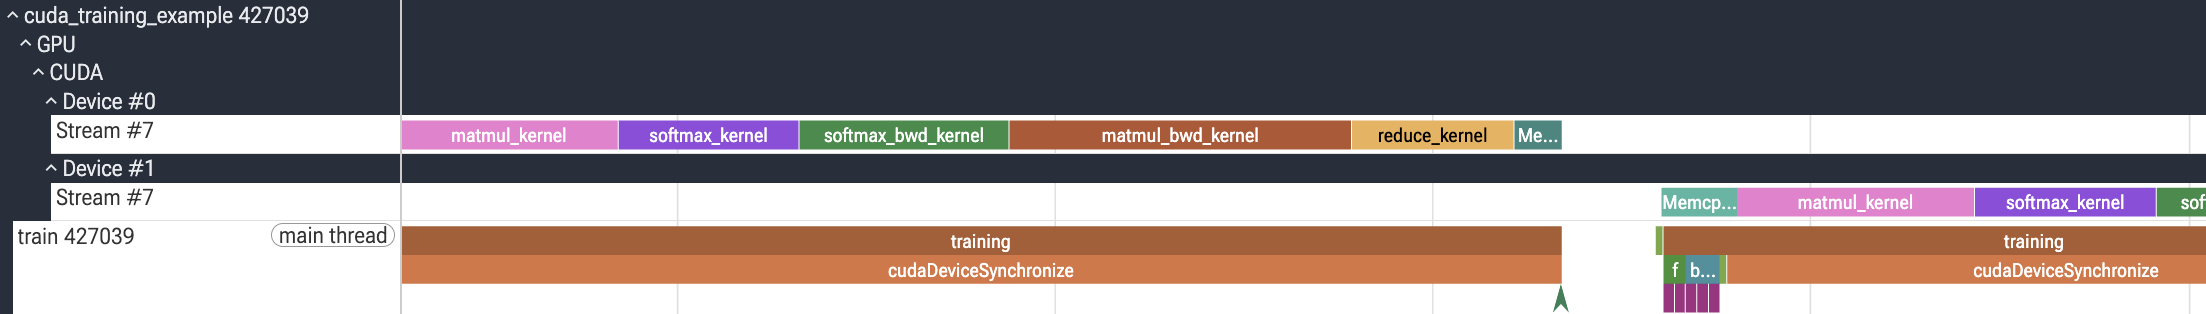
dev.perfetto.GpuByProcess
Surfaces GPU concepts that are scoped to a single process and don't have a
meaningful global representation. A CUDA stream, for example, is a
per-process handle: the same numeric stream ID in two different processes
refers to two unrelated streams, so showing all streams under a single
shared GPU group would be misleading. This plugin places those tracks
under each owning process instead.
For traces whose GPU slices carry device and stream launch args (e.g.
CUDA, HIP), it nests gpu_render_stage slices under each process as
<API> → Device #N → Context #N → Stream #N, collapsing any level that
only has a single value. Slices that don't carry those args fall back to
one track per hw_queue_id, named after the source hardware-queue track
(typically "Channel #N"). When a process spans multiple GPUs the leaf
tracks are nested under per-GPU sub-groups.
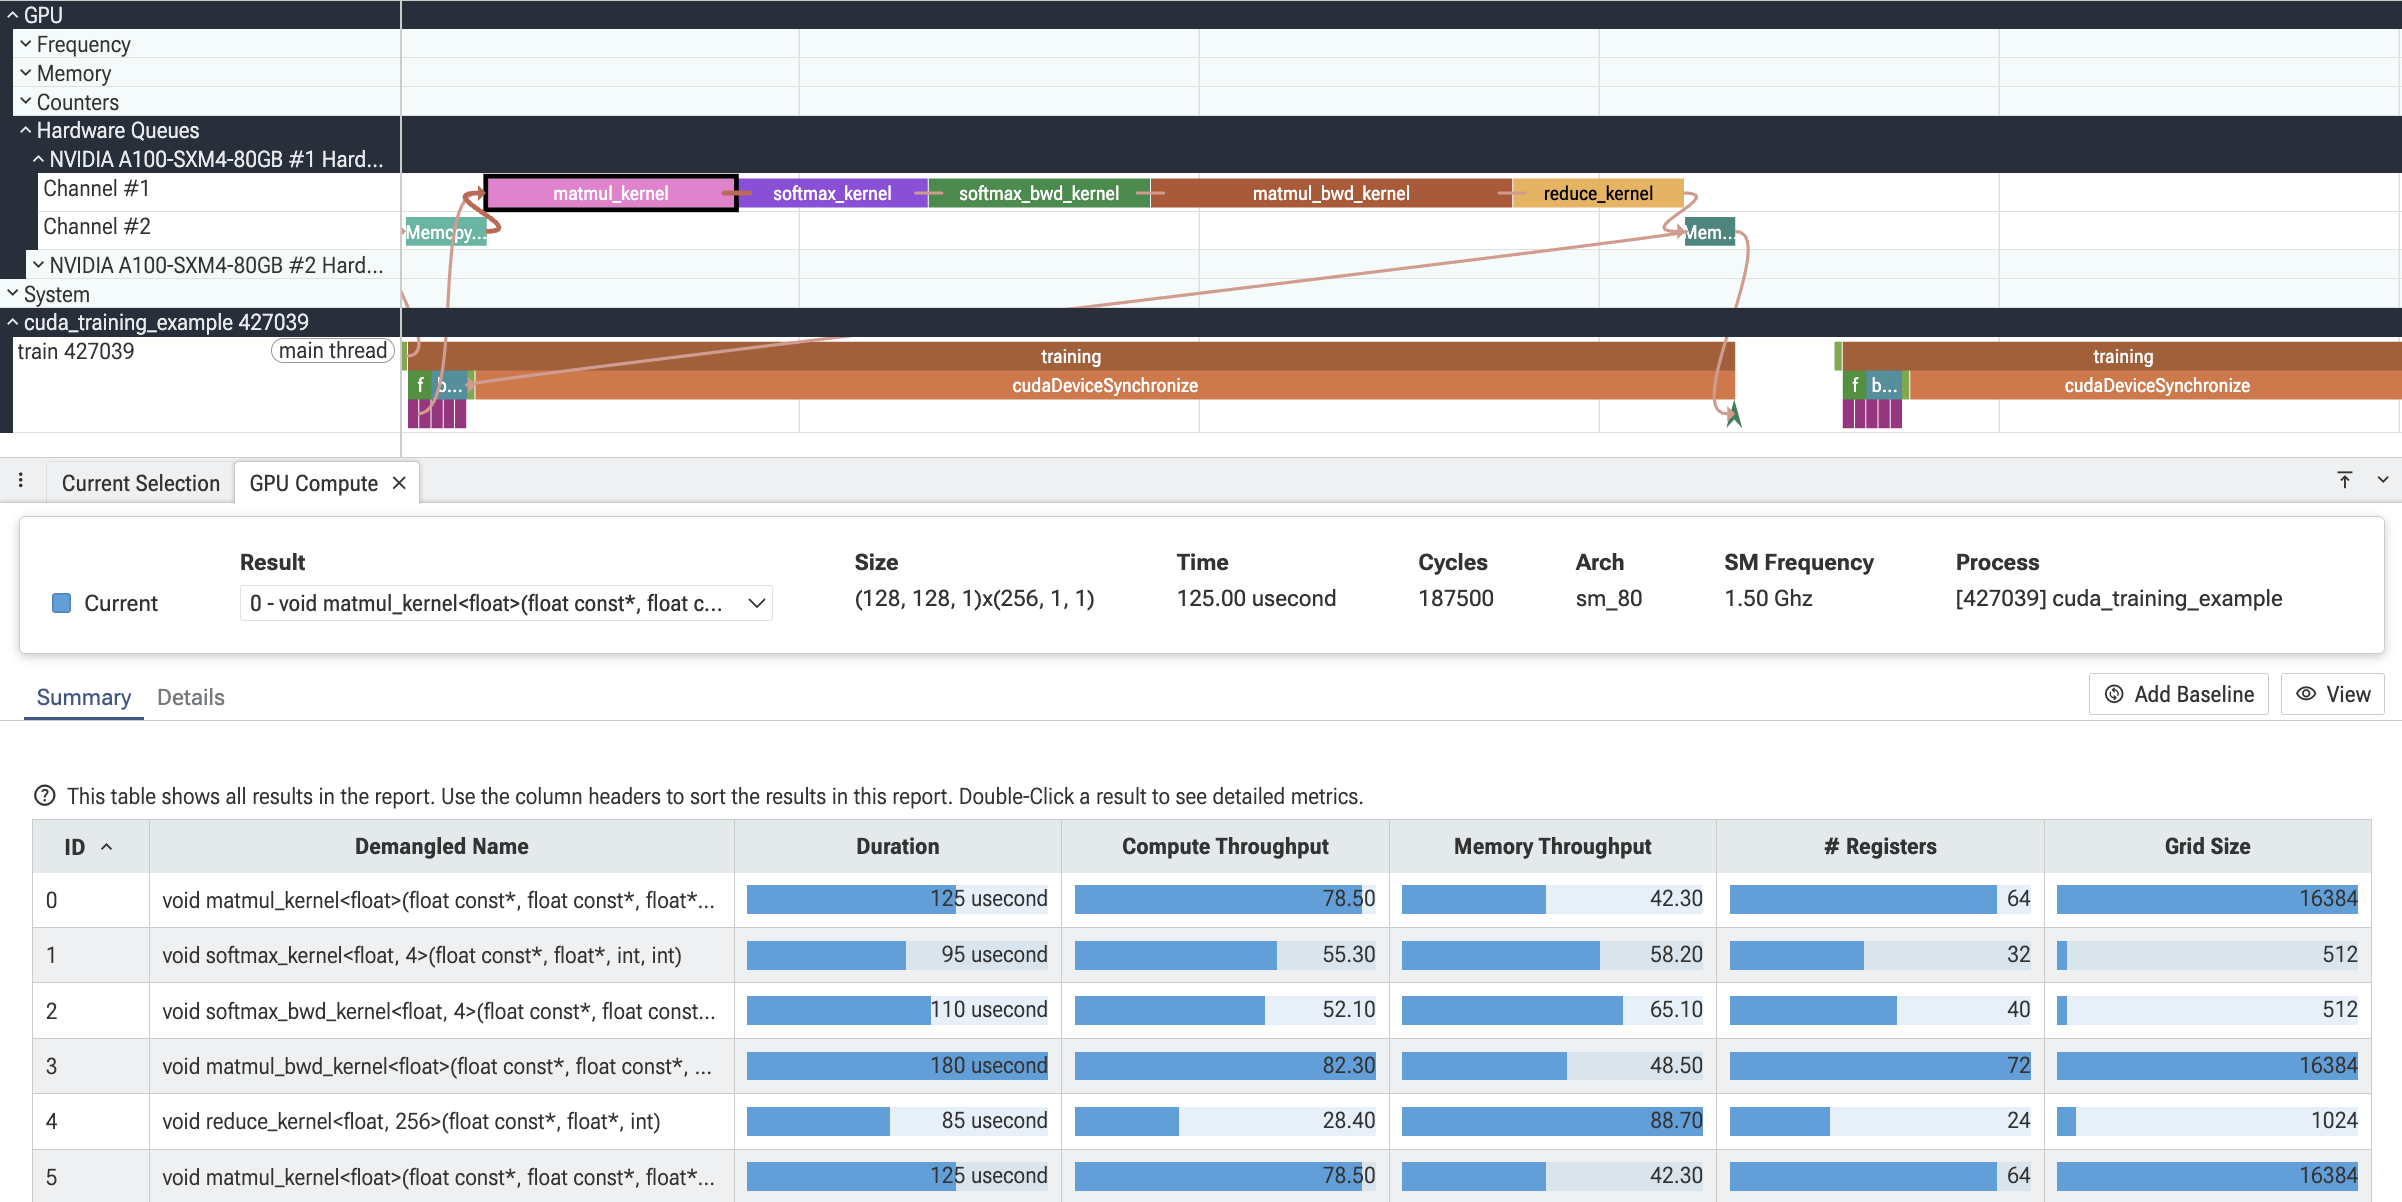
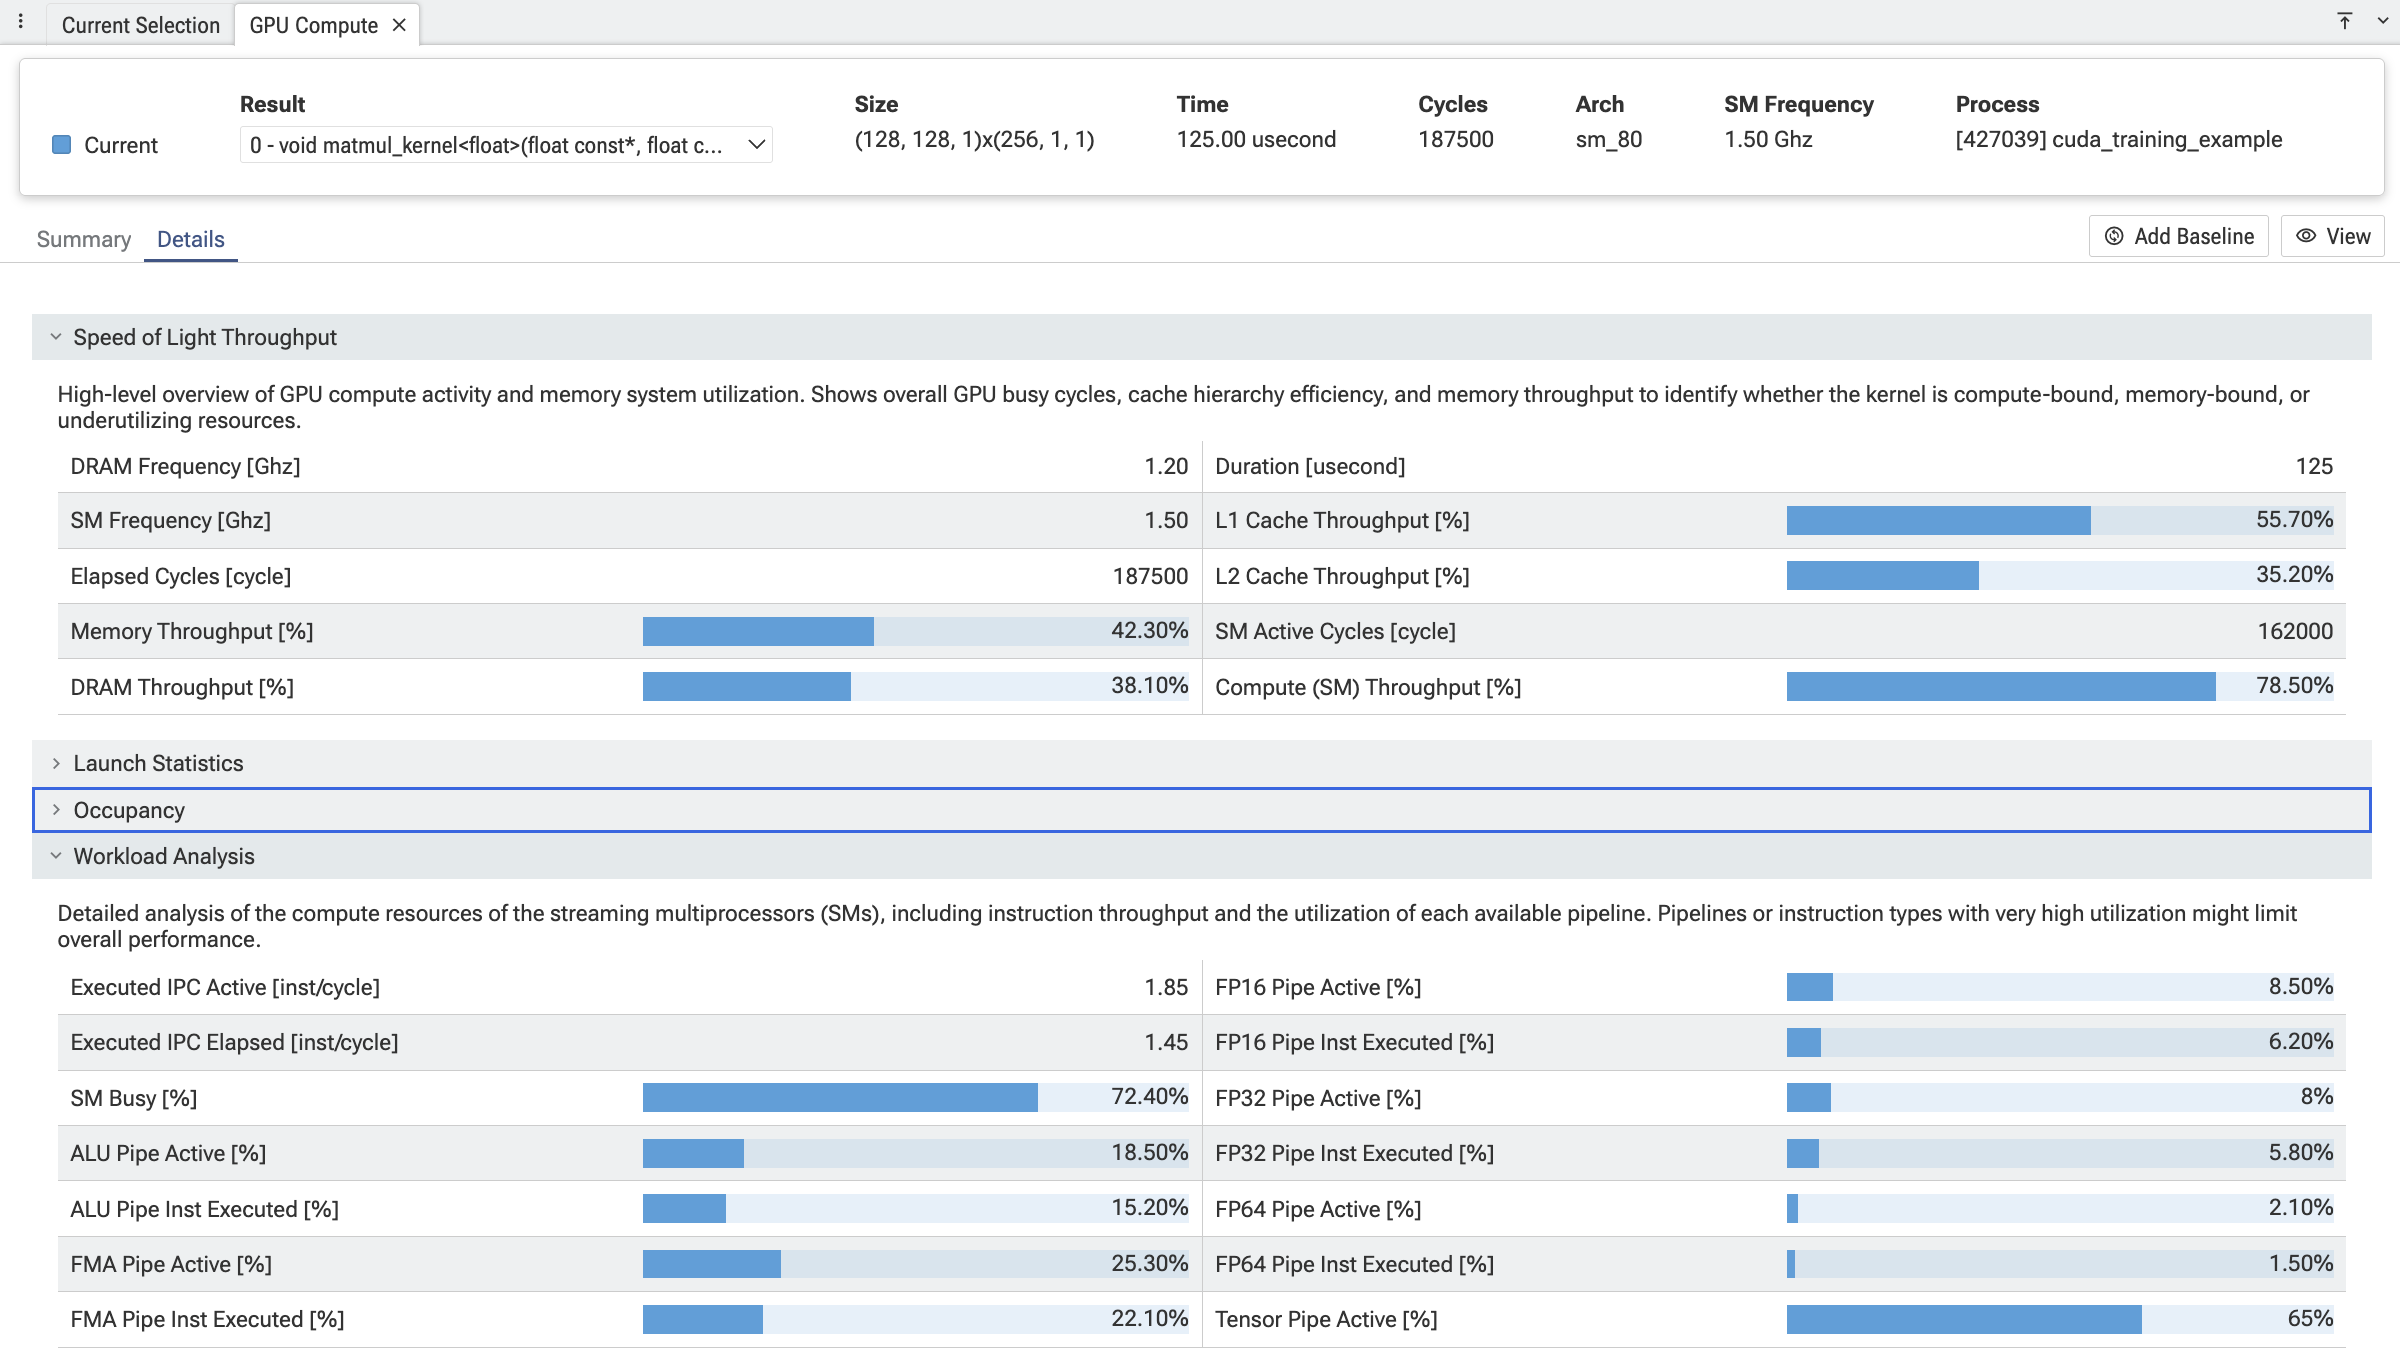
com.meta.GpuCompute
Compute-kernel deep dive. Adds three tabs that are populated whenever a
compute gpu_render_stage slice (i.e. gpu_slice.render_stage_category = COMPUTE) is selected:
- Summary — table of every kernel launch in the trace, sortable by duration, occupancy, and other hardware metrics. Double-click jumps to the details view for that kernel.
- Details — per-section metric tables (Speed-of-Light, Launch Statistics, Occupancy, Workload Analysis), with optional baseline comparison between two kernels.
- Toolbar — kernel selector, baseline pin, terminology switch (CUDA / OpenCL / vendor-supplied), and automatic unit conversion (bytes → KB, ns → s, etc.).
The core plugin ships CUDA and AMD support; additional vendors are added by companion plugins that register terminologies, metric sections, well-known metric IDs, and analysis providers. See com.meta.GpuCompute/README.md for the extension API.
Example queries
Top 5 longest-running kernels with time-weighted utilization
This query ranks compute kernels by duration and, for each one, computes
the time-weighted average of the GPU Utilization counter over the
kernel's execution window. counter_leading_intervals turns the sparse
counter samples into (ts, dur, value) intervals (each sample's value
holds until the next sample), and _interval_intersect clips those
intervals against each kernel's [ts, ts + dur) window so the average is
weighted by how long each counter value was actually in effect during the
kernel.
INCLUDE PERFETTO MODULE counters.intervals;
INCLUDE PERFETTO MODULE intervals.intersect;

WITH
  -- The GPU Utilization counter, expanded into (ts, dur, value) intervals.
  -- Carries ugpu so the intersect can match each kernel to its own GPU.
  utilization AS (
    SELECT u.id, u.ts, u.dur, u.value, gct.ugpu
    FROM counter_leading_intervals!((
      SELECT c.id, c.ts, c.track_id, c.value
      FROM counter c
      JOIN gpu_counter_track gct ON gct.id = c.track_id
      WHERE gct.name = 'Utilization'
    )) u
    JOIN gpu_counter_track gct ON gct.id = u.track_id
  ),
  -- The 5 longest compute kernels (render_stage_category 2 = COMPUTE).
  top_kernels AS (
    SELECT
      s.id, s.ts, s.dur, s.name,
      extract_arg(t.dimension_arg_set_id, 'ugpu') AS ugpu
    FROM gpu_slice s
    JOIN gpu_track t ON s.track_id = t.id
    WHERE s.render_stage_category = 2 AND s.dur > 0
    ORDER BY s.dur DESC
    LIMIT 5
  )
SELECT
  k.name AS kernel,
  g.name AS gpu_name,
  k.dur AS dur_ns,
  -- Time-weighted average: sum(value * overlap_dur) / kernel_dur.
  SUM(u.value * ii.dur) / k.dur AS avg_utilization
FROM top_kernels k
LEFT JOIN gpu g ON g.id = k.ugpu
JOIN _interval_intersect!((top_kernels, utilization), (ugpu)) ii
  ON ii.id_0 = k.id
JOIN utilization u ON u.id = ii.id_1
GROUP BY k.id, k.name, g.name, k.dur
ORDER BY k.dur DESC;
Example output (two-GPU training trace):
| kernel | gpu_name | dur_ns | avg_utilization |
|---|---|---|---|
| matmul_bwd_kernel | NVIDIA A100-SXM4-80GB #1 | 180000 | 78.27 |
| matmul_bwd_kernel | NVIDIA A100-SXM4-80GB #2 | 180000 | 77.25 |
| matmul_kernel | NVIDIA A100-SXM4-80GB #1 | 125000 | 78.70 |
| matmul_kernel | NVIDIA A100-SXM4-80GB #2 | 125000 | 78.83 |
| softmax_bwd_kernel | NVIDIA A100-SXM4-80GB #1 | 110000 | 73.76 |