
Profiling memory usage and allocations with Perfetto
In this guide, you'll learn how to:
- Understand the different memory profiling modes and when to use them.
- Record native and ART (Java/Kotlin) heap profiles with Perfetto.
- Visualize and analyze allocation profiles in the Perfetto UI.
The memory use of a process plays a key role in the performance of processes and impact on overall system stability. Understanding where and how your process is using memory can give significant insight to understand why your process may be running slower than you expect or just help make your program more efficient.
When it comes to apps and memory, there are mainly two ways a process can use memory:
Native C/C++/Rust code: typically allocate memory via libc's malloc/free (or wrappers on top of it like C++'s new/delete). Note that native allocations are still possible (and quite frequent) when using Java APIs that are backed by JNI counterparts. A canonical example is
java.util.regex.Patternwhich typically owns both managed memory on the Java heap and native memory due to the underlying use of native regex libraries.Java/KT code: a good portion of the memory footprint of an app lives in the managed heap (in the case of Android, managed by ART's garbage collector). This is where every
new X()object lives.
Perfetto offers multiple complementary techniques for debugging the above:
| Tool | Language | What is instrumented | Usage |
|---|---|---|---|
| ART Heap Dumps | Java/Kotlin | Reference graph of all allocated objects | Breakdown memory usage, and find leaks. |
| Native Allocation Profiling | Native C/C++/Rust | malloc + free |
Reduce native allocation churn, breakdown memory usage and find leaks after profiling started. |
| ART Allocation Profiling | Java/Kotlin | Object allocations | Reduce Java/Kotlin allocation churn |
Native (C/C++/Rust) Allocation Profiling (aka native heap profiling)
Native languages like C/C++/Rust commonly allocate and deallocate memory at the
lowest level by using the libc family of malloc/free functions. Native heap
profiling works by intercepting calls to these functions and injecting code
which keeps track of the callstack of memory allocated but not freed. This
allows to keep track of the "code origin" of each allocation. malloc/free can be
perf-hotspots in heap-heavy processes: in order to mitigate the overhead of the
memory profiler we support sampling to
trade-off accuracy and overhead.
NOTE: native heap profiling with Perfetto only works on Android and Linux; this is due to the techniques we use to intercept malloc and free only working on these operating systems.
A very important point to note is that heap profiling is not retroactive. It can only report allocations that happen after tracing has started. It cannot provide any insight into allocations that occurred before the trace began. If you need to analyze memory usage from the start of a process, you must begin tracing before the process is launched.
If your question is "why is this process so big right now?" you cannot use heap profiling to answer questions about what happened in the past. However our anecdotal experience is that if you are chasing a memory leak, there is a good chance that the leak will keep happening over time and hence you will be able to see future increments.
Collecting your first Native Allocation Profile
On Android Perfetto heap profiling hooks are seamlessly integrated into the libc implementation.
Prerequisites
- A device running Android 10+.
- A Profileable or Debuggable app. If you are running on a "user" build of Android (as opposed to "userdebug" or "eng"), your app needs to be marked as profileable or debuggable in its manifest. See the heapprofd documentation for more details.
Instructions
- Open https://ui.perfetto.dev/#!/record
- Select Android as target device and use one of the available transports. If in doubt, WebUSB is the easiest choice.
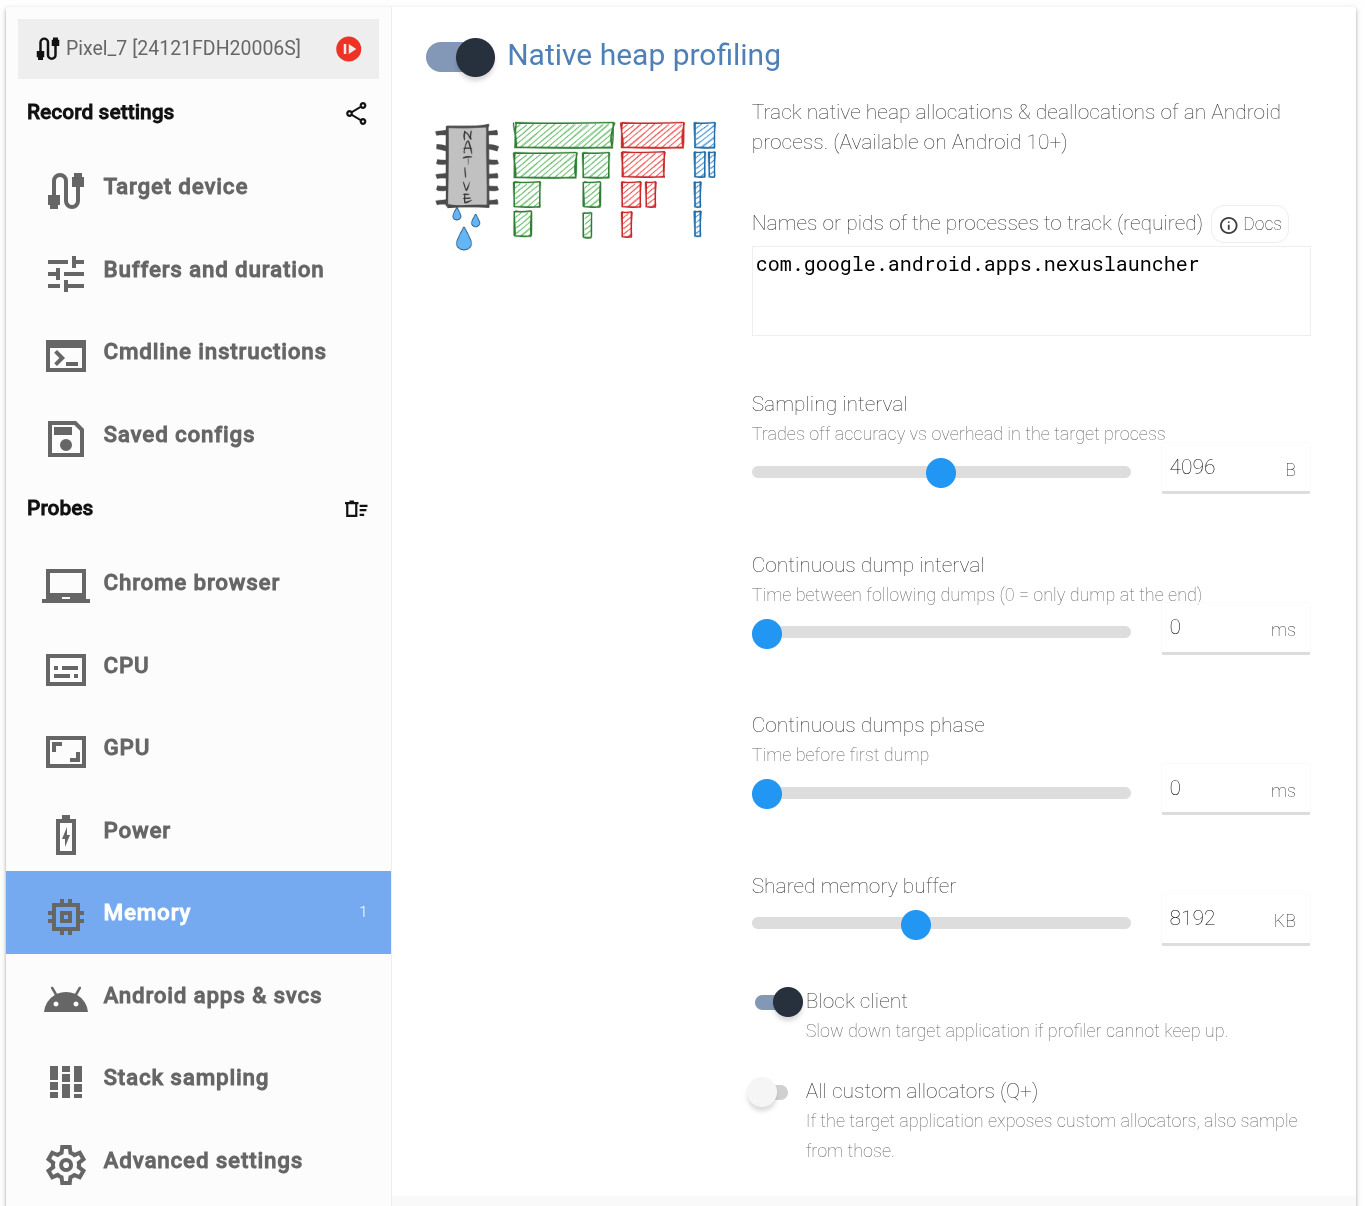
- Click on the
Memoryprobe on the left and then toggle theNative heap profilingoption. - Enter the process name in the
Namesbox. - The process name you have to enter is (the first argument of the) the process
cmdline. That is the right-most column (NAME) of
adb shell ps -A. - Select an observation time in the
Buffers and durationpage. This will determine for how long the profile will intercept malloc/free calls. - Press the red button to start recording the trace.
- While the trace is being recorded, interact with the process being profiled. Run your user journey, test patterns, interact with your app.
On Android Perfetto native heap profiling hooks are seamlessly integrated into the libc implementation.
Prerequisites
- ADB installed.
- Windows users: Make sure that the downloaded adb.exe is in the PATH.
set PATH=%PATH%;%USERPROFILE%\Downloads\platform-tools - A device running Android 10+.
- A Profileable or Debuggable app. If you are running on a "user" build of Android (as opposed to "userdebug" or "eng"), your app needs to be marked as profileable or debuggable in its manifest. See the heapprofd documentation for more details.
Instructions
$ adb devices -l
List of devices attached
24121FDH20006S         device usb:2-2.4.2 product:panther model:Pixel_7 device:panther transport_id:1
If more than one device or emulator is reported you must select one upfront as follows:
export ANDROID_SERIAL=24121FDH20006SDownload the tools/heap_profile (if you don't have a perfetto checkout):
curl -LO https://raw.githubusercontent.com/google/perfetto/main/tools/heap_profileThen start the profile using the android subcommand:
python3 heap_profile android -n com.google.android.apps.nexuslauncherThe bare invocation (python3 heap_profile -n ...) still works and is
equivalent to the android subcommand - it is kept for backwards
compatibility. New scripts should use the explicit subcommand form.
Run your test patterns, interact with the process and press Ctrl-C when done
(or pass -d 10000 for a time-limited profiling)
When you press Ctrl-C the heap_profile script will pull the traces and store them in /tmp/heap_profile-latest. Look for the message that says
Wrote profiles to /tmp/53dace (symlink /tmp/heap_profile-latest)
The raw-trace file can be viewed using https://ui.perfetto.dev
Prerequisites
- A Linux machine on x86_64, ARM, or ARM64.
Instructions
Download the heap_profile script:
curl -LO https://raw.githubusercontent.com/google/perfetto/main/tools/heap_profile
chmod +x heap_profile
Then run the host subcommand, passing the binary you want to profile after
--:
./heap_profile host -- ./my_binary --some-flagThe script:
- Auto-downloads
traceboxandlibheapprofd_glibc_preload.sointo~/.local/share/perfetto/prebuilts/on first run. - Starts a bundled
traceddaemon and opens a tracing session. - Launches your binary with
LD_PRELOADset to the preload library andPERFETTO_HEAPPROFD_BLOCKING_INIT=1. heapprofd would otherwise initialize lazily and miss startup allocations; this env var blocks the firstmallocuntil it has attached, so every allocation is captured.
When your binary exits (or you press Ctrl-C to stop early) the script
runs traceconv to produce gzipped pprof files alongside the raw trace and
prints the output directory. A typical end-to-end run looks like this:
$ ./heap_profile host -- ./my_binary
[762.189] ctory_standalone.cc:161 Child disconnected.
[762.190] approfd_producer.cc:580 Stopping data source 1
[762.190] pprofd_producer.cc:1230 1752951 disconnected from heapprofd (ds shutting down: 1).
[762.190] approfd_producer.cc:346 Shutting down child heapprofd (status 0).
Waiting for profiler shutdown...
Wrote profiles to /tmp/f8f102 (symlink /tmp/heap_profile-latest)
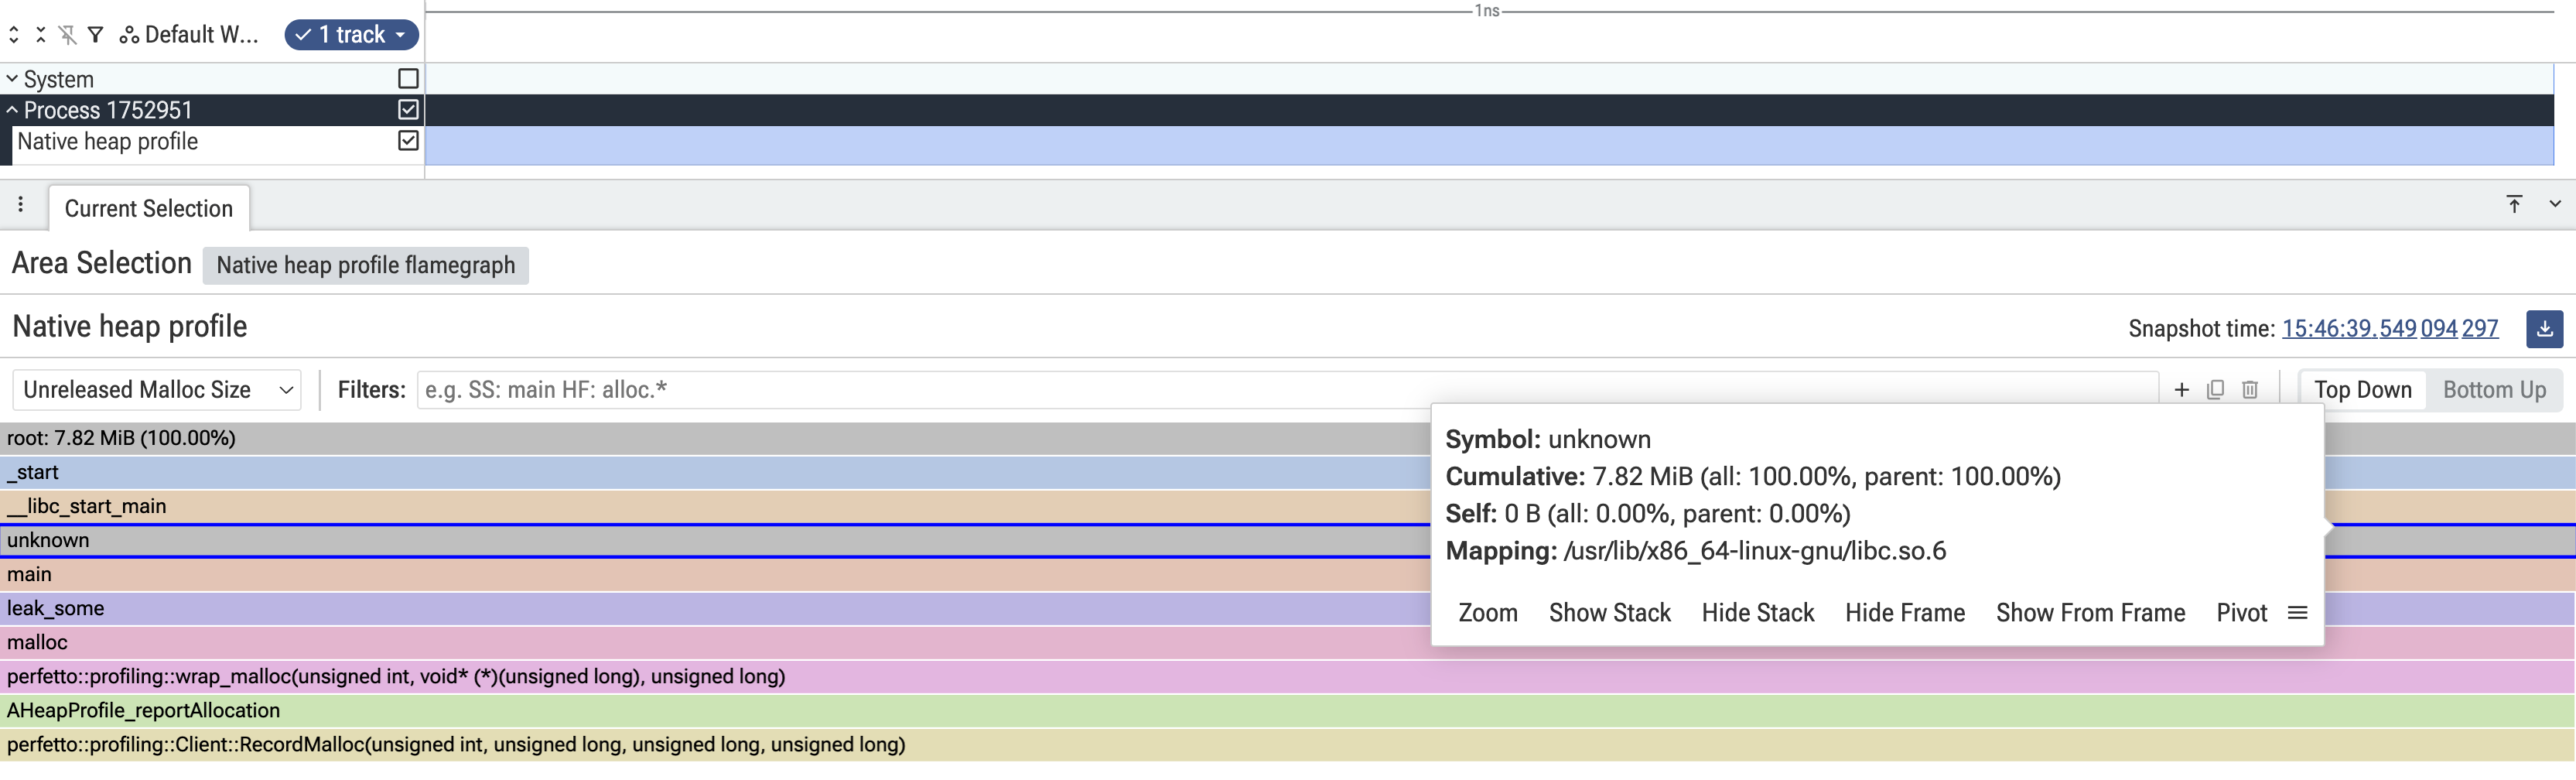
The raw-trace and heap_dump.* (pprof) files can be visualized with https://ui.perfetto.dev.The output directory contains a raw-trace file (the binary Perfetto trace)
and one heap_dump.*.pb.gz file per registered heap. Upload raw-trace to
the Perfetto UI and click the chevron on the
"Native heap profile" track to get a flamegraph identical in shape to the
Android flow described below:
If -n / --name is omitted, the process name defaults to the basename of
the binary you passed after --.
To override the auto-downloaded preload library with a local build, build
heapprofd_glibc_preload from a Perfetto checkout and pass its path via
--preload-library:
tools/ninja -C out/linux_clang_release heapprofd_glibc_preload
./heap_profile host \
  --preload-library out/linux_clang_release/libheapprofd_glibc_preload.so \
  -- ./my_binary --some-flag
See (non-Android) Linux support for more details.
Visualizing your first heap profile
Open the /tmp/heap_profile-latest file in the
Perfetto UI and click on the slice in the UI
track labeled "Native heap profile".

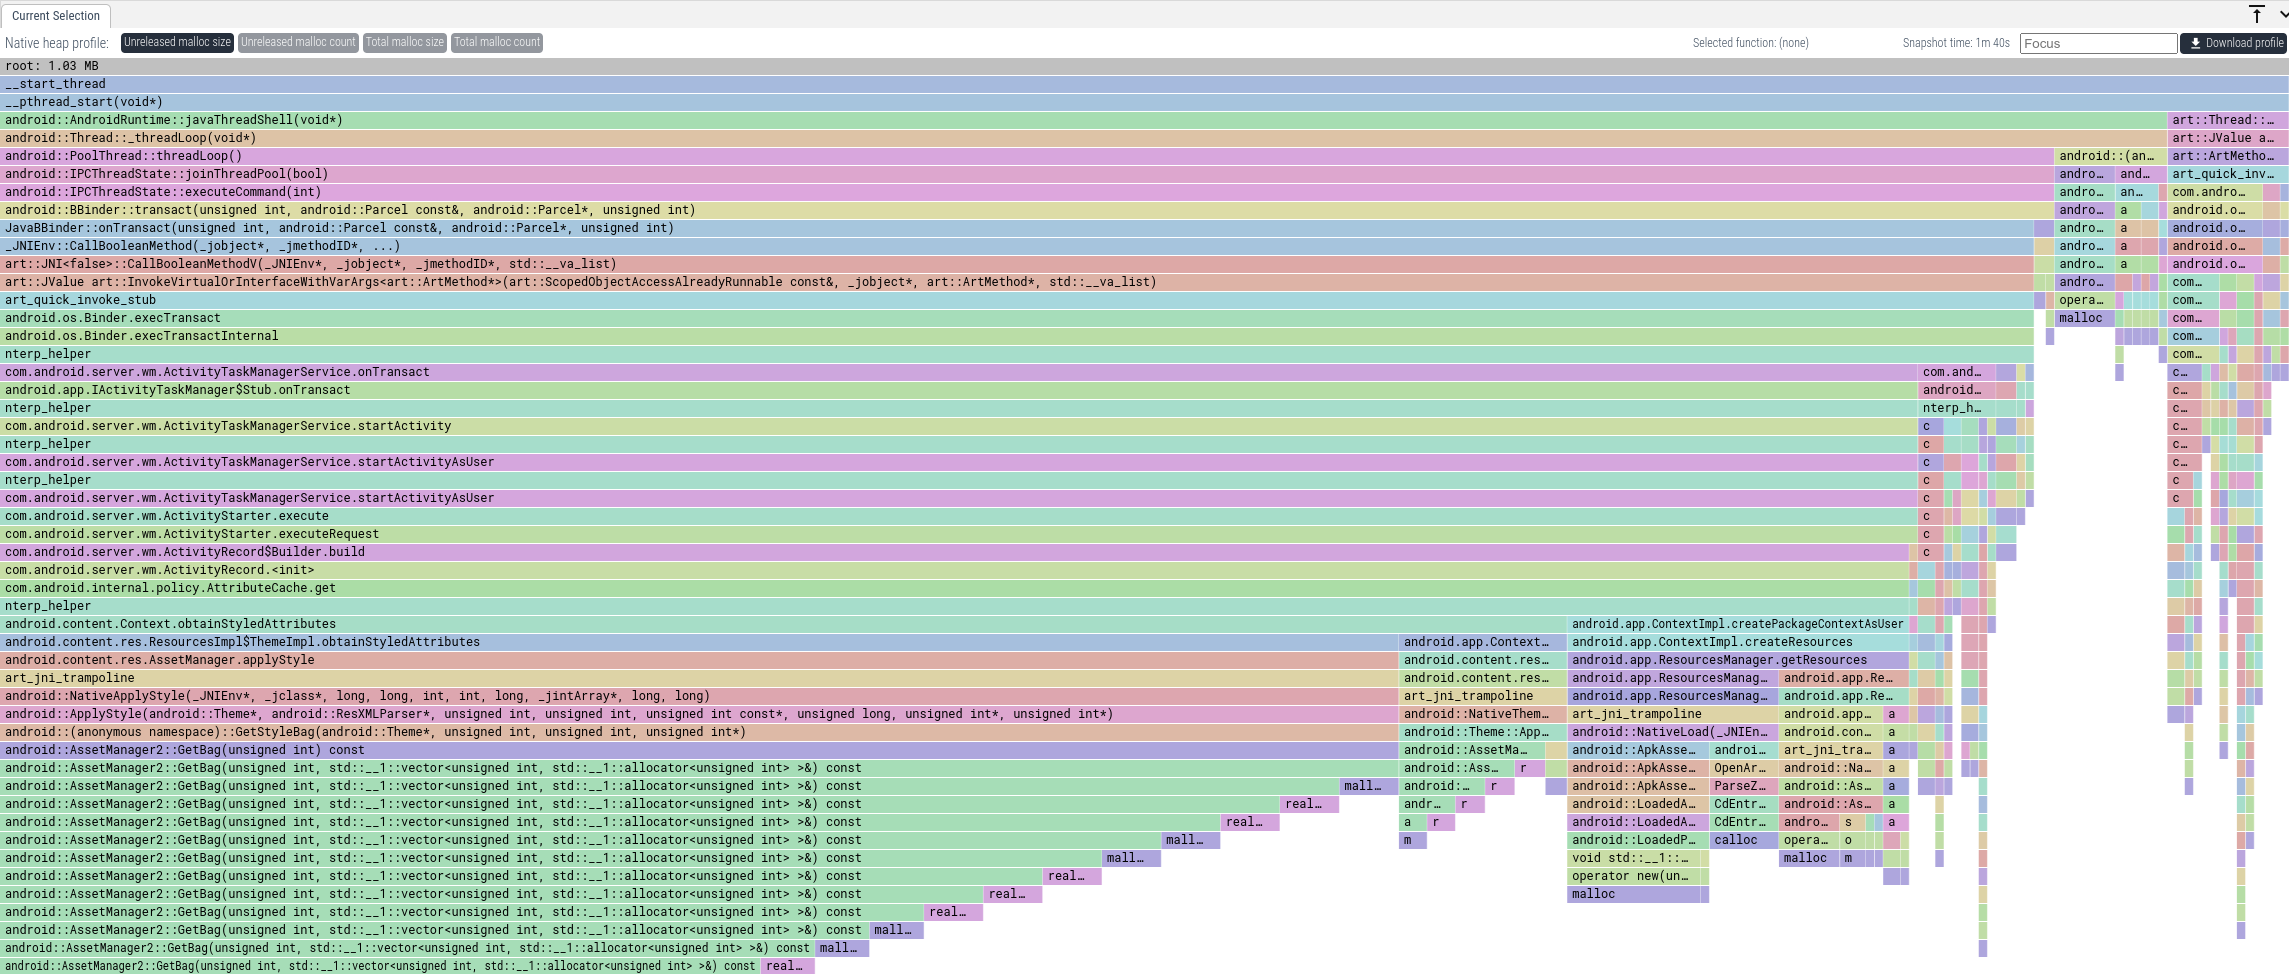
The aggregated flamegraph by default shows unreleased memory (i.e. memory that
has not been free()d) aggregated by call stack. The frames at the top represent
the earliest entrypoint in your call stack (typically main() or
pthread_start()). As you go towards the bottom, you'll get closer to the
frames that ultimately invoked malloc().
You can also change the aggregation to the following modes:
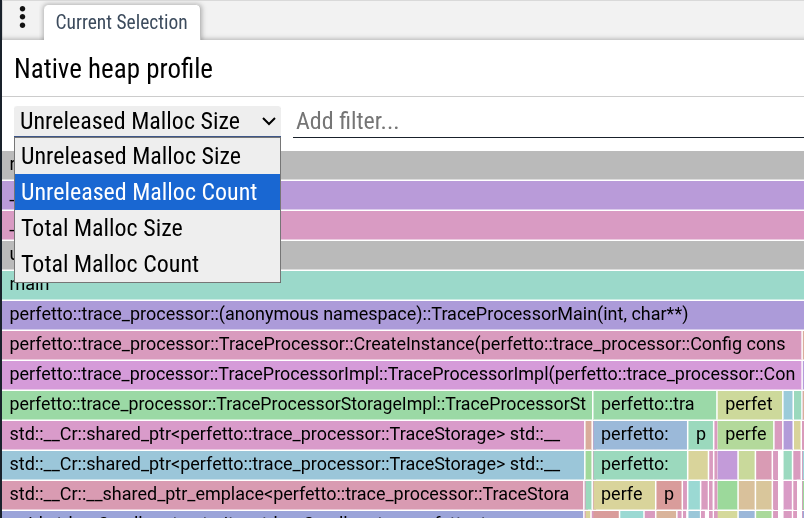
- Unreleased Malloc Size: the default mode and aggregates callstacks by SUM(non-freed memory bytes).
- Unreleased Malloc Count: aggregates un-freed allocations by count, ignoring the size of each allocation. This can be useful to spot leaks of small size, where each object is small, but a large number of them accumulates over time.
- Total Malloc Size: aggregates callstack by bytes allocated via malloc(), whether they have been freed or not. This is helpful to investigate heap churn, code paths that create a lot of pressure on the allocator, even though they release memory in the end.
- Total Malloc Count: like the above, but aggregates by number of calls to
malloc()and ignores the size of each allocation.
Querying your first heap profile
As well as visualizing traces on a timeline, Perfetto has support for querying traces using SQL. The easiest way to do this is using the query engine available directly in the UI.
In the Perfetto UI, click on the "Query (SQL)" tab in the left-hand menu.
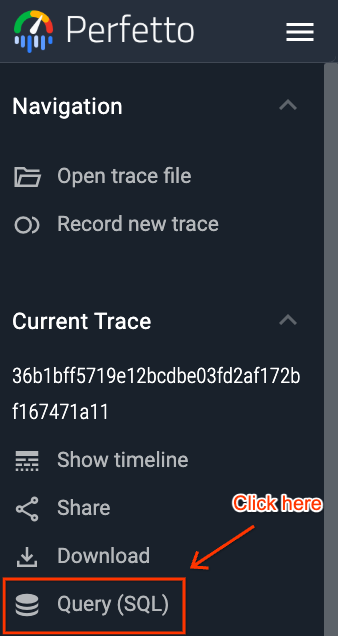
This will open a two-part window. You can write your PerfettoSQL query in the top section and view the results in the bottom section.
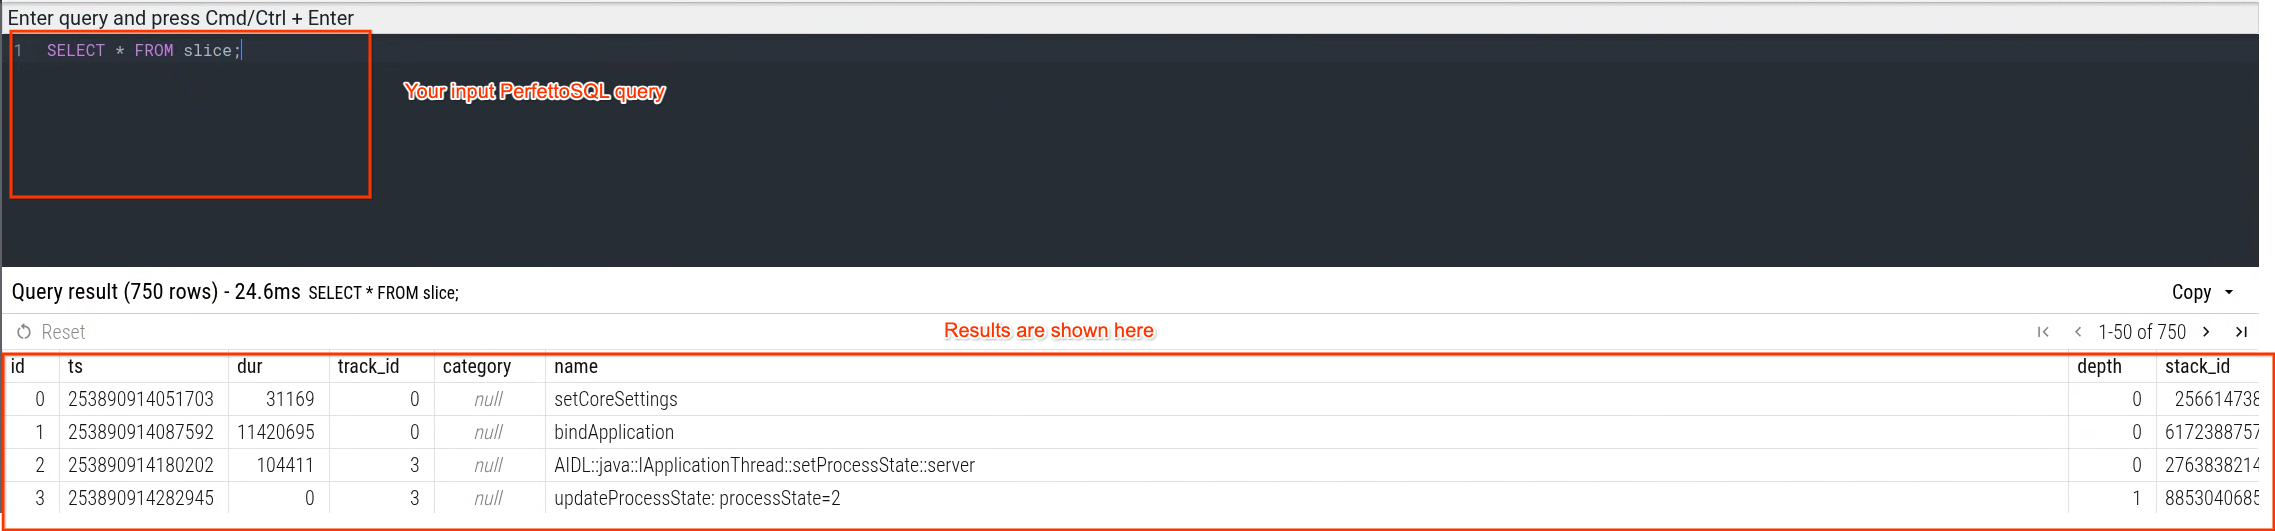
You can then execute queries Ctrl/Cmd + Enter:
For example, by running:
INCLUDE PERFETTO MODULE android.memory.heap_graph.heap_graph_class_aggregation;

SELECT
  -- Class name (deobfuscated if available)
  type_name,
  -- Count of class instances
  obj_count,
  -- Size of class instances
  size_bytes,
  -- Native size of class instances
  native_size_bytes,
  -- Count of reachable class instances
  reachable_obj_count,
  -- Size of reachable class instances
  reachable_size_bytes,
  -- Native size of reachable class instances
  reachable_native_size_bytes
FROM android_heap_graph_class_aggregation;
you can see a summary of the reachable aggregate object sizes and object counts.
ART Heap Dumps
Java—and managed languages built on top of it, like Kotlin—use a runtime environment to handle memory management and garbage collection. In these languages, (almost) every object is a heap allocation. Memory is managed through object references: objects retain other objects, and memory is automatically reclaimed by the garbage collector once objects become unreachable. There is no free() call as in manual memory management.
As a result, most profiling tools for the heap of a managed languages work by capturing and analyzing a complete heap dump, which includes all live objects and their retaining relationships—a full object graph.
This approach has the advantage of retroactive analysis: it provides a consistent snapshot of the entire heap without requiring prior instrumentation. However, it comes with a trade-off: while you can see which objects are keeping others alive, you typically cannot see the exact call sites where those objects were allocated. This can make it harder to reason about memory usage, especially when the same type of object is allocated from multiple locations in the code.
NOTE: ART heap dumps with Perfetto only works on Android. This is due to the deep integration with the JVM (Android Runtime - ART) required to efficiently capture a heap dump without impacting the performance of the process.
Collecting your first heap dump
On Android Perfetto heap profiling hooks are seamlessly integrated into the libc implementation.
Prerequisites
- A device running Android 10+.
- A Profileable or Debuggable app. If you are running on a "user" build of Android (as opposed to "userdebug" or "eng"), your app needs to be marked as profileable or debuggable in its manifest.
Instructions
- Open https://ui.perfetto.dev/#!/record
- Select Android as target device and use one of the available transports. If in doubt, WebUSB is the easiest choice.
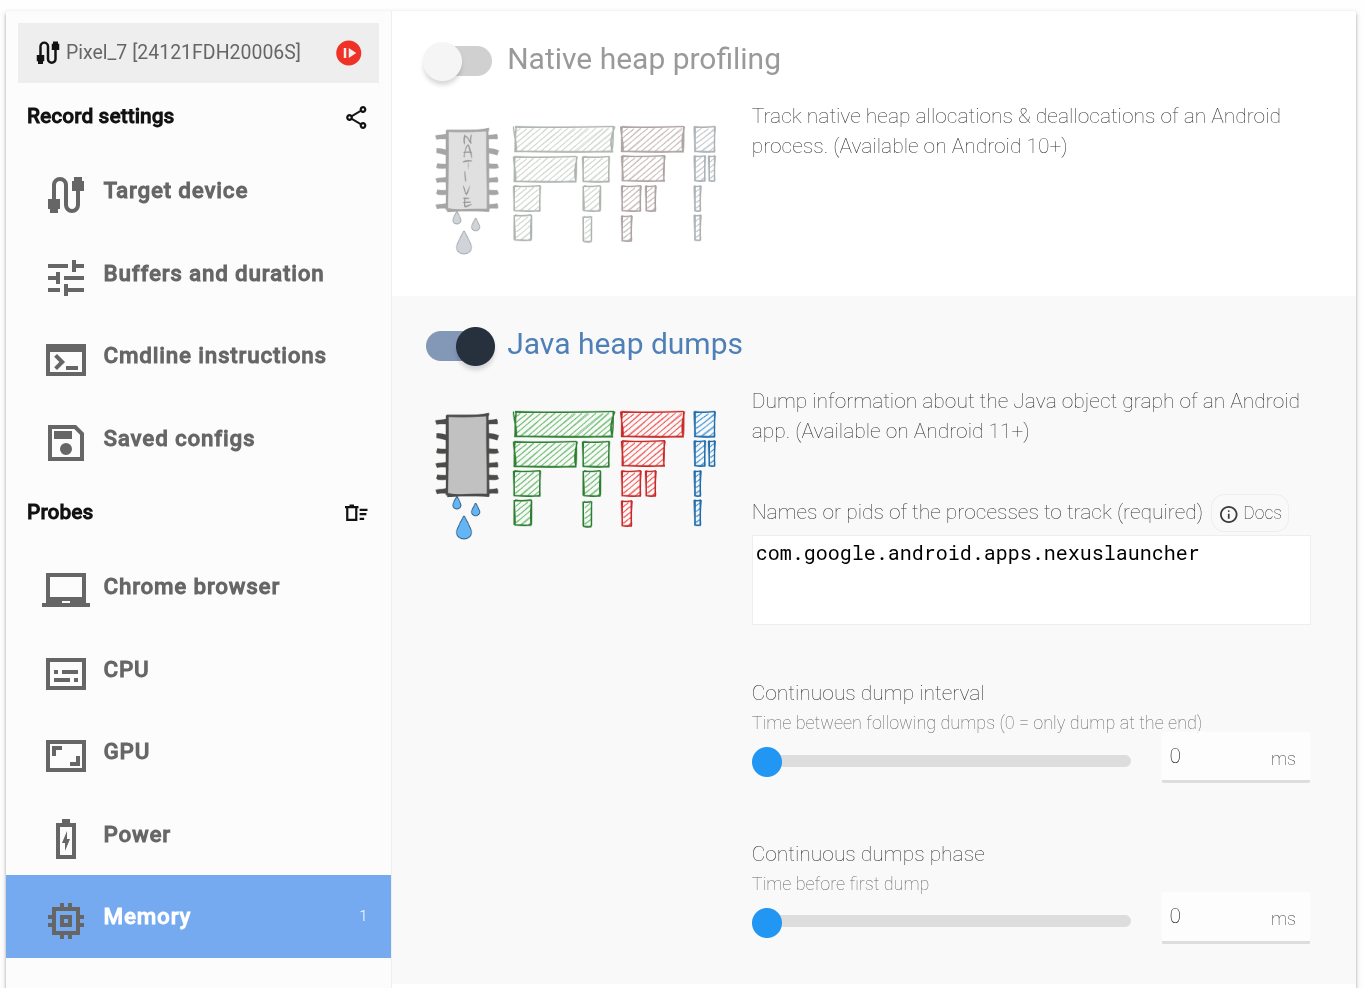
- Click on the
Memoryprobe on the left and then toggle theART heap dumpsoption. - Enter the process name in the
Namesbox. - The process name you have to enter is (the first argument of the) the process
cmdline. That is the right-most column (NAME) of
adb shell ps -A. - Select a short duration in the
Buffers and durationpage (10 s or less). The trace duration is meaningless for this particular data source, as it emits a whole dump at the end of the trace. A longer trace will not lead to more or better data. - Press the red button to start recording the trace.
On Android Perfetto heap profiling hooks are seamlessly integrated into the libc implementation.
Prerequisites
- ADB installed.
- Windows users: Make sure that the downloaded adb.exe is in the PATH.
set PATH=%PATH%;%USERPROFILE%\Downloads\platform-tools - A device running Android 10+.
- A Profileable or Debuggable app. If you are running on a "user" build of Android (as opposed to "userdebug" or "eng"), your app needs to be marked as profileable or debuggable in its manifest.
Instructions
$ adb devices -l
List of devices attached
24121FDH20006S         device usb:2-2.4.2 product:panther model:Pixel_7 device:panther transport_id:1
If more than one device or emulator is reported you must select one upfront as follows:
export ANDROID_SERIAL=24121FDH20006SDownload the tools/java_heap_dump (if you don't have a perfetto checkout):
curl -LO https://raw.githubusercontent.com/google/perfetto/main/tools/java_heap_dumpThen start the profile:
python3 java_heap_dump -n com.google.android.apps.nexuslauncherThe script will record a trace with the heap dump and print the path of the trace file (e.g. /tmp/tmpmhuvqmnqprofile)
Wrote profile to /tmp/tmpmhuvqmnqprofile
This can be viewed using https://ui.perfetto.dev.
Visualizing your first ART heap dump
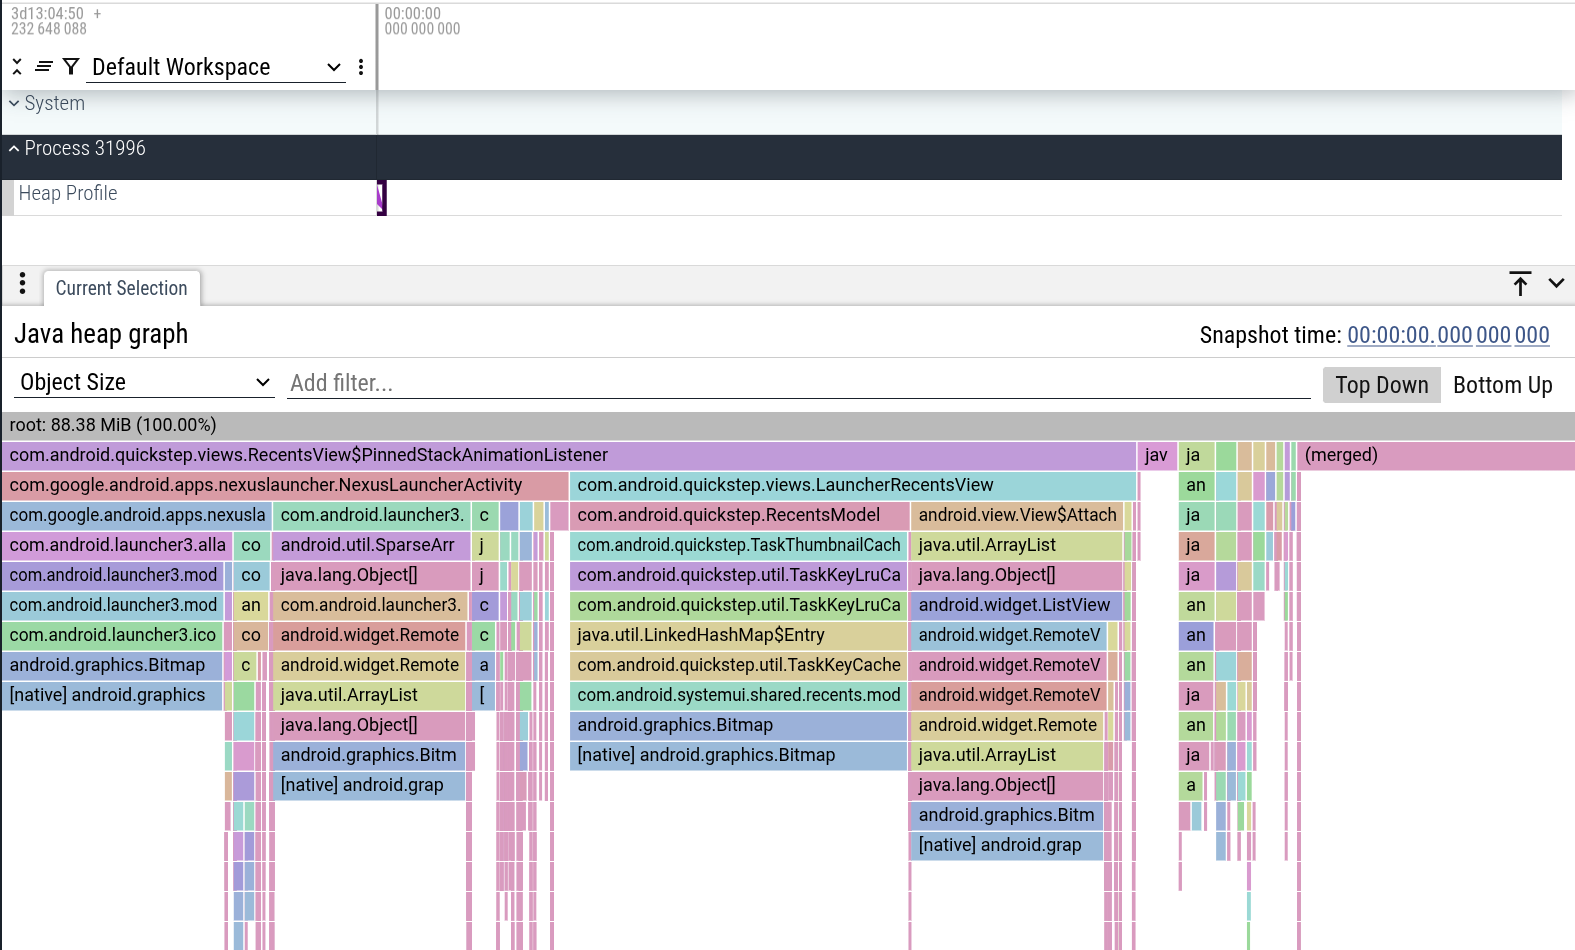
Open the /tmp/xxxx file in the Perfetto UI and click on the chevron marker in
the UI track labeled "ART heap dump".
The UI will show a flattened version of the heap graph, in the shape of a flamegraph. The flamegraph aggregates together summing objects of the same type that share the same reachability path. Two flattening strategies are possible:
Shortest path: this is the default option when selecting
Object Sizein the flamegraph header. This arranges objects based on heuristics that minimize the distance between them.Dominator tree: when selecting
Dominated Object Size, it uses the dominator tree algorithm to flatten the graph.
You can learn more about them in the Debugging memory usage case study
Querying your first heap profile
As well as visualizing traces on a timeline, Perfetto has support for querying traces using SQL. The easiest way to do this is using the query engine available directly in the UI.
In the Perfetto UI, click on the "Query (SQL)" tab in the left-hand menu.
This will open a two-part window. You can write your PerfettoSQL query in the top section and view the results in the bottom section.
You can then execute queries Ctrl/Cmd + Enter:
For example, by running:
INCLUDE PERFETTO MODULE android.memory.heap_profile.summary_tree;

SELECT
  -- The id of the callstack. A callstack in this context
  -- is a unique set of frames up to the root.
  id,
  -- The id of the parent callstack for this callstack.
  parent_id,
  -- The function name of the frame for this callstack.
  name,
  -- The name of the mapping containing the frame. This
  -- can be a native binary, library, JAR or APK.
  mapping_name,
  -- The name of the file containing the function.
  source_file,
  -- The line number in the file the function is located at.
  line_number,
  -- The amount of memory allocated and *not freed* with this
  -- function as the leaf frame.
  self_size,
  -- The amount of memory allocated and *not freed* with this
  -- function appearing anywhere on the callstack.
  cumulative_size,
  -- The amount of memory allocated with this function as the leaf
  -- frame. This may include memory which was later freed.
  self_alloc_size,
  -- The amount of memory allocated with this function appearing
  -- anywhere on the callstack. This may include memory which was
  -- later freed.
  cumulative_alloc_size
FROM android_heap_profile_summary_tree;
you can see the memory allocated by every unique callstack in the trace.
Other types of memory
Besides the standard native and Java heaps, memory can be allocated in other ways that are not profiled by default. Here are some common examples:
Direct
mmap()calls: Applications can directly request memory from the kernel usingmmap(). This is often done for large allocations or to map files into memory. Perfetto does not currently have a way to automatically profile these allocations.Custom allocators: Some applications use their own memory allocators for performance reasons. These allocators often get their memory from the system using
mmap()and then manage it internally. While Perfetto can't automatically profile these, you can instrument your custom allocator using the heapprofd Custom Allocator API to enable heap profiling.DMA buffers (
dmabuf): These are special buffers used for sharing memory between different hardware components (e.g., the CPU, GPU, and camera). This is common in graphics-intensive applications. You can trackdmabufallocations by enabling thedmabuf_heap/dma_heap_statftrace events in your trace configuration.
Next steps
Now that you've recorded and analyzed your first memory profile, you can explore more advanced topics:
- Learn more about memory debugging: The Memory Usage on Android Guide provides a deep dive into debugging memory issues on Android.
- Explore the heapprofd data source: The heapprofd data source documentation provides more details on the native heap profiler.