
Trace Processor (Python)
The trace processor Python API is built on the trace processor C++ library. By integrating with Python, the library allows using Python's rich data analysis ecosystem to process traces.
Setup
pip install perfettoNOTE: The API is only compatible with Python3.
The main entry point to the API is the TraceProcessor class.
Example Usage
The following examples demonstrate basic usage of the Python API.
Querying Slices
This example shows how to query for slices and print their names.
from perfetto.trace_processor import TraceProcessor
tp = TraceProcessor(trace='trace.perfetto-trace')

qr_it = tp.query('SELECT name FROM slice')
for row in qr_it:
  print(row.name)
Output
eglSwapBuffersWithDamageKHR
onMessageReceived
queueBuffer
bufferLoad
query
...
Querying as a Pandas DataFrame
For more advanced analysis, you can convert query results to a Pandas DataFrame.
from perfetto.trace_processor import TraceProcessor
tp = TraceProcessor(trace='trace.perfetto-trace')

qr_it = tp.query('SELECT ts, name FROM slice')
qr_df = qr_it.as_pandas_dataframe()
print(qr_df.to_string())
Output
ts                   name
-------------------- ---------------------------
     261187017446933 eglSwapBuffersWithDamageKHR
     261187017518340 onMessageReceived
     261187020825163 queueBuffer
     261187021345235 bufferLoad
     261187121345235 query
     ...
Initialization
TraceProcessor can be initialized in a few ways depending on where the trace
is and whether you want to connect to an existing trace_processor instance or
start a new one.
1. With a trace file or object (starts a new trace_processor instance):
This is the most common use case. You can provide a trace in several ways:
- A path to a trace file:
TraceProcessor(trace='trace.perfetto-trace') - A file-like object (e.g.,
io.BytesIO):TraceProcessor(trace=file_obj) - A generator yielding bytes:
TraceProcessor(trace=byte_generator) - A trace URI:
TraceProcessor(trace='resolver_name:key=value')
from perfetto.trace_processor import TraceProcessor

# Initialise TraceProcessor with a trace file path
tp = TraceProcessor(trace='trace.perfetto-trace')
2. Connecting to a running trace_processor instance:
If you have a trace_processor instance already running (e.g. started from the
command line), you can connect to it by providing its address.
# Connect to a running instance
tp = TraceProcessor(addr='localhost:9001')

# Connect to a running instance and load a new trace into it
tp = TraceProcessor(trace='trace.perfetto-trace', addr='localhost:9001')
Configuration
The TraceProcessor can be customized using the TraceProcessorConfig class.
from perfetto.trace_processor import TraceProcessor, TraceProcessorConfig, SqlPackage

config = TraceProcessorConfig(
    bin_path='/path/to/trace_processor', # Path to custom binary
    verbose=True,
    add_sql_packages=[
        '/path/to/my/sql/modules',  # Uses directory name as package name
        SqlPackage('/path/to/other', package='custom.pkg')  # Custom package name
    ]
)
tp = TraceProcessor(trace='trace.perfetto-trace', config=config)
TraceProcessorConfig has many options for customizing the trace_processor
instance. The most important are:
add_sql_packages: A list of PerfettoSQL packages to load. Each element can be a string path (directory name becomes the package name) or aSqlPackageobject (allows specifying a custom package name). All SQL modules inside these packages will be available to include usingINCLUDE PERFETTO MODULEPerfettoSQL statements.verbose: IfTrue,trace_processorwill print verbose output to stdout. This is useful for debugging and seeing more detailed error messages.bin_path: Path to thetrace_processorbinary. If not given, thetrace_processorversion pinned to (and shipped with) the installedperfettopackage is downloaded and used. This keeps results reproducible: upgrading the binary means upgrading the package.fetch_latest_trace_processor: IfTrue(andbin_pathis not set), fetch the latest available prebuilt fromget.perfetto.devinstead of the version pinned to the package. Use this to always run the newest build, at the cost of reproducibility. Note that this option is best-effort and may be ignored on platforms which source the binary differently (e.g. inside Google3, where the binary always comes from internal infra).
API
The TraceProcessor class provides various functions to interact with the
loaded trace.
Query
The query() function takes an SQL query as input and returns an iterator over
the result rows. For more information on how to write queries, see the
Getting Started with PerfettoSQL guide.
from perfetto.trace_processor import TraceProcessor
tp = TraceProcessor(trace='trace.perfetto-trace')

qr_it = tp.query('SELECT ts, dur, name FROM slice')
for row in qr_it:
  print(row.ts, row.dur, row.name)
Output
261187017446933 358594 eglSwapBuffersWithDamageKHR
261187017518340 357 onMessageReceived
261187020825163 9948 queueBuffer
261187021345235 642 bufferLoad
261187121345235 153 query
...
The QueryResultIterator can also be converted to a Pandas DataFrame, which is
useful for data analysis and visualization. This requires numpy and pandas
to be installed.
# Requires pandas and numpy
# pip install pandas numpy
import numpy as np

qr_it = tp.query('SELECT ts, dur, name FROM slice')
qr_df = qr_it.as_pandas_dataframe()
print(qr_df.to_string())
Output
ts                   dur                  name
-------------------- -------------------- ---------------------------
     261187017446933               358594 eglSwapBuffersWithDamageKHR
     261187017518340                  357 onMessageReceived
     261187020825163                 9948 queueBuffer
     261187021345235                  642 bufferLoad
     261187121345235                  153 query
     ...
Alternatively, results can be converted to a Polars DataFrame
using as_polars_dataframe(). Polars is an optional dependency.
# Requires polars
# pip install perfetto[polars]
qr_it = tp.query('SELECT ts, dur, name FROM slice')
qr_df = qr_it.as_polars_dataframe()
print(qr_df)
Output
shape: (5, 3)
┌─────────────────────┬────────┬─────────────────────────────┐
│ ts ┆ dur ┆ name │
│ --- ┆ --- ┆ --- │
│ i64 ┆ i64 ┆ str │
╞═════════════════════╪════════╪═════════════════════════════╡
│ 261187017446933 ┆ 358594 ┆ eglSwapBuffersWithDamageKHR │
│ 261187017518340 ┆ 357 ┆ onMessageReceived │
│ 261187020825163 ┆ 9948 ┆ queueBuffer │
│ 261187021345235 ┆ 642 ┆ bufferLoad │
│ 261187121345235 ┆ 153 ┆ query │
│ … ┆ … ┆ … │
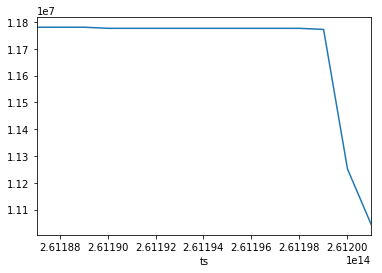
└─────────────────────┴────────┴─────────────────────────────┘You can use Pandas DataFrames to easily create visualizations from trace data.
from perfetto.trace_processor import TraceProcessor
tp = TraceProcessor(trace='trace.perfetto-trace')

qr_it = tp.query('SELECT ts, value FROM counter WHERE track_id=50')
qr_df = qr_it.as_pandas_dataframe()
qr_df = qr_df.replace(np.nan,0)
qr_df = qr_df.set_index('ts')['value'].plot()
Output
Trace Summary
The trace_summary() function computes a structured summary of the trace. This
is useful for creating structured protobuf messages for consumption by other
tools. This function is the replacement for the deprecated metric() function.
See the Trace Summarization docs for a deep dive into this feature.
from perfetto.trace_processor import TraceProcessor

spec = """
metric_spec {
  id: "memory_per_process"
  dimensions: "process_name"
  value: "avg_rss_and_swap"
  query: {
    table: {
      table_name: "memory_rss_and_swap_per_process"
      module_name: "linux.memory.process"
    }
    group_by: {
      column_names: "process_name"
      aggregates: {
        column_name: "rss_and_swap"
        op: DURATION_WEIGHTED_MEAN
        result_column_name: "avg_rss_and_swap"
      }
    }
  }
}
"""
with TraceProcessor(trace='trace.perfetto-trace') as tp:
    summary = tp.trace_summary(specs=[spec])
    print(summary)
Metatracing
Metatracing allows you to trace the performance of trace_processor itself.
# Enable metatracing
tp.enable_metatrace()

# Run some queries
tp.query('select * from slice')
tp.query('select * from slice')

# Disable and read the metatrace
metatrace_bytes = tp.disable_and_read_metatrace()

# You can now load this into another TraceProcessor instance
with open('tp_metatrace.pftrace', 'wb') as f:
    f.write(metatrace_bytes)
tp_meta = TraceProcessor(trace='tp_metatrace.pftrace')
tp_meta.query('select * from slice')
Metric (Deprecated)
The metric() function takes in a list of trace metrics and returns the results
as a Protobuf.
Note: this function is deprecated but there are no plans to remove it.
Consider using trace_summary() instead, which is an indirect replacement,
providing much of the same functionality but in a more flexible way.
from perfetto.trace_processor import TraceProcessor
tp = TraceProcessor(trace='trace.perfetto-trace')

ad_cpu_metrics = tp.metric(['android_cpu'])
print(ad_cpu_metrics)
Output
metrics {
  android_cpu {
    process_info {
      name: "/system/bin/init"
      threads {
        name: "init"
        core {
          id: 1
          metrics {
            mcycles: 1
            runtime_ns: 570365
            min_freq_khz: 1900800
            max_freq_khz: 1900800
            avg_freq_khz: 1902017
          }
        }
        core {
          id: 3
          metrics {
            mcycles: 0
            runtime_ns: 366406
            min_freq_khz: 1900800
            max_freq_khz: 1900800
            avg_freq_khz: 1902908
          }
        }
        ...
      }
      ...
    }
    process_info {
      name: "/system/bin/logd"
      threads {
        name: "logd.writer"
        core {
          id: 0
          metrics {
            mcycles: 8
            runtime_ns: 33842357
            min_freq_khz: 595200
            max_freq_khz: 1900800
            avg_freq_khz: 1891825
          }
        }
        core {
          id: 1
          metrics {
            mcycles: 9
            runtime_ns: 36019300
            min_freq_khz: 1171200
            max_freq_khz: 1900800
            avg_freq_khz: 1887969
          }
        }
        ...
      }
      ...
    }
    ...
  }
}