
Memory counters and events
Perfetto allows to gather a number of memory events and counters on Android and Linux. These events come from kernel interfaces, both ftrace and /proc interfaces, and are of two types: polled counters and events pushed by the kernel in the ftrace buffer.
Per-process polled counters
The process stats data source allows to poll /proc/<pid>/status and
/proc/<pid>/oom_score_adj at user-defined intervals.
See man 5 proc for their semantic.
UI

SQL
WARNING: We strongly recommend using the tables in the standard library rather than querying this data directly. See memory usage section in the Android trace analysis cookbook.
select c.ts, c.value, t.name as counter_name, p.name as proc_name, p.pid
from counter as c left join process_counter_track as t on c.track_id = t.id
left join process as p using (upid)
where t.name like 'mem.%'| ts | counter_name | value_kb | proc_name | pid |
|---|---|---|---|---|
| 261187015027350 | mem.virt | 1326464 | com.android.vending | 28815 |
| 261187015027350 | mem.rss | 85592 | com.android.vending | 28815 |
| 261187015027350 | mem.rss.anon | 36948 | com.android.vending | 28815 |
| 261187015027350 | mem.rss.file | 46560 | com.android.vending | 28815 |
| 261187015027350 | mem.swap | 6908 | com.android.vending | 28815 |
| 261187015027350 | mem.rss.watermark | 102856 | com.android.vending | 28815 |
| 261187090251420 | mem.virt | 1326464 | com.android.vending | 28815 |
TraceConfig
To collect process stat counters every X ms set proc_stats_poll_ms = X in your
process stats config. X must be greater than 100ms to avoid excessive CPU usage.
Details about the specific counters being collected can be found in the
ProcessStats reference.
data_sources: {
    config {
        name: "linux.process_stats"
        process_stats_config {
            scan_all_processes_on_start: true
            proc_stats_poll_ms: 1000
        }
    }
}
Per-process memory events (ftrace)
rss_stat
Recent versions of the Linux kernel allow to report ftrace events when the
Resident Set Size (RSS) mm counters change. This is the same counter available
in /proc/pid/status as VmRSS. The main advantage of this event is that by
being an event-driven push event it allows to detect very short memory usage
bursts that would be otherwise undetectable by using /proc counters.
Memory usage peaks of hundreds of MB can have dramatically negative impact on Android, even if they last only few ms, as they can cause mass low memory kills to reclaim memory.
For examples of analyzing memory usage, see the memory usage section in the Android trace analysis cookbook.
The kernel feature that supports this has been introduced in the Linux Kernel in b3d1411b6 and later improved by e4dcad20. They are available in upstream since Linux v5.5-rc1. This patch has been backported in several Google Pixel kernels running Android 10 (Q).
mm_event
mm_event is an ftrace event that captures statistics about key memory events
(a subset of the ones exposed by /proc/vmstat). Unlike RSS-stat counter
updates, mm events are extremely high volume and tracing them individually would
be unfeasible. mm_event instead reports only periodic histograms in the trace,
reducing sensibly the overhead.
mm_event is available only on some Google Pixel kernels running Android 10 (Q)
and beyond.
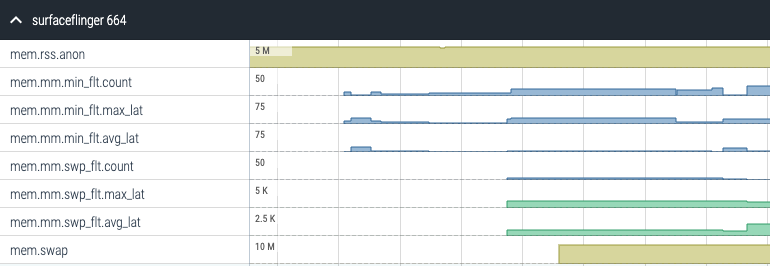
When mm_event is enabled, the following mm event types are recorded:
- mem.mm.min_flt: Minor page faults
- mem.mm.maj_flt: Major page faults
- mem.mm.swp_flt: Page faults served by swapcache
- mem.mm.read_io: Read page faults backed by I/O
- mem.mm..compaction: Memory compaction events
- mem.mm.reclaim: Memory reclaim events
For each event type, the event records:
- count: how many times the event happened since the previous event.
- min_lat: the smallest latency (the duration of the mm event) recorded since the previous event.
- max_lat: the highest latency recorded since the previous event.
UI
SQL
WARNING: We strongly recommend using the tables in the standard library rather than querying this data directly. See memory usage section in the Android trace analysis cookbook.
At the SQL level, these events are imported and exposed in the same way as the corresponding polled events. This allows to collect both types of events (pushed and polled) and treat them uniformly in queries and scripts.
select c.ts, c.value, t.name as counter_name, p.name as proc_name, p.pid
from counter as c left join process_counter_track as t on c.track_id = t.id
left join process as p using (upid)
where t.name like 'mem.%'| ts | value | counter_name | proc_name | pid |
|---|---|---|---|---|
| 777227867975055 | 18358272 | mem.rss.anon | com.google.android.apps.safetyhub | 31386 |
| 777227865995315 | 5 | mem.mm.min_flt.count | com.google.android.apps.safetyhub | 31386 |
| 777227865995315 | 8 | mem.mm.min_flt.max_lat | com.google.android.apps.safetyhub | 31386 |
| 777227865995315 | 4 | mem.mm.min_flt.avg_lat | com.google.android.apps.safetyhub | 31386 |
| 777227865998023 | 3 | mem.mm.swp_flt.count | com.google.android.apps.safetyhub | 31386 |
TraceConfig
data_sources: {
    config {
        name: "linux.ftrace"
        ftrace_config {
            ftrace_events: "kmem/rss_stat"
            ftrace_events: "mm_event/mm_event_record"
        }
    }
}

# This is for getting Thread<>Process associations and full process names.
data_sources: {
    config {
        name: "linux.process_stats"
    }
}
System-wide polled counters
This data source allows periodic polling of system data from:
/proc/stat/proc/vmstat/proc/meminfo
See man 5 proc for their semantic.
UI

The polling period and specific counters to include in the trace can be set in the trace config.
SQL
select c.ts, t.name, c.value / 1024 as value_kb from counters as c left join counter_track as t on c.track_id = t.id| ts | name | value_kb |
|---|---|---|
| 775177736769834 | MemAvailable | 1708956 |
| 775177736769834 | Buffers | 6208 |
| 775177736769834 | Cached | 1352960 |
| 775177736769834 | SwapCached | 8232 |
| 775177736769834 | Active | 1021108 |
| 775177736769834 | Inactive(file) | 351496 |
TraceConfig
The set of supported counters is available in the TraceConfig reference
data_sources: {
    config {
        name: "linux.sys_stats"
        sys_stats_config {
            meminfo_period_ms: 1000
            meminfo_counters: MEMINFO_MEM_TOTAL
            meminfo_counters: MEMINFO_MEM_FREE
            meminfo_counters: MEMINFO_MEM_AVAILABLE

            vmstat_period_ms: 1000
            vmstat_counters: VMSTAT_NR_FREE_PAGES
            vmstat_counters: VMSTAT_NR_ALLOC_BATCH
            vmstat_counters: VMSTAT_NR_INACTIVE_ANON
            vmstat_counters: VMSTAT_NR_ACTIVE_ANON

            stat_period_ms: 1000
            stat_counters: STAT_CPU_TIMES
            stat_counters: STAT_FORK_COUNT
        }
    }
}
Low-memory Kills (LMK)
Background
The Android framework kills apps and services, especially background ones, to make room for newly opened apps when memory is needed. These are known as low memory kills (LMK).
Note LMKs are not always the symptom of a performance problem. The rule of thumb is that the severity (as in: user perceived impact) is proportional to the state of the app being killed. The app state can be derived in a trace from the OOM adjustment score.
A LMK of a foreground app or service is typically a big concern. This happens when the app that the user was using disappeared under their fingers, or their favorite music player service suddenly stopped playing music.
A LMK of a cached app or service, instead, is frequently business-as-usual and in most cases won't be noticed by the end user until they try to go back to the app, which will then cold-start.
The situation in between these extremes is more nuanced. LMKs of cached apps/service can be still problematic if it happens in storms (i.e. observing that most processes get LMK-ed in a short time frame) and are often the symptom of some component of the system causing memory spikes.
lowmemorykiller vs lmkd
In-kernel lowmemorykiller driver
In Android, LMK used to be handled by an ad-hoc kernel-driver, Linux's
drivers/staging/android/lowmemorykiller.c.
This driver uses to emit the ftrace event lowmemorykiller/lowmemory_kill in
the trace.
Userspace lmkd
Android 9 introduced a userspace native daemon that took over the LMK
responsibility: lmkd. Not all devices running Android 9 will necessarily use
lmkd as the ultimate choice of in-kernel vs userspace is up to the phone
manufacturer, their kernel version and kernel config.
On Google Pixel phones, lmkd-side killing is used since Pixel 2 running
Android 9.
See https://source.android.com/devices/tech/perf/lmkd for details.
lmkd emits a userspace atrace counter event called kill_one_process.
Android LMK vs Linux oomkiller
LMKs on Android, whether the old in-kernel lowmemkiller or the newer lmkd,
use a completely different mechanism than the standard
Linux kernel's OOM Killer. Perfetto at the
moment supports only Android LMK events (Both in-kernel and user-space) and does
not support tracing of Linux kernel OOM Killer events. Linux OOMKiller events
are still theoretically possible on Android but extremely unlikely to happen. If
they happen, they are more likely the symptom of a mis-configured BSP.
UI
Newer userspace LMKs are available in the UI under the lmkd track in the form
of a counter. The counter value is the PID of the killed process (in the example
below, PID=27985).

SQL
Both newer lmkd and legacy kernel-driven lowmemorykiller events are normalized
at import time and available under the mem.lmk key in the instants table.
SELECT ts, process.name, process.pid
FROM instant
JOIN process_track ON instant.track_id = process_track.id
JOIN process USING (upid)
WHERE instant.name = 'mem.lmk'| ts | name | pid |
|---|---|---|
| 442206415875043 | roid.apps.turbo | 27324 |
| 442206446142234 | android.process.acore | 27683 |
| 442206462090204 | com.google.process.gapps | 28198 |
TraceConfig
To enable tracing of low memory kills add the following options to trace config:
data_sources: {
    config {
        name: "linux.ftrace"
        ftrace_config {
            # For old in-kernel events.
            ftrace_events: "lowmemorykiller/lowmemory_kill"

            # For new userspace lmkds.
            atrace_apps: "lmkd"

            # This is not strictly required but is useful to know the state
            # of the process (FG, cached, ...) before it got killed.
            ftrace_events: "oom/oom_score_adj_update"
        }
    }
}
App states and OOM adjustment score
The Android app state can be inferred in a trace from the process
oom_score_adj. The mapping is not 1:1, there are more states than
oom_score_adj value groups and the oom_score_adj range for cached processes
spans from 900 to 1000.
The mapping can be inferred from the ActivityManager's ProcessList sources
// This is a process only hosting activities that are not visible,
// so it can be killed without any disruption.
static final int CACHED_APP_MAX_ADJ = 999;
static final int CACHED_APP_MIN_ADJ = 900;

// This is the oom_adj level that we allow to die first. This cannot be equal to
// CACHED_APP_MAX_ADJ unless processes are actively being assigned an oom_score_adj of
// CACHED_APP_MAX_ADJ.
static final int CACHED_APP_LMK_FIRST_ADJ = 950;

// The B list of SERVICE_ADJ -- these are the old and decrepit
// services that aren't as shiny and interesting as the ones in the A list.
static final int SERVICE_B_ADJ = 800;

// This is the process of the previous application that the user was in.
// This process is kept above other things, because it is very common to
// switch back to the previous app.  This is important both for recent
// task switch (toggling between the two top recent apps) as well as normal
// UI flow such as clicking on a URI in the e-mail app to view in the browser,
// and then pressing back to return to e-mail.
static final int PREVIOUS_APP_ADJ = 700;

// This is a process holding the home application -- we want to try
// avoiding killing it, even if it would normally be in the background,
// because the user interacts with it so much.
static final int HOME_APP_ADJ = 600;

// This is a process holding an application service -- killing it will not
// have much of an impact as far as the user is concerned.
static final int SERVICE_ADJ = 500;

// This is a process with a heavy-weight application.  It is in the
// background, but we want to try to avoid killing it.  Value set in
// system/rootdir/init.rc on startup.
static final int HEAVY_WEIGHT_APP_ADJ = 400;

// This is a process currently hosting a backup operation.  Killing it
// is not entirely fatal but is generally a bad idea.
static final int BACKUP_APP_ADJ = 300;

// This is a process bound by the system (or other app) that's more important than services but
// not so perceptible that it affects the user immediately if killed.
static final int PERCEPTIBLE_LOW_APP_ADJ = 250;

// This is a process only hosting components that are perceptible to the
// user, and we really want to avoid killing them, but they are not
// immediately visible. An example is background music playback.
static final int PERCEPTIBLE_APP_ADJ = 200;

// This is a process only hosting activities that are visible to the
// user, so we'd prefer they don't disappear.
static final int VISIBLE_APP_ADJ = 100;

// This is a process that was recently TOP and moved to FGS. Continue to treat it almost
// like a foreground app for a while.
// @see TOP_TO_FGS_GRACE_PERIOD
static final int PERCEPTIBLE_RECENT_FOREGROUND_APP_ADJ = 50;

// This is the process running the current foreground app.  We'd really
// rather not kill it!
static final int FOREGROUND_APP_ADJ = 0;

// This is a process that the system or a persistent process has bound to,
// and indicated it is important.
static final int PERSISTENT_SERVICE_ADJ = -700;

// This is a system persistent process, such as telephony.  Definitely
// don't want to kill it, but doing so is not completely fatal.
static final int PERSISTENT_PROC_ADJ = -800;

// The system process runs at the default adjustment.
static final int SYSTEM_ADJ = -900;

// Special code for native processes that are not being managed by the system (so
// don't have an oom adj assigned by the system).
static final int NATIVE_ADJ = -1000;