
Memory: ART Heap Dumps for Java/Kotlin Heap
NOTE: Capturing Heap dumps requires Android 11 or higher
NOTE: Perfetto ART Heap Dumps are distinct from standard JVM / HPROF heap dumps. Unlike HPROF dumps, these only contain the reference graph - not the data within objects.
See the Memory Guide for getting started with ART (Android RunTime) heap dumps.
Conversely from heap profiles, heap dumps report full retention graphs of Java objects but not call-stacks. The information recorded in a heap dump is of the form: Object X retains object Y, which is N bytes large, through its class member named Z.
Heap dumps are not to be confused with profiles taken by the ART Allocation Profiling, which records allocation events / call stacks.
UI
Heap dumps are shown as flamegraphs in the UI after clicking on the diamond in the "Heap Profile" track of a process. Each diamond corresponds to a heap dump.

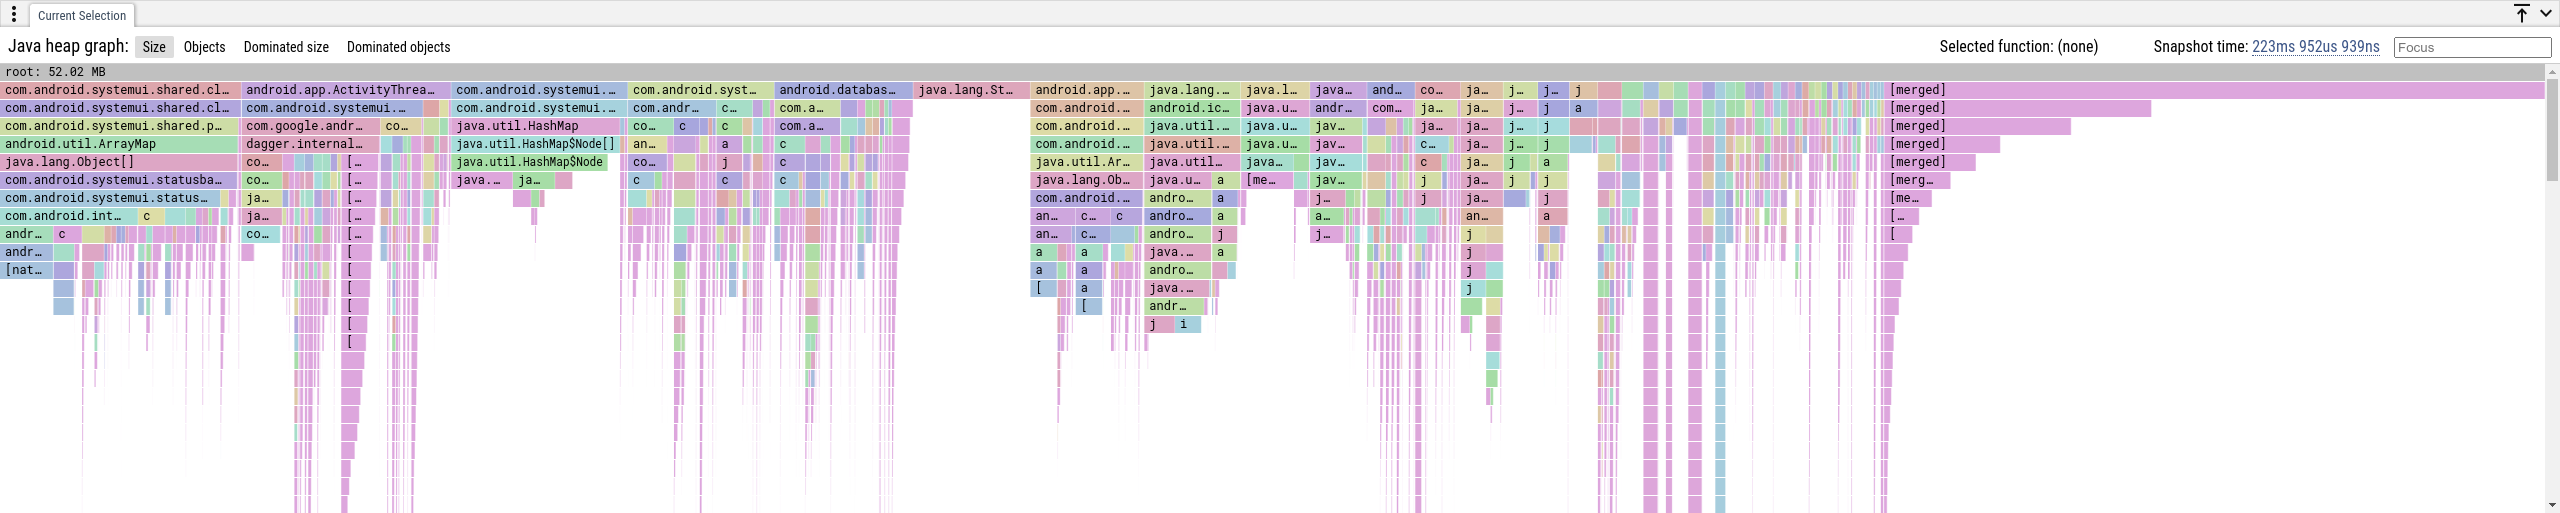
The native size of certain objects is represented as an extra child node in the flamegraph, prefixed with "[native]". The extra node counts as an extra object. This is available only on Android 13 or higher.
SQL
Information about the Java Heap is written to the following tables:
native_size (available only on Android T+) is extracted from the related
libcore.util.NativeAllocationRegistry and is not included in self_size.
For instance, to get the bytes used by class name, run the following query. As-is this query will often return un-actionable information, as most of the bytes in the Java heap end up being primitive arrays or strings.
select c.name, sum(o.self_size)
       from heap_graph_object o join heap_graph_class c on (o.type_id = c.id)
where reachable = 1 group by 1 order by 2 desc;| name | sum(o.self_size) |
|---|---|
| java.lang.String | 2770504 |
| long[] | 1500048 |
| int[] | 1181164 |
| java.lang.Object[] | 624812 |
| char[] | 357720 |
| byte[] | 350423 |
Using the standard library, we can query the normalize the graph into a tree, always taking the shortest path to the root and get cumulative sizes. From this we can see how much memory is being held by each type of object
INCLUDE PERFETTO MODULE android.memory.heap_graph.class_summary_tree;

SELECT
  -- The name of the class.
  name,
  -- The sum of `self_size` of this node and all descendants of this node.
  cumulative_size
FROM android_heap_graph_class_summary_tree;| name | cumulative_size |
|---|---|
| java.lang.String | 1431688 |
| java.lang.Class<android.icu.text.Transliterator> | 1120227 |
| android.icu.text.TransliteratorRegistry | 1119600 |
| com.android.systemui.statusbar.phone.StatusBarNotificationPresenter$2 | 1086209 |
| com.android.systemui.statusbar.phone.StatusBarNotificationPresenter | 1085593 |
| java.util.Collections$SynchronizedMap | 1063376 |
| java.util.HashMap | 1063292 |
TraceConfig
The ART heap dump data source is configured through the JavaHprofConfig section of the trace config.
data_sources {
  config {
    name: "android.java_hprof"
    java_hprof_config {
      process_cmdline: "com.google.android.inputmethod.latin"
      dump_smaps: true
    }
  }
}