
Trace configuration
Unlike many always-on logging systems (e.g. Linux's rsyslog, Android's logcat), in Perfetto all tracing data sources are idle by default and record data only when instructed to do so.
A simple trace config looks like this:
duration_ms: 10000

buffers {
  size_kb: 65536
  fill_policy: RING_BUFFER
}

data_sources {
  config {
    name: "linux.ftrace"
    target_buffer: 0
    ftrace_config {
      ftrace_events: "sched_switch"
      ftrace_events: "sched_wakeup"
    }
  }
}
And is used as follows:
perfetto --txt -c config.pbtx -o trace_file.perfetto-traceTIP: Some more complete examples of trace configs can be found in the repo in
/test/configs/.
NOTE: If you are tracing on Android using adb and experiencing problems, see the Android section below.
TraceConfig
The TraceConfig is a protobuf message (reference docs) that defines:
The general behavior of the whole tracing system, e.g.:
- The max duration of the trace.
- The number of in-memory buffers and their size.
- The max size of the output trace file.
Which data sources to enable and their configuration, e.g.:
- For the kernel tracing data source , which ftrace events to enable.
- For the heap profiler, the target process name and sampling rate.
See the data sources section of the docs for details on how to configure the data sources bundled with Perfetto.
The
{data source} x {buffer}mappings: which buffer each data source should write into (see buffers section below).
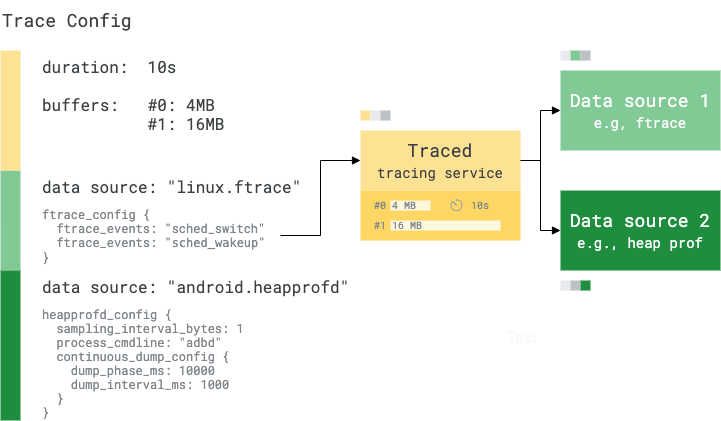
The tracing service (traced) acts as a configuration dispatcher: it receives a
config from the perfetto cmdline client (or any other
Consumer) and forwards parts of the
config to the various Producers
connected.
When a tracing session is started by a consumer, the tracing service will:
- Read the outer section of the TraceConfig (e.g.
duration_ms,buffers) and use that to determine its own behavior. - Read the list of data sources in the
data_sourcessection. For each data source listed in the config, if a corresponding name ("linux.ftrace"in the example below) was registered, the service will ask the producer process to start that data source, passing it the raw bytes of theDataSourceConfigsubsection verbatim to the data source (See backward/forward compat section below).
Buffers
The buffer sections define the number, size and policy of the in-memory buffers owned by the tracing service. It looks as follows:
# Buffer #0
buffers {
  size_kb: 4096
  fill_policy: RING_BUFFER
}

# Buffer #1
buffers {
  size_kb: 8192
  fill_policy: DISCARD
}
Each buffer has a fill policy which is either:
RING_BUFFER (default): the buffer behaves like a ring buffer and writes when full will wrap over and replace the oldest trace data in the buffer.
DISCARD: the buffer stops accepting data once full. Further write attempts are dropped.
WARNING: DISCARD can have unexpected side-effect with data sources that commit data at the end of the trace.
A trace config must define at least one buffer to be valid. In the simplest case all data sources will write their trace data into the same buffer.
While this is fine for most basic cases, it can be problematic in cases where different data sources write at significantly different rates.
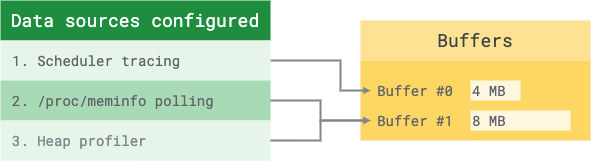
For instance, imagine a trace config that enables both:
The kernel scheduler tracer. On a typical Android phone this records ~10000 events/second, writing ~1 MB/s of trace data into the buffer.
Memory stat polling. This data source writes the contents of /proc/meminfo into the trace buffer and is configured to poll every 5 seconds, writing ~100 KB per poll interval.
If both data sources are configured to write into the same buffer and such buffer is set to 4MB, most traces will contain only one memory snapshot. There are very good chances that most traces won't contain any memory snapshot at all, even if the 2nd data sources was working perfectly. This is because during the 5 s. polling interval, the scheduler data source can end up filling the whole buffer, pushing the memory snapshot data out of the buffer.
Dynamic buffer mapping
Data-source <> buffer mappings are dynamic in Perfetto. In the simplest case a tracing session can define only one buffer. By default, all data sources will record data into that one buffer.
In cases like the example above, it might be preferable separating these data
sources into different buffers. This can be achieved with the target_buffer
field of the TraceConfig.
Can be achieved with:
data_sources {
  config {
    name: "linux.ftrace"
    target_buffer: 0       # <-- This goes into buffer 0.
    ftrace_config { ... }
  }
}

data_sources: {
  config {
      name: "linux.sys_stats"
      target_buffer: 1     # <-- This goes into buffer 1.
      sys_stats_config { ... }
  }
}

data_sources: {
  config {
    name: "android.heapprofd"
    target_buffer: 1       # <-- This goes into buffer 1 as well.
    heapprofd_config { ... }
  }
}
PBTX vs binary format
There are two ways to pass the trace config when using the perfetto cmdline
client format:
Text format
It is the preferred format for human-driven workflows and exploration. It allows to pass directly the text file in the PBTX (ProtoBuf TeXtual representation) syntax, for the schema defined in the trace_config.proto (see reference docs)
When using this mode pass the --txt flag to perfetto to indicate the config
should be interpreted as a PBTX file:
perfetto -c /path/to/config.pbtx --txt -o trace_file.perfetto-traceNOTE: The --txt option has been introduced only in Android 10 (Q). Older
versions support only the binary format.
WARNING: Do not use the text format for machine-to-machine interaction benchmark, scripts and tools) as it's more prone to breakages (e.g. if a field is renamed or an enum is turned into an integer)
Binary format
It is the preferred format for machine-to-machine (M2M) interaction. It involves
passing the protobuf-encoded binary of the TraceConfig message. This can be
obtained passing the PBTX in input to the protobuf's protoc compiler (which
can be downloaded here).
cd ~/code/perfetto  # external/perfetto in the Android tree.

protoc --encode=perfetto.protos.TraceConfig \
        -I. protos/perfetto/config/perfetto_config.proto \
        < config.txpb \
        > config.bin
and then passing it to perfetto as follows, without the --txt argument:
perfetto -c config.bin -o trace_file.perfetto-traceStreaming long traces
By default Perfetto keeps the full trace buffer(s) in memory and writes it into
the destination file (the -o cmdline argument) only at the end of the tracing
session. This is to reduce the perf-intrusiveness of the tracing system. This,
however, limits the max size of the trace to the physical memory size of the
device, which is often too limiting.
In some cases (e.g., benchmarks, hard to repro cases) it is desirable to capture traces that are way larger than that, at the cost of extra I/O overhead.
To achieve that, Perfetto allows to periodically write the trace buffers into the target file (or stdout) using the following TraceConfig fields:
write_into_file (bool): When true periodically drains the trace buffers into the output file. When this option is enabled, the userspace buffers need to be just big enough to hold tracing data between two write periods. The buffer sizing depends on the activity of the device. The data rate of a typical trace is ~1-4 MB/s. So a 16MB in-memory buffer can hold for up write periods of ~4 seconds before starting to lose data.file_write_period_ms (uint32): Overrides the default drain period (5s). Shorter periods require a smaller userspace buffer but increase the performance intrusiveness of tracing. If the period given is less than 100ms, the tracing service will use a period of 100ms.max_file_size_bytes (uint64): If set, stops the tracing session after N bytes have been written. Used to cap the size of the trace.
For a complete example of a working trace config in long-tracing mode see
/test/configs/long_trace.cfg.
Summary: to capture a long trace just set write_into_file:true, set a long
duration_ms and use an in-memory buffer size of 32MB or more.
Compressing the trace
The tracing service can compress the trace as it is written out. This substantially reduces the size of the file on disk (and of the data pulled off a device), at the cost of some extra CPU while tracing. Compression is off by default and is opted into from the TraceConfig.
Perfetto readers decompress transparently: a compressed trace opens directly in the Perfetto UI and Trace Processor, no manual step required.
Selecting a codec
Set the compression field, choosing a codec by which sub-message you fill in:
- zstd — recommended. Smaller traces than deflate at a similar speed.
- deflate (zlib) — the older codec, kept for compatibility.
# Rest of the trace config (buffers, data_sources, ...) omitted.

compression {
  zstd {}
}
# Rest of the trace config (buffers, data_sources, ...) omitted.
compression {
deflate {}
}Tuning the zstd level
zstd exposes a compression level, trading CPU for a smaller file:
compression {
  zstd {
    level: 9
  }
}- The range is
1(fastest) to22(smallest). Levels above the maximum are clamped. 0or unset uses zstd's default (3), a good balance for most traces.- Negative levels are valid and select faster, lower-ratio modes.
Compatibility across service versions
compression was added in Perfetto v58 (Android 26Q3+). A service reads only the
codecs it knows and picks the one with the highest field number, so a single
config can target old and new services: set both, and v58+ uses zstd (field 2)
while older services fall back to deflate (field 1).
compression {
  deflate {}
  zstd {}
}
Services predating compression used the now-deprecated compression_type
(deflate only). It is still honored, but compression takes precedence when both
are set.
NOTE: A codec is only compiled in when its build flag is enabled
(enable_perfetto_zlib, enable_perfetto_zstd). Builds without it — notably the
in-process SDK backend — ignore the request and emit an uncompressed trace. See
the SDK build flags to enable compression
when writing traces directly from an app.
Reading a compressed trace outside Perfetto
If you need the raw, uncompressed protobuf (e.g. for a non-Perfetto tool), use
traceconv to expand the compressed packets:
./traceconv decompress_packets trace.perfetto-trace trace.decompressedData-source specific config
Alongside the trace-wide configuration parameters, the trace config also defines
data-source-specific behaviors. At the proto schema level, this is defined in
the DataSourceConfig section of TraceConfig:
From data_source_config.proto:
message TraceConfig {
  ...
  repeated DataSource data_sources = 2;  // See below.
}

message DataSource {
  optional protos.DataSourceConfig config = 1;  // See below.
  ...
}

message DataSourceConfig {
  optional string name = 1;
  ...
  optional FtraceConfig ftrace_config = 100 [lazy = true];
  ...
  optional AndroidPowerConfig android_power_config = 106 [lazy = true];
}
Fields like ftrace_config, android_power_config are examples of data-source
specific configs. The tracing service will completely ignore the contents of
those fields and route the whole DataSourceConfig object to any data source
registered with the same name.
The [lazy=true] marker has a special implication in the
protozero code generator. Unlike standard
nested messages, it generates raw accessors (e.g.,
const std::string& ftrace_config_raw() instead of
const protos::FtraceConfig& ftrace_config()). This is to avoid injecting too
many #include dependencies and avoiding binary size bloat in the code that
implements data sources.
A note on backwards/forward compatibility
The tracing service will route the raw binary blob of the DataSourceConfig
message to the data sources with a matching name, without attempting to decode
and re-encode it. If the DataSourceConfig section of the trace config contains
a new field that didn't exist at the time when the service was built, the
service will still pass the DataSourceConfig through to the data source. This
allows to introduced new data sources without needing the service to know
anything about them upfront.
TODO: we are aware of the fact that today extending the DataSourceConfig with
a custom proto requires changing the data_source_config.proto in the Perfetto
repo, which is unideal for external projects. The long-term plan is to reserve a
range of fields for non-upstream extensions and provide generic templated
accessors for client code. Until then, we accept patches upstream to introduce
ad-hoc configurations for your own data sources.
Multi-process data sources
Some data sources are singletons. E.g., in the case of scheduler tracing that
Perfetto ships on Android, there is only data source for the whole system, owned
by the traced_probes service.
However, in the general case multiple processes can advertise the same data source. This is the case, for instance, when using the Perfetto SDK for userspace instrumentation.
If this happens, when starting a tracing session that specifies that data source in the trace config, Perfetto by default will ask all processes that advertise that data source to start it.
In some cases it might be desirable to further limit the enabling of the data
source to a specific process (or set of processes). That is possible through the
producer_name_filter and producer_name_regex_filter.
NOTE: the typical Perfetto run-time model is: one process == one Perfetto Producer; one Producer typically hosts multiple data sources.
When those filters are set, the Perfetto tracing service will activate the data source only in the subset of producers matching the filter.
Example:
buffers {
  size_kb: 4096
}

data_sources {
  config {
    name: "track_event"
  }
  # Enable the data source only on Chrome and Chrome canary.
  producer_name_filter: "com.android.chrome"
  producer_name_filter: "com.google.chrome.canary"
}
Triggers
In nominal conditions, a tracing session has a lifecycle that simply matches the
invocation of the perfetto cmdline client: trace data recording starts when
the TraceConfig is passed to perfetto and ends when either the
TraceConfig.duration_ms has elapsed, or when the cmdline client terminates.
Perfetto supports an alternative mode of either starting or stopping the trace which is based on triggers. The overall idea is to declare in the trace config itself:
- A set of triggers, which are just free-form strings.
- Whether a given trigger should cause the trace to be started or stopped, and the start/stop delay.
Why using triggers? Why can't one just start perfetto or kill(SIGTERM) it when needed? The rationale of all this is the security model: in most Perfetto deployments (e.g., on Android) only privileged entities (e.g., adb shell) can configure/start/stop tracing. Apps are unprivileged in this sense and they cannot control tracing.
Triggers offer a way to unprivileged apps to control, in a limited fashion, the lifecycle of a tracing session. The conceptual model is:
- The privileged Consumer (see Service model), i.e. the entity that is normally authorized to start tracing (e.g., adb shell in Android), declares upfront what are the possible trigger names for the trace and what they will do.
- Unprivileged entities (any random app process) can activate those triggers. Unprivileged entities don't get a say on what the triggers will do, they only communicate that an event happened.
Triggers can be signaled via the cmdline util
/system/bin/trigger_perfetto "trigger_name"(or also by starting an independent trace session which uses only the
activate_triggers: "trigger_name" field in the config)
There are two types of triggers:
Start triggers
Start triggers allow activating a tracing session only after some significant
event has happened. Passing a trace config that has START_TRACING trigger
causes the tracing session to stay idle (i.e. not recording any data) until
either the trigger is hit or the trigger_timeout_ms timeout is hit.
trace_duration_ms and triggered traces can not be used at the same time.
Example config:
# If the "myapp_is_slow" is hit, the trace starts recording data and will be
# stopped after 5s.
trigger_config {
  trigger_mode: START_TRACING
  triggers {
    name: "myapp_is_slow"
    stop_delay_ms: 5000
  }
  # If no trigger is hit, the trace will end without having recorded any data
  # after 30s.
  trigger_timeout_ms: 30000
}

# The rest of the config is as usual.
buffers { ... }
data_sources { ... }
Stop triggers
STOP_TRACING triggers allow to prematurely finalize a trace when the trigger is
hit. In this mode the trace starts immediately when the perfetto client is
invoked (like in nominal cases). The trigger acts as a premature finalization
signal.
This can be used to use perfetto in flight-recorder mode. By starting a trace
with buffers configured in RING_BUFFER mode and STOP_TRACING triggers, the
trace will be recorded in a loop and finalized when the culprit event is
detected. This is key for events where the root cause is in the recent past
(e.g., the app detects a slow scroll or a missing frame).
Example config:
# If no trigger is hit, the trace will end after 30s.
trigger_timeout_ms: 30000

# If the "missed_frame" is hit, the trace is stopped after 1s.
trigger_config {
  trigger_mode: STOP_TRACING
  triggers {
    name: "missed_frame"
    stop_delay_ms: 1000
  }
}

# The rest of the config is as usual.
buffers { ... }
data_sources { ... }
Android
On Android, there are some caveats around using adb shell
- Ctrl+C, which normally causes a graceful termination of the trace, is not
propagated by ADB when using
adb shell perfettobut only when using an interactive PTY-based session viaadb shell. - On non-rooted devices before Android 12, the config can only be passed as
cat config | adb shell perfetto -c -(-: stdin) because of over-restrictive SELinux rules. Since Android 12/data/misc/perfetto-configscan be used for storing configs. - On devices before Android 10, adb cannot directly pull
/data/misc/perfetto-traces. Useadb shell cat /data/misc/perfetto-traces/trace > traceto work around. - When capturing longer traces, e.g. in the context of benchmarks or CI, use
PID=$(perfetto --background)and thenkill $PIDto stop.