
Converting from Perfetto to other trace formats
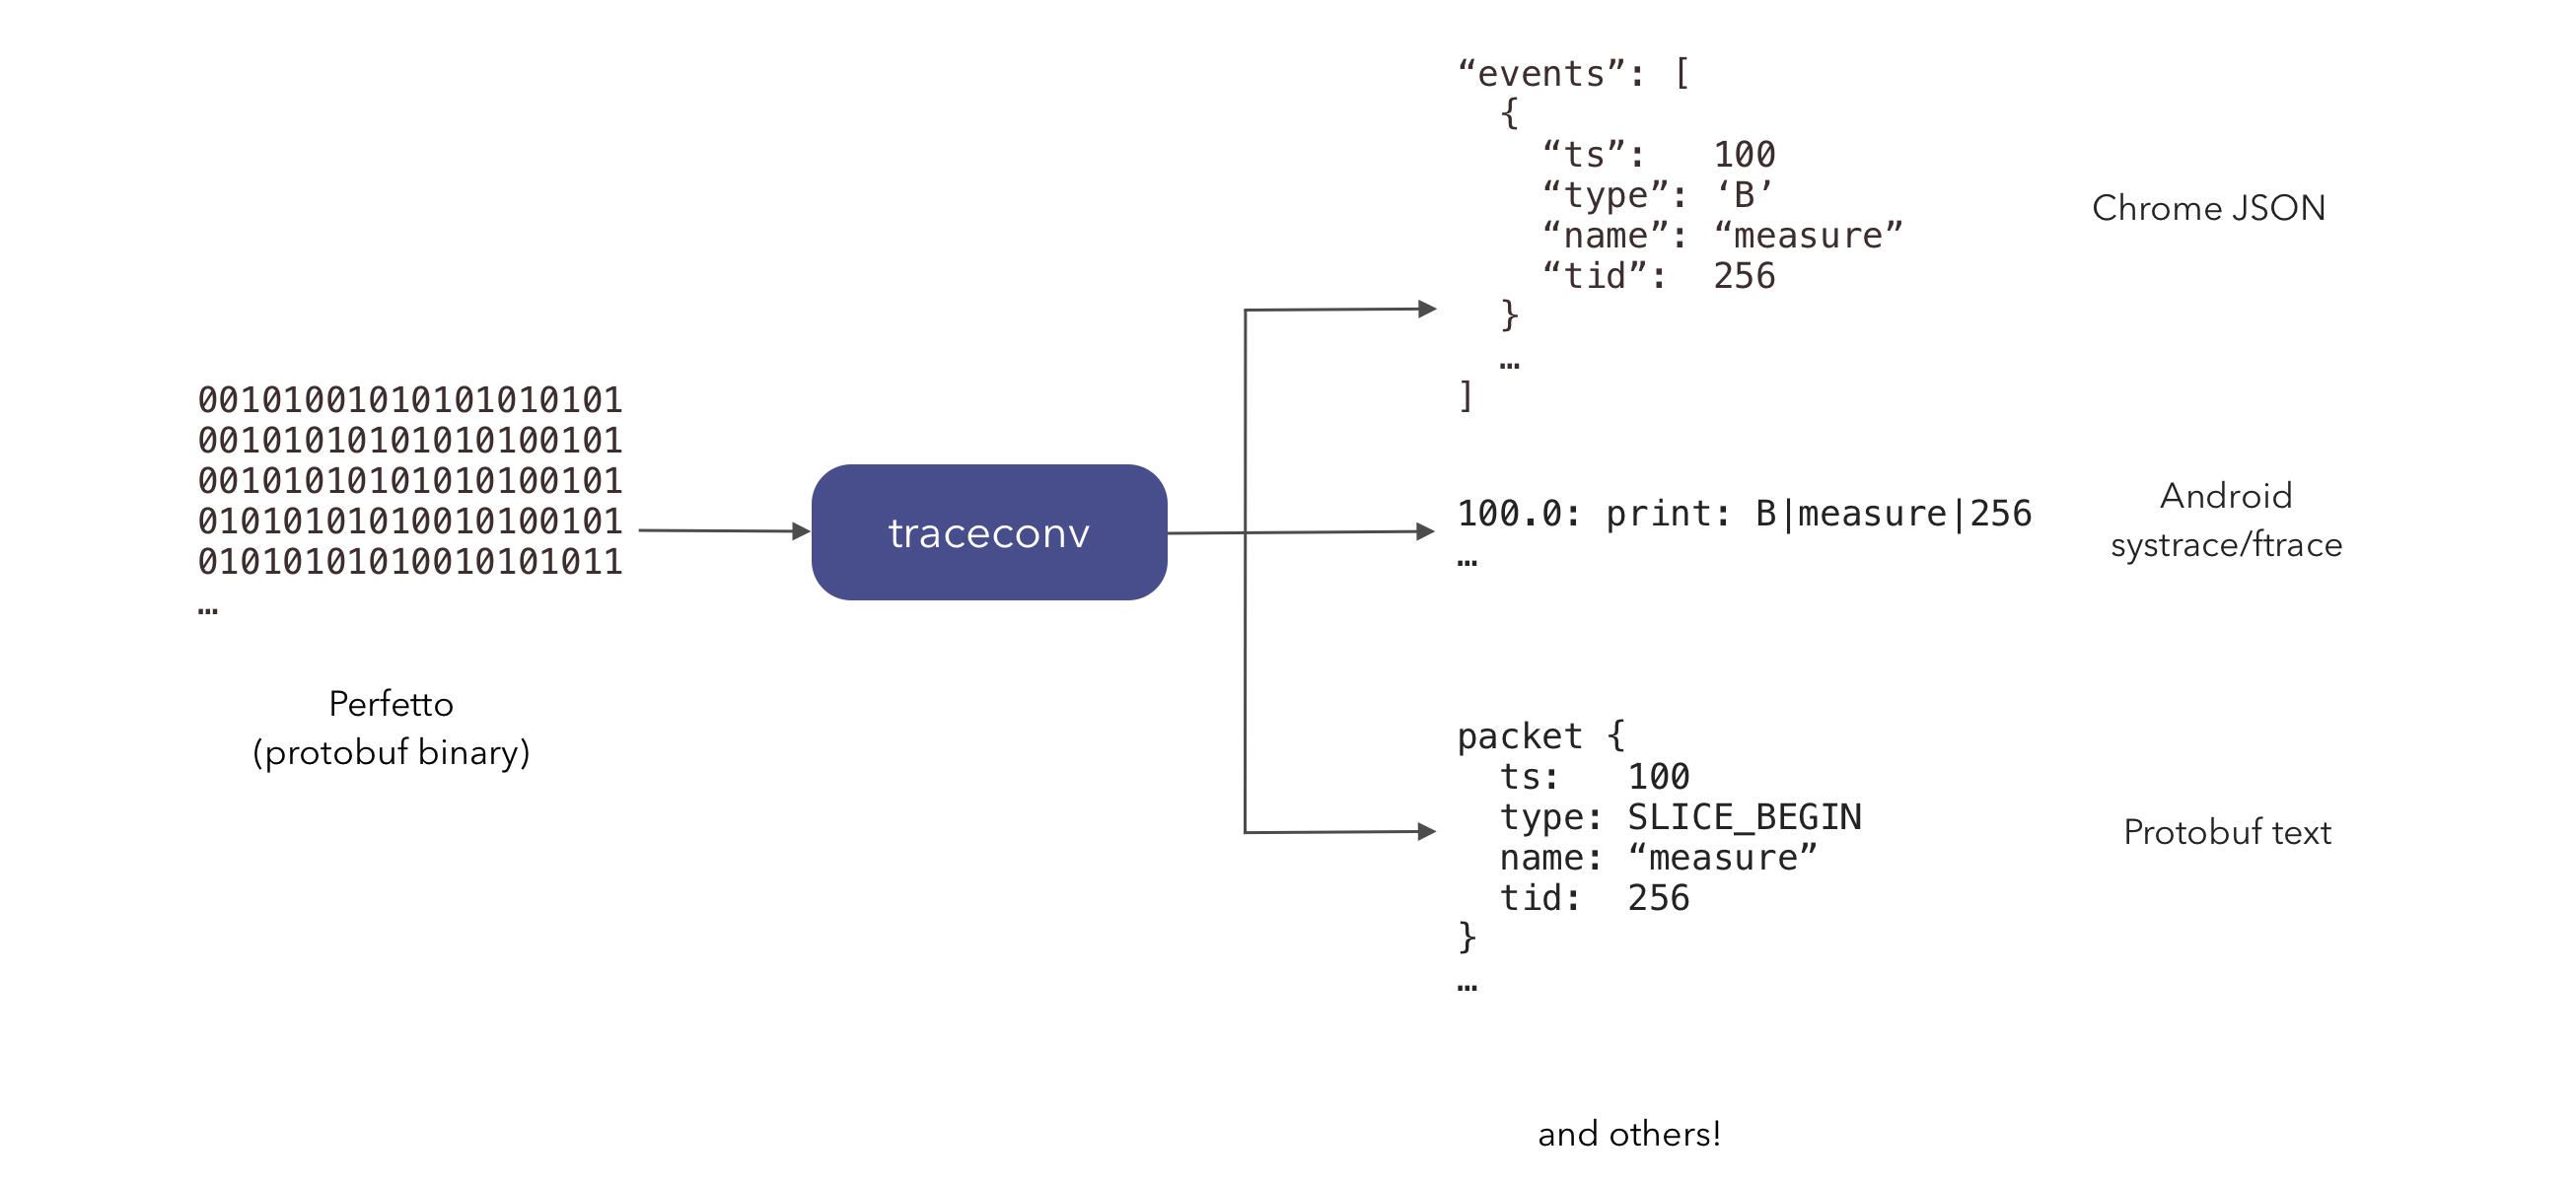
Perfetto's native protobuf trace format can be converted to other formats using
the traceconv utility. traceconv also doubles as a toolkit for
symbolizing/deobfuscating traces and for a handful of smaller trace-editing
utilities.
Prerequisites
- A host running Linux, macOS or Windows
- Python 3 (only required if using the
traceconvwrapper script below; on Windows this also requirescurl, which ships with Windows 10 and later) - A Perfetto protobuf trace file
traceconv has three groups of modes:
- Format conversion — convert a Perfetto protobuf trace into another trace format (Chrome JSON, systrace, pprof, Firefox profiler, etc.).
- Symbolization and deobfuscation — attach native symbols and
ProGuard/R8 mappings to a trace. In almost all cases you should use
bundle(see below), which packages the trace and all its debug artifacts into a single self-contained TAR — this is the recommended way to share or archive a trace. - Utilities — smaller helpers (protobuf-text ↔ binary conversion, packet decompression).
Usage
To use the latest binaries:
curl -LO https://get.perfetto.dev/traceconv
chmod +x traceconv
./traceconv MODE [OPTIONS] [input_file] [output_file]
curl.exe -LO https://get.perfetto.dev/traceconv
python traceconv MODE [OPTIONS] [input_file] [output_file]The traceconv script is a thin Python wrapper that downloads and caches
the correct native binary for your platform (including traceconv.exe on
Windows) under ~/.local/share/perfetto/prebuilts on first use.
traceconv reads from stdin and writes to stdout when the input or output
paths are omitted (or passed as -). Run ./traceconv with no arguments
to print the full list of modes and options supported by your version.
Format conversion
| Mode | Output |
|---|---|
text |
protobuf text format — a text representation of the protos |
json |
Chrome JSON format, viewable in chrome://tracing |
systrace |
ftrace text/HTML format used by Android systrace |
ctrace |
compressed systrace format |
profile |
aggregated pprof profile (heapprofd, perf, Java heap graphs) |
firefox |
Firefox profiler format |
Examples:
./traceconv json     trace.perfetto-trace trace.json
./traceconv systrace trace.perfetto-trace trace.html
./traceconv text     trace.perfetto-trace trace.textproto
profile writes one or more .pb files into a directory (a random tmp
directory by default) rather than a single output file, so use
--output-dir instead of a positional output path:
./traceconv profile --output-dir ./profiles trace.perfetto-trace
./traceconv profile --java-heap --pid 1234 --output-dir ./profiles trace.perfetto-trace
./traceconv profile --perf --timestamps 1000000,2000000 --output-dir ./profiles trace.perfetto-trace
Common options:
--truncate start|end(forsystrace,json,ctrace): keep only the start or end of the trace.--full-sort(forsystrace,json,ctrace): force full trace sorting.--skip-unknown(fortext): skip unknown proto fields.--alloc | --perf | --java-heap(forprofile): restrict to a single profile type (default: auto-detect).--no-annotations(forprofile): do not add derived annotations to frames.--pid/--timestamps(forprofile): filter by process or specific sample timestamps.--output-dir DIR(forprofile): output directory for the generated pprof files.
Symbolization and deobfuscation
These modes enrich a trace with native symbols and/or ProGuard/R8 deobfuscation mappings. For background on how Perfetto discovers symbol files and mapping files, see the Symbolization reference.
bundle (recommended)
bundle is the recommended entry point for symbolization and
deobfuscation. It packages the trace together with its native symbols
and ProGuard/R8 mappings into a single self-contained TAR, which is the
right artifact to share with teammates, attach to bugs, or archive for
later analysis. Prefer bundle over symbolize/deobfuscate unless you
have a specific reason not to.
./traceconv bundle trace.perfetto-trace trace.bundle.tar

# Provide extra symbol search paths or explicit ProGuard maps:
./traceconv bundle \
  --symbol-paths /path/to/symbols1,/path/to/symbols2 \
  --proguard-map com.example.app=/path/to/mapping.txt \
trace.perfetto-trace trace.bundle.tarbundle-specific options:
--symbol-paths PATH1,PATH2,...— additional paths to search for symbols (on top of the automatic discovery).--no-auto-symbol-paths— disable automatic symbol path discovery.--proguard-map [pkg=]PATH— ProGuard/R8mapping.txtfor Java/Kotlin deobfuscation. May be repeated; thepkg=prefix scopes the map to a specific package.--no-auto-proguard-maps— disable automatic ProGuard/R8 mapping discovery (e.g. Gradle project layout).--verbose— print more detailed output.
Note: bundle requires real file paths for both the input and the output
— it does not accept stdin/stdout.
The output TAR is a standard trace archive: the UI and Trace Processor open it directly, and the same mechanism also powers trace merging.
symbolize / deobfuscate (advanced)
Lower-level building blocks for pipelines that cannot use bundle. Each
emits a stream of packets (symbols or deobfuscation mappings) to a
separate output file:
./traceconv symbolize   trace.perfetto-trace symbols.pb
./traceconv deobfuscate trace.perfetto-trace mappings.pb
Prefer bundle — it produces a single self-contained TAR instead of
leaving you with loose side-car files to manage.
Utilities
| Mode | What it does |
|---|---|
binary |
Convert a protobuf text-format trace back into binary form. |
decompress_packets |
Decompress compressed TracePackets inside a trace. |
./traceconv binary             trace.textproto      trace.perfetto-trace
./traceconv decompress_packets trace.perfetto-trace trace.decompressed
Opening in the legacy systrace UI
If you just want to open a Perfetto trace with the legacy (Catapult) trace
viewer, you can just navigate to ui.perfetto.dev, and
use the "Open with legacy UI" link. This runs traceconv within the browser
using WebAssembly and passes the converted trace seamlessly to chrome://tracing.