
Memory: Callstack-based Allocation Profiling
NOTE: heapprofd requires Android 10 or higher
Heapprofd is a tool that tracks heap allocations & deallocations of an Android process within a given time period. The resulting profile can be used to attribute memory usage to particular call-stacks, supporting a mix of both native and java code. The tool can be used by Android platform and app developers to investigate memory issues.
By default, the tool records native allocations and deallocations done with malloc/free (or new/delete). It can be configured to record java heap memory allocations instead: see ART allocation profiling below.
On debug Android builds, you can profile all apps and most system services. On "user" builds, you can only use it on apps with the debuggable or profileable manifest flag.
Quickstart
See the Memory Guide for getting started with heapprofd.
UI
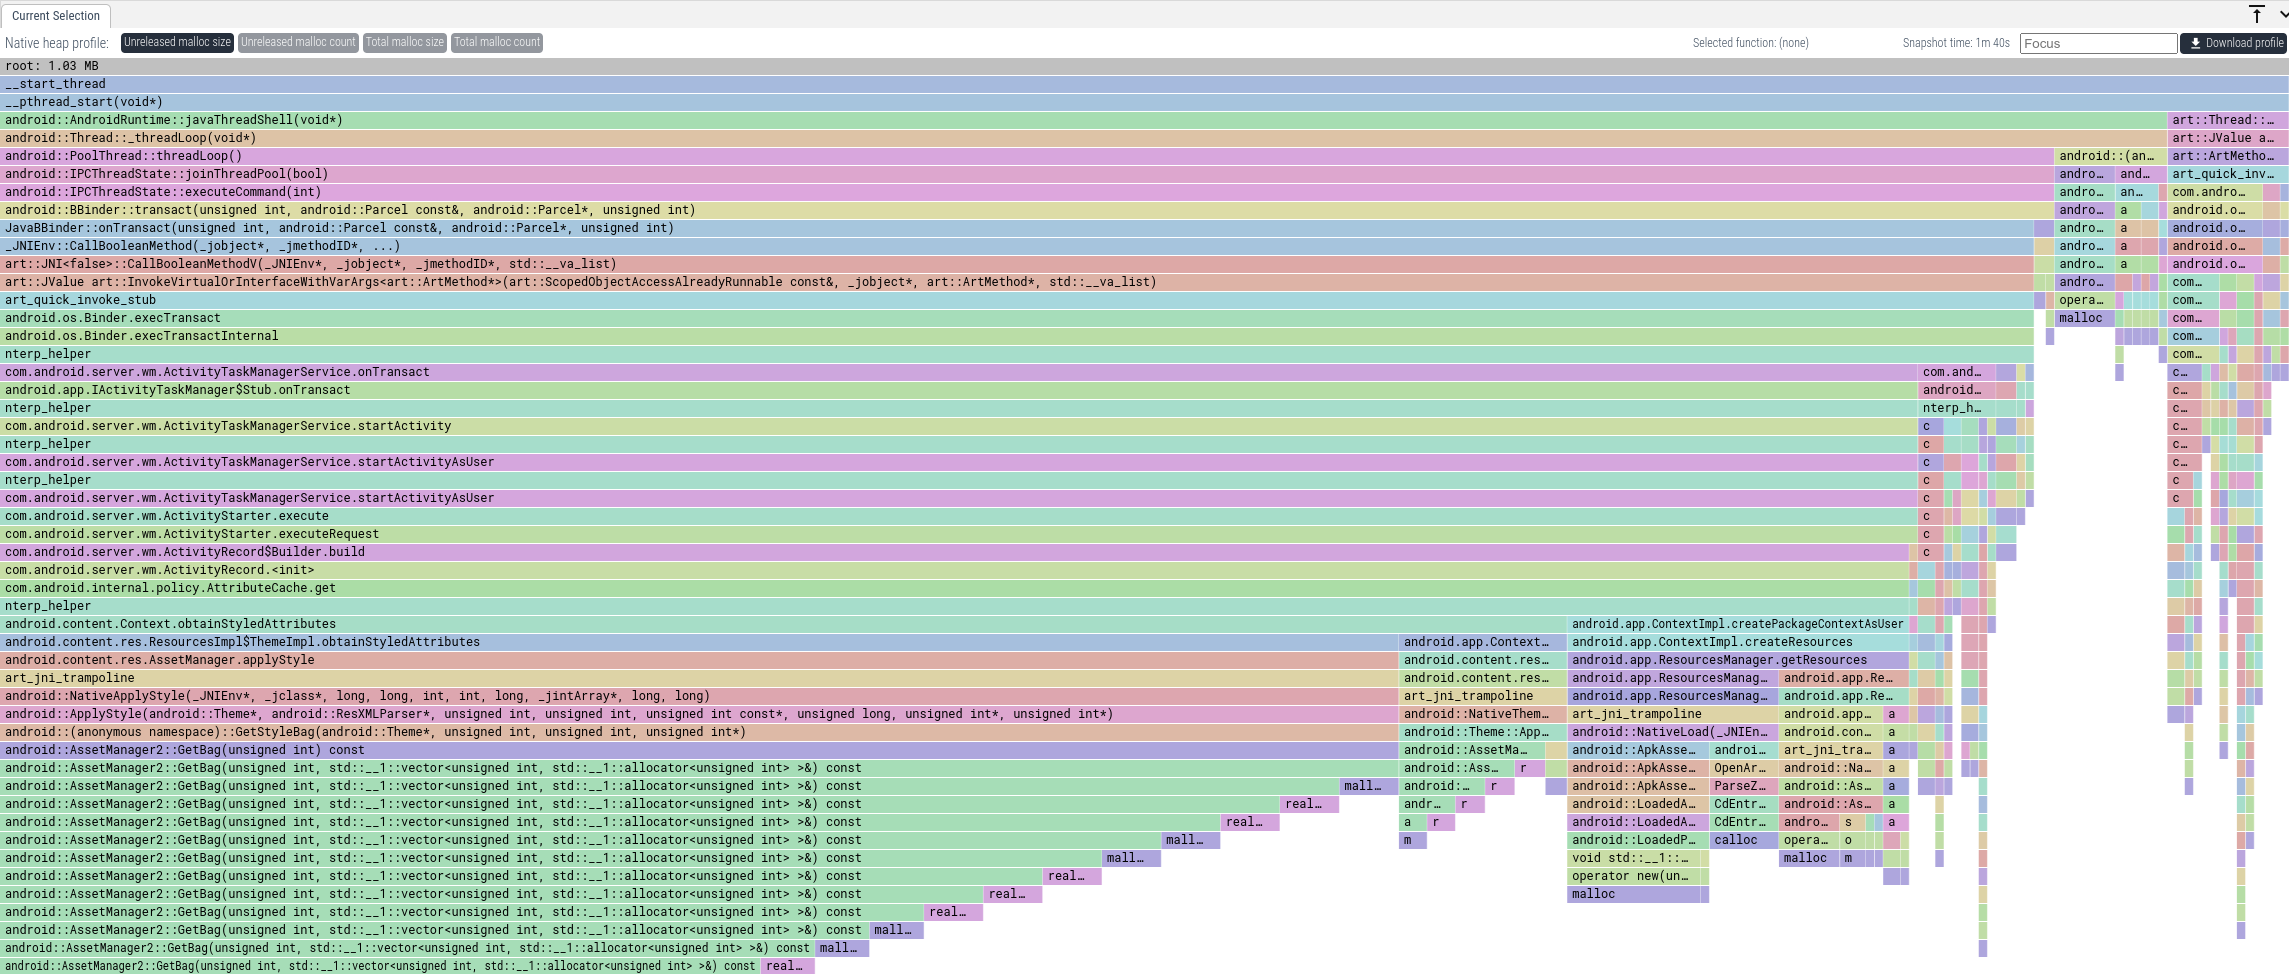
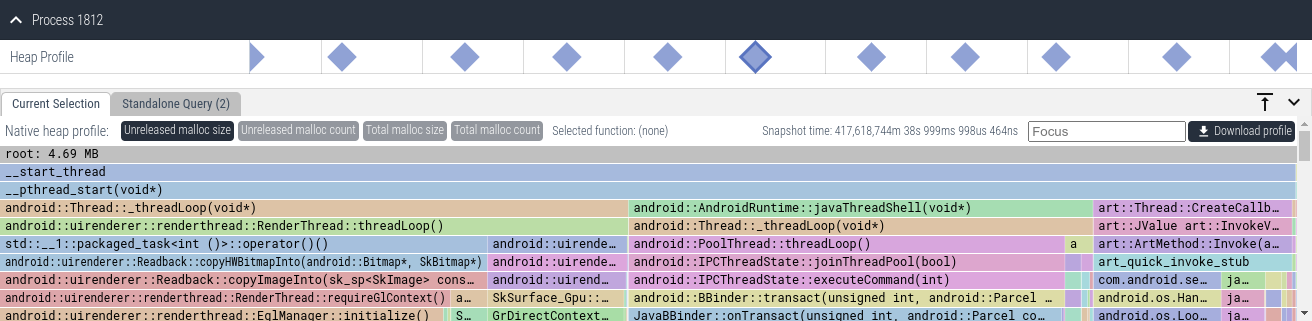
Dumps from heapprofd are shown as flamegraphs in the UI after clicking on the corresponding slice. Each slice represents a summary of the allocations and callstacks collected during the lifetime of that slice.

SQL
Information about callstacks is written to the following tables:
The allocations themselves are written to
heap_profile_allocation.
Offline symbolization data is stored in
stack_profile_symbol.
See Example Queries for example SQL queries.
Recording
Heapprofd can be configured and started in three ways.
Manual configuration
This requires manually setting the HeapprofdConfig section of the trace config. The only benefit of doing so is that in this way heap profiling can be enabled alongside any other tracing data sources.
Using the tools/heap_profile script (recommended)
You can use the tools/heap_profile script. If you are having trouble
make sure you are using the
latest version.
The script has two subcommands:
heap_profile android- profile a process on a connected Android device viaadb(default if no subcommand is given, preserving the historical invocation).heap_profile host- profile a local Linux process; see (non-Android) Linux support below.
For Android, you can target processes either by name (-n com.example.myapp)
or by PID (-p 1234). In the first case, the heap profile will be initiated
on both already-running processes that match the package name and new
processes launched after the profiling session is started.
For the full arguments list see the
heap_profile cmdline reference page.
You can use the Perfetto UI to visualize heap dumps.
Upload the raw-trace file in your output directory. You will see all heap
dumps as slices on the timeline, click any of them to get a flamegraph.
Using the Recording page of Perfetto UI
You can also use the Perfetto UI to record heapprofd profiles. Tick "Heap profiling" in the trace configuration, enter the processes you want to target, click "Add Device" to pair your phone, and record profiles straight from your browser. This is also possible on Windows.
Viewing the data
The resulting profile proto contains four views on the data, for each slice.
- Unreleased malloc size: how many bytes were allocated but not freed at this callstack, throughout the duration of the slice.
- Total malloc size: how many bytes were allocated (including ones with matching frees) at this callstack, throughout the duration of the slice.
- Unreleased malloc count: how many allocations without matching frees were done at this callstack, throughout the duration of the slice.
- Total malloc count: how many allocations (including ones with matching frees) were done at this callstack, throughout the duration of the slice.
TIP: you might want to put libart.so as a "Hide regex" when profiling apps.
TIP: Click Left Heavy on the top left for a good visualization.
Continuous dumps
By default, the heap profiler captures all the allocations from the beginning of the recording and stores a single snapshot, shown as a single slice in the UI, which summarizes all allocations/frees.
It is possible to configure the heap profiler to periodically (not just at the end of the trace) store snapshots (continuous dumps), for example every 5000ms
- By setting "Continuous dumps interval" in the UI to 5000.
- By addingin the HeapprofdConfig.
continuous_dump_config { dump_interval_ms: 5000 } - By adding
-c 5000to the invocation oftools/heap_profile android(ortools/heap_profile hostfor local Linux processes).
The resulting visualization shows multiple slices. Clicking on each slice shows a summary of the allocations/frees during that slice. You can drag & select multiple consecutive slices to summarize allocations during that window of time.
Sampling interval
Heapprofd samples heap allocations by hooking calls to malloc/free and C++'s operator new/delete. Given a sampling interval of n bytes, one allocation is sampled, on average, every n bytes allocated. This allows to reduce the performance impact on the target process. The default sampling rate is 4096 bytes.
The easiest way to reason about this is to imagine the memory allocations as a stream of one byte allocations. From this stream, every byte has a 1/n probability of being selected as a sample, and the corresponding callstack gets attributed the complete n bytes. For more accuracy, allocations larger than the sampling interval bypass the sampling logic and are recorded with their true size. See the heapprofd Sampling document for details.
Startup profiling
When specifying a target process name (as opposite to the PID), new processes matching that name are profiled from their startup. The resulting profile will contain all allocations done between the start of the process and the end of the profiling session.
On Android, Java apps are usually not exec()-ed from scratch, but fork()-ed from the zygote, which then specializes into the desired app. If the app's name matches a name specified in the profiling session, profiling will be enabled as part of the zygote specialization. The resulting profile contains all allocations done between that point in zygote specialization and the end of the profiling session. Some allocations done early in the specialization process are not accounted for.
At the trace proto level, the resulting ProfilePacket will have the
from_startup field set to true in the corresponding ProcessHeapSamples
message. This is not surfaced in the converted pprof compatible proto.
Runtime profiling
When a profiling session is started, all matching processes (by name or PID) are enumerated and are signalled to request profiling. Profiling isn't actually enabled until a few hundred milliseconds after the next allocation that is done by the application. If the application is idle when profiling is requested, and then does a burst of allocations, these may be missed.
The resulting profile will contain all allocations done between when profiling is enabled, and the end of the profiling session.
The resulting ProfilePacket will have from_startup set to false in the
corresponding ProcessHeapSamples message. This does not get surfaced in the
converted pprof compatible proto.
Concurrent profiling sessions
If multiple sessions name the same target process (either by name or PID), only the first relevant session will profile the process. The other sessions will report that the process had already been profiled when converting to the pprof compatible proto.
If you see this message but do not expect any other sessions, run
adb shell killall perfettoto stop any concurrent sessions that may be running.
The resulting ProfilePacket will have rejected_concurrent set to true in
otherwise empty corresponding ProcessHeapSamples message. This does not get
surfaced in the converted pprof compatible proto.
Target processes
Depending on the build of Android that heapprofd is run on, some processes are not be eligible to be profiled.
On user (i.e. production, non-rootable) builds, only Java applications with either the profileable or the debuggable manifest flag set can be profiled. Profiling requests for non-profileable/debuggable processes will result in an empty profile.
On userdebug builds, all processes except for a small set of critical
services can be profiled (to find the set of disallowed targets, look for
never_profile_heap in heapprofd.te.
This restriction can be lifted by disabling SELinux by running
adb shell su root setenforce 0 or by passing --disable-selinux to the
heap_profile script.
| userdebug setenforce 0 | userdebug | user | |
|---|---|---|---|
| critical native service | Y | N | N |
| native service | Y | Y | N |
| app | Y | Y | N |
| profileable app | Y | Y | Y |
| debuggable app | Y | Y | Y |
To mark an app as profileable, put <profileable android:shell="true"/> into
the <application> section of the app manifest.
<manifest ...>
    <application>
        <profileable android:shell="true"/>
        ...
    </application>
</manifest>
ART Allocation Profiling (Churn Profiling)
NOTE: Java allocation profiling is available on Android 12 or higher
NOTE: Java allocation profiling is not to be confused with Heap dumps
Heapprofd can be configured to track Java allocations instead of native ones.
- By setting adding
heaps: "com.android.art"in HeapprofdConfig. - By adding
--heaps com.android.artto the invocation oftools/heap_profile android.
Unlike ART heap dumps (which show the retention graph of a snapshot of the live objects) but like native heap profiles, ART allocation samples show callstacks of allocations over time of the entire profile.
ART allocation samples only show callstacks of when objects are created, not when they're deleted or garbage collected.
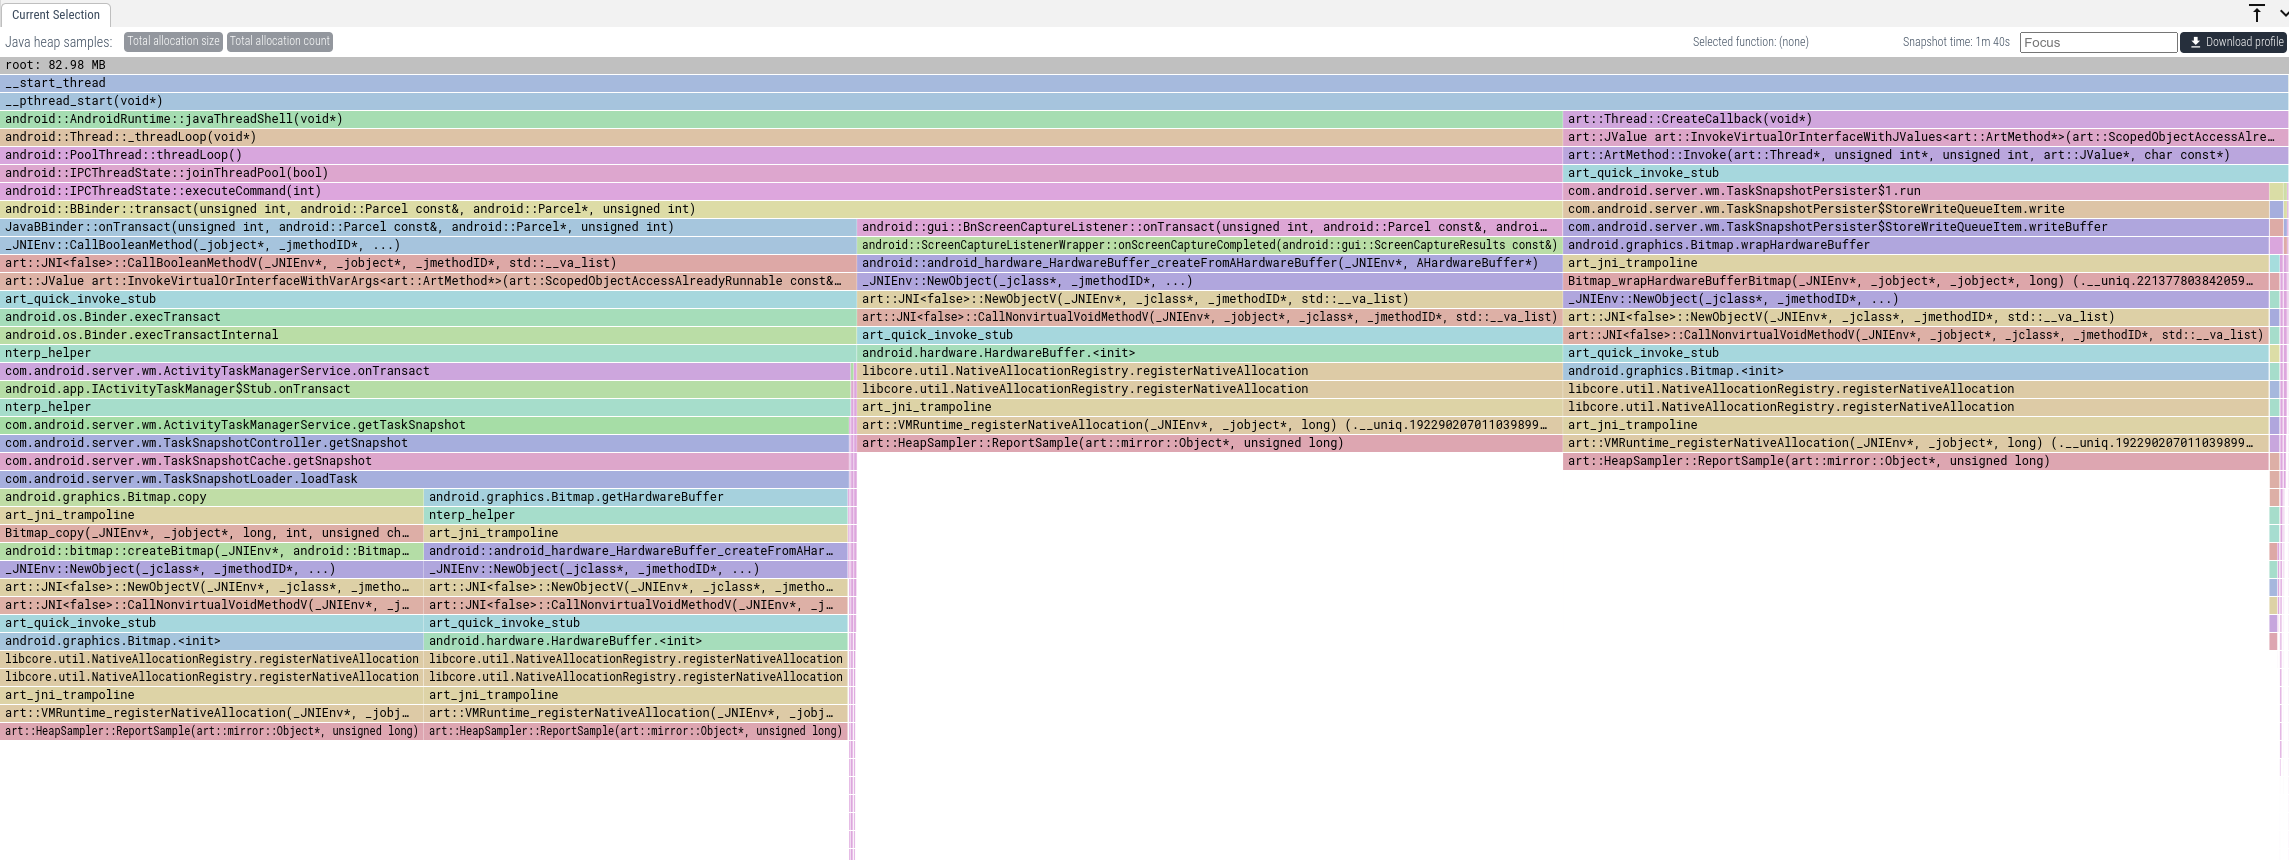
The resulting profile proto contains two views on the data:
- Total allocation size: how many bytes were allocated at this callstack over time of the profile until this point. The bytes might have been freed or not, the tool does not keep track of that.
- Total allocation count: how many object were allocated at this callstack over time of the profile until this point. The objects might have been freed or not, the tool does not keep track of that.
ART allocation samples are useful to understand memory churn showing the call stack of which parts of the code large allocations are attributed to as well as the allocation type from the ART runtime.
DEDUPED frames
If the name of a Java method includes [DEDUPED], this means that multiple
methods share the same code. ART only stores the name of a single one in its
metadata, which is displayed here. This is not necessarily the one that was
called.
Triggering heap snapshots on demand
Heap snapshot are recorded into the trace either at regular time intervals, if
using the continuous_dump_config field, or at the end of the session.
You can also trigger a snapshot of all currently profiled processes by running
adb shell killall -USR1 heapprofd. This can be useful in lab tests for
recording the current memory usage of the target in a specific state.
This dump will show up in addition to the dump at the end of the profile that is always produced. You can create multiple of these dumps, and they will be enumerated in the output directory.
Symbolization and deobfuscation
If your profile shows raw addresses or obfuscated Java/Kotlin names, run
traceconv bundle against the collected trace to produce an enriched
archive. See Symbolization and deobfuscation
for the full workflow, including the legacy PERFETTO_BINARY_PATH /
PERFETTO_PROGUARD_MAP approach.
Troubleshooting
Buffer overrun
If the rate of allocations is too high for heapprofd to keep up, the profiling
session will end early due to a buffer overrun. If the buffer overrun is
caused by a transient spike in allocations, increasing the shared memory buffer
size (passing --shmem-size to tools/heap_profile android /
tools/heap_profile host) can resolve the issue.
Otherwise the sampling interval can be increased (at the expense of lower
accuracy in the resulting profile) by passing --interval=16000 or higher.
Profile is empty
Check whether your target process is eligible to be profiled by consulting Target processes above.
Also check the Known Issues.
Implausible callstacks
If you see a callstack that seems to impossible from looking at the code, make sure no DEDUPED frames are involved.
Also, if your code is linked using Identical Code Folding
(ICF), i.e. passing -Wl,--icf=... to the linker, most trivial functions, often
constructors and destructors, can be aliased to binary-equivalent operators
of completely unrelated classes.
Symbolization issues
For "could not find library", Build ID mismatches and "only one frame shown" problems, see the troubleshooting section in Symbolization and deobfuscation.
(non-Android) Linux support
tools/heap_profile host -- ./my_binary --some-flagThe script:
- Auto-downloads
traceboxandlibheapprofd_glibc_preload.so(linux-amd64 / arm / arm64) into~/.local/share/perfetto/prebuilts/on first run. - Starts a bundled
traceddaemon viatracebox --system-sockets. - Launches the target binary with
LD_PRELOADpointing at the preload library andPERFETTO_HEAPPROFD_BLOCKING_INIT=1set. By default heapprofd initializes lazily to avoid blocking the main thread, which means startup allocations can be missed; setting this variable instead blocks the very firstmallocuntil heapprofd has fully attached, so every allocation is correctly tracked. - Waits for the target to exit (or
Ctrl-Cfrom you), then runstraceconvto produce gzipped pprof files alongside the raw trace.
If -n / --name is omitted, the process name defaults to the basename of
the binary you passed after --.
When the run completes the script prints the output directory:
Wrote profiles to /tmp/heap_profile-XXXXXX (symlink /tmp/heap_profile-latest)
The raw-trace and heap_dump.* (pprof) files can be visualized with https://ui.perfetto.dev.
Upload the raw-trace file to the Perfetto UI.
Using a custom-built preload library
If the prebuilt is not yet available for your platform, build the library
from a Perfetto checkout
(build instructions) and pass
it via --preload-library:
tools/setup_all_configs.py
tools/ninja -C out/linux_clang_release heapprofd_glibc_preload

tools/heap_profile host \
  --preload-library out/linux_clang_release/libheapprofd_glibc_preload.so \
  -- ./my_binary --some-flag
Known Issues
Android 13
- Unwinding java frames might not work properly, depending on the ART module version in use. The UI reports a single "unknown" frame at the top of the stack in this case. The problem is fixed in Android 13 QPR1.
Android 12
- Unwinding java frames might not work properly, depending on the ART module version in use. The UI reports a single "unknown" frame at the top of the stack in this case.
Android 11
- 32-bit programs cannot be targeted on 64-bit devices.
- Setting
sampling_interval_bytesto 0 crashes the target process. This is an invalid config that should be rejected instead. - For startup profiles, some frame names might be missing. This will be resolved in Android 12.
Failed to send control socket byte.is displayed in logcat at the end of every profile. This is benign.- The object count may be incorrect in
dump_at_maxprofiles. - Choosing a low shared memory buffer size and
block_clientmode might lock up the target process.
Android 10
- Function names in libraries with load bias might be incorrect. Use offline symbolization to resolve this issue.
- For startup profiles, some frame names might be missing. This will be resolved in Android 12.
- 32-bit programs cannot be targeted on 64-bit devices.
- x86 / x86_64 platforms are not supported. This includes the Android Cuttlefish. emulator.
- On ARM32, the bottom-most frame is always
ERROR 2. This is harmless and the callstacks are still complete. - If heapprofd is run standalone (by running
heapprofdin a root shell, rather than through init),/dev/socket/heapprofdget assigned an incorrect SELinux domain. You will not be able to profile any processes unless you disable SELinux enforcement. Runrestorecon /dev/socket/heapprofdin a root shell to resolve. - Using
vfork(2)orclone(2)withCLONE_VMand allocating / freeing memory in the child process will prematurely end the profile.java.lang.Runtime.execdoes this, calling it will prematurely end the profile. Note that this is in violation of the POSIX standard. - Setting
sampling_interval_bytesto 0 crashes the target process. This is an invalid config that should be rejected instead. Failed to send control socket byte.is displayed in logcat at the end of every profile. This is benign.- The object count may be incorrect in
dump_at_maxprofiles. - Choosing a low shared memory buffer size and
block_clientmode might lock up the target process.
Heapprofd vs malloc_info() vs RSS
When using heapprofd and interpreting results, it is important to know the precise meaning of the different memory metrics that can be obtained from the operating system.
heapprofd gives you the number of bytes the target program requested from the default C/C++ allocator. If you are profiling a Java app from startup, allocations that happen early in the application's initialization will not be visible to heapprofd. Native services that do not fork from the Zygote are not affected by this.
malloc_info is a libc function that gives you information about the
allocator. This can be triggered on userdebug builds by using
am dumpheap -m <PID> /data/local/tmp/heap.txt. This will in general be more
than the memory seen by heapprofd, depending on the allocator not all memory
is immediately freed. In particular, jemalloc retains some freed memory in
thread caches.
Heap RSS is the amount of memory requested from the operating system by the
allocator. This is larger than the previous two numbers because memory can only
be obtained in page size chunks, and fragmentation causes some of that memory to
be wasted. This can be obtained by running adb shell dumpsys meminfo <PID> and
looking at the "Private Dirty" column.
RSS can also end up being smaller than the other two if the device kernel uses
memory compression (ZRAM, enabled by default on recent versions of android) and
the memory of the process get swapped out onto ZRAM.
| heapprofd | malloc_info | RSS | |
|---|---|---|---|
| from native startup | x | x | x |
| after zygote init | x | x | x |
| before zygote init | x | x | |
| thread caches | x | x | |
| fragmentation | x |
If you observe high RSS or malloc_info metrics but heapprofd does not match, you might be hitting some pathological fragmentation problem in the allocator.
Convert to pprof
You can use traceconv to convert the heap dumps in a trace into the pprof format:
tools/traceconv profile /tmp/profileThis will create a directory in /tmp/ containing the heap dumps. Run:
gzip /tmp/heap_profile-XXXXXX/*.pbto get gzipped protos, which tools handling pprof profile protos expect.
Example SQL Queries
We can get the callstacks that allocated using an SQL Query in the
Trace Processor. For each frame, we get one row for the number of allocated
bytes, where count and size is positive, and, if any of them were already
freed, another line with negative count and size. The sum of those gets us
the Unreleased malloc size view.
select a.callsite_id, a.ts, a.upid, f.name, f.rel_pc, m.build_id, m.name as mapping_name,
        sum(a.size) as space_size, sum(a.count) as space_count
      from heap_profile_allocation a join
           stack_profile_callsite c ON (a.callsite_id = c.id) join
           stack_profile_frame f ON (c.frame_id = f.id) join
           stack_profile_mapping m ON (f.mapping = m.id)
group by 1, 2, 3, 4, 5, 6, 7 order by space_size desc;| callsite_id | ts | upid | name | rel_pc | build_id | mapping_name | space_size | space_count |
|---|---|---|---|---|---|---|---|---|
| 6660 | 5 | 1 | malloc | 244716 | 8126fd.. | /apex/com.android.runtime/lib64/bionic/libc.so | 106496 | 4 |
| 192 | 5 | 1 | malloc | 244716 | 8126fd.. | /apex/com.android.runtime/lib64/bionic/libc.so | 26624 | 1 |
| 1421 | 5 | 1 | malloc | 244716 | 8126fd.. | /apex/com.android.runtime/lib64/bionic/libc.so | 26624 | 1 |
| 1537 | 5 | 1 | malloc | 244716 | 8126fd.. | /apex/com.android.runtime/lib64/bionic/libc.so | 26624 | 1 |
| 8843 | 5 | 1 | malloc | 244716 | 8126fd.. | /apex/com.android.runtime/lib64/bionic/libc.so | 26424 | 1 |
| 8618 | 5 | 1 | malloc | 244716 | 8126fd.. | /apex/com.android.runtime/lib64/bionic/libc.so | 24576 | 4 |
| 3750 | 5 | 1 | malloc | 244716 | 8126fd.. | /apex/com.android.runtime/lib64/bionic/libc.so | 12288 | 1 |
| 2820 | 5 | 1 | malloc | 244716 | 8126fd.. | /apex/com.android.runtime/lib64/bionic/libc.so | 8192 | 2 |
| 3788 | 5 | 1 | malloc | 244716 | 8126fd.. | /apex/com.android.runtime/lib64/bionic/libc.so | 8192 | 2 |
We can see all the functions are "malloc" and "realloc", which is not terribly informative. Usually we are interested in the cumulative bytes allocated in a function (otherwise, we will always only see malloc / realloc). Chasing the parent_id of a callsite (not shown in this table) recursively is very hard in SQL. However, we have a helper table in the standard library which does this for you.
INCLUDE PERFETTO MODULE android.memory.heap_profile.summary_tree;

SELECT
  -- The function name of the frame for this callstack.
  name,
  -- The name of the mapping containing the frame. This
  -- can be a native binary, library, JAR or APK.
  mapping_name AS map_name,
  -- The amount of memory allocated and *not freed* with this
  -- function appearing anywhere on the callstack.
  cumulative_size
FROM android_heap_profile_summary_tree;
order by abs(cumulative_size) desc;| name | map_name | cumulative_size |
|---|---|---|
| __start_thread | /apex/com.android.runtime/lib64/bionic/libc.so | 392608 |
| _ZL15__pthread_startPv | /apex/com.android.runtime/lib64/bionic/libc.so | 392608 |
| _ZN13thread_data_t10trampolineEPKS | /system/lib64/libutils.so | 199496 |
| _ZN7android14AndroidRuntime15javaThreadShellEPv | /system/lib64/libandroid_runtime.so | 199496 |
| _ZN7android6Thread11_threadLoopEPv | /system/lib64/libutils.so | 199496 |
| _ZN3art6Thread14CreateCallbackEPv | /apex/com.android.art/lib64/libart.so | 193112 |
| _ZN3art35InvokeVirtualOrInterface... | /apex/com.android.art/lib64/libart.so | 193112 |
| _ZN3art9ArtMethod6InvokeEPNS_6ThreadEPjjPNS_6JValueEPKc | /apex/com.android.art/lib64/libart.so | 193112 |
| art_quick_invoke_stub | /apex/com.android.art/lib64/libart.so | 193112 |