CPU Scheduling events
On Android and Linux Perfetto can gather scheduler traces via the Linux Kernel ftrace infrastructure.
This allows to get fine grained scheduling events such as:
- Which threads were scheduled on which CPU core at any point in time, with nanosecond accuracy.
- The reason why a running thread got descheduled (e.g. pre-emption, blocked on a mutex, blocking syscall or any other wait queue).
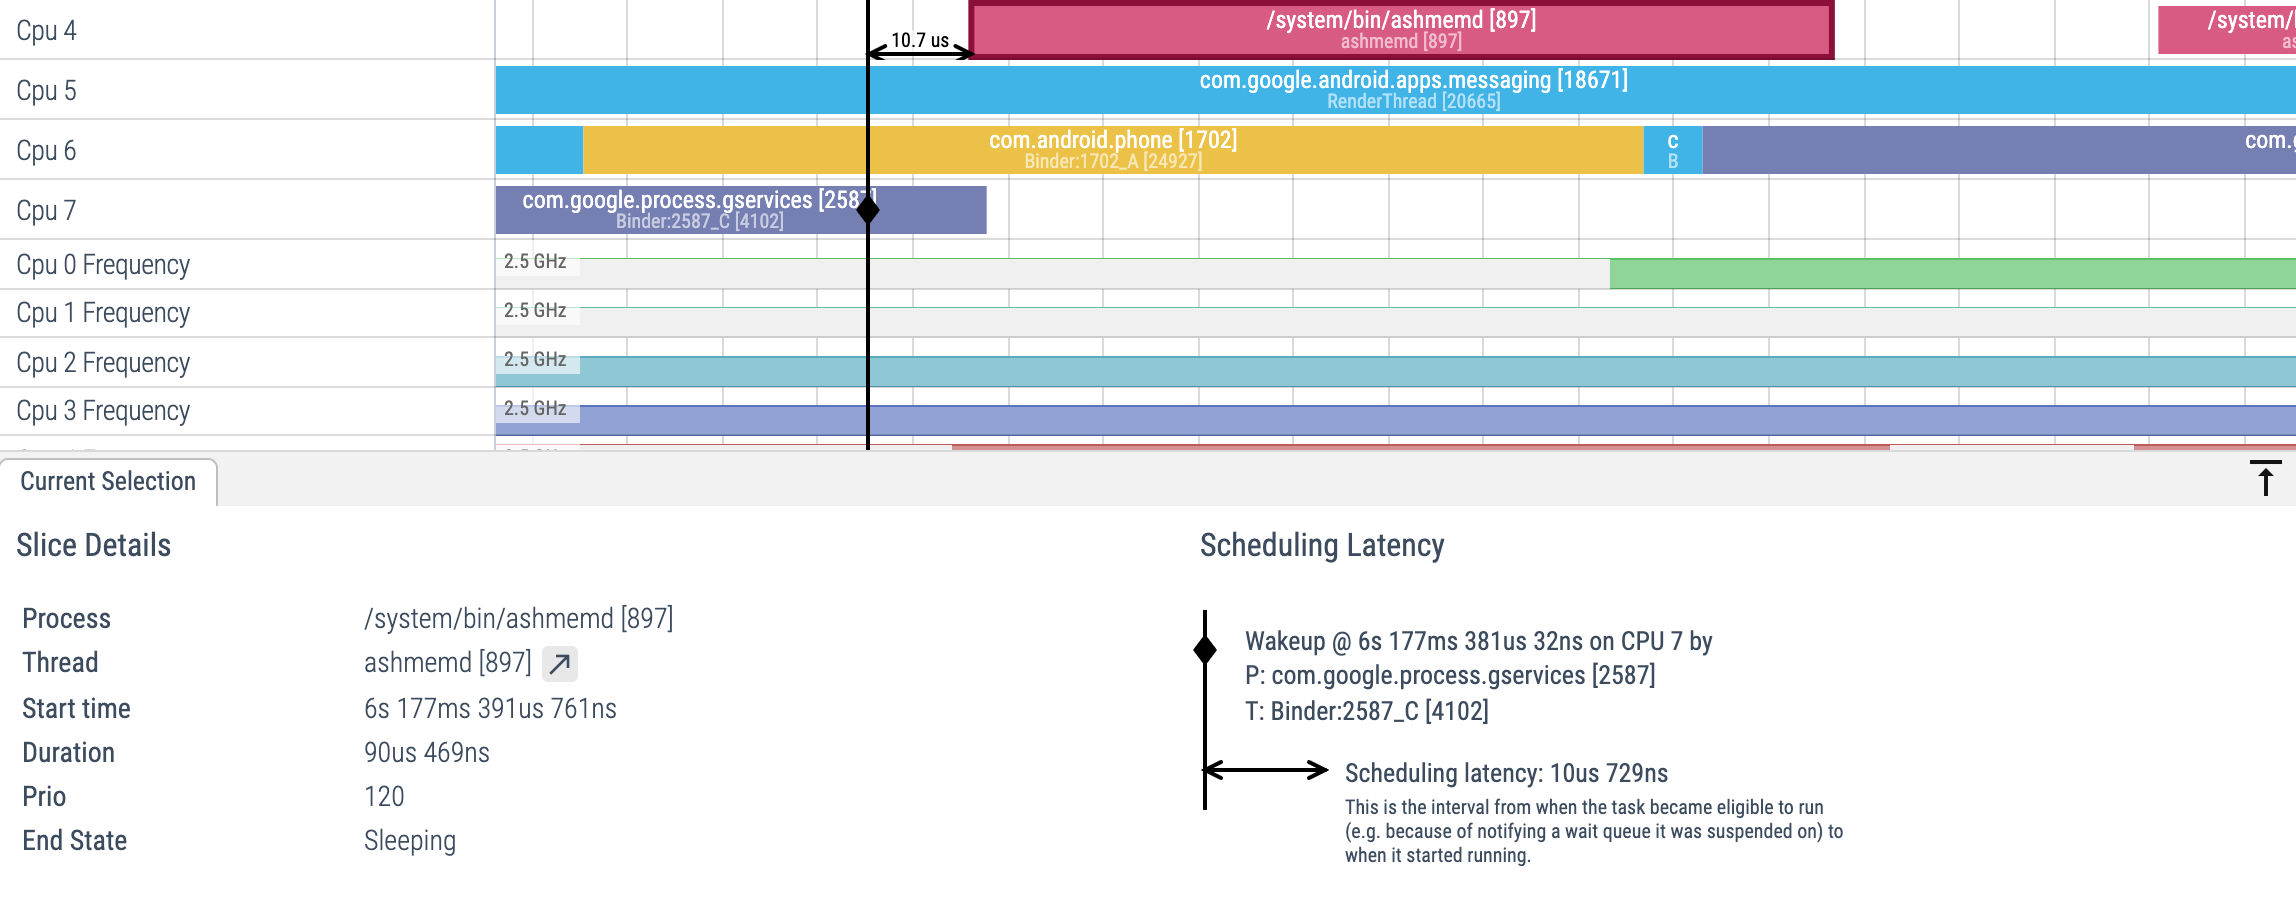
- The point in time when a thread became eligible to be executed, even if it was not put immediately on any CPU run queue, together with the source thread that made it executable.
UI
The UI represents individual scheduling events as slices:

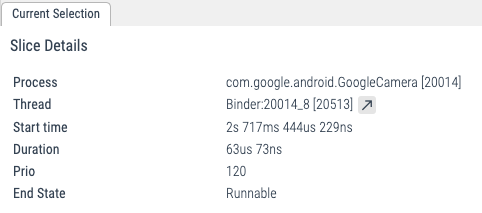
Clicking on a CPU slice shows the relevant information in the details panel:

Scrolling down, when expanding individual processes, the scheduling events also create one track for each thread, which allows to follow the evolution of the state of individual threads:

SQL
At the SQL level, the scheduling data is exposed in the
sched_slice table.
select ts, dur, cpu, end_state, priority, process.name, thread.name
from sched_slice left join thread using(utid) left join process using(upid)| ts | dur | cpu | end_state | priority | process.name, | thread.name |
|---|---|---|---|---|---|---|
| 261187012170995 | 247188 | 2 | S | 130 | /system/bin/logd | logd.klogd |
| 261187012418183 | 12812 | 2 | D | 120 | /system/bin/traced_probes | traced_probes0 |
| 261187012421099 | 220000 | 4 | D | 120 | kthreadd | kworker/u16:2 |
| 261187012430995 | 72396 | 2 | D | 120 | /system/bin/traced_probes | traced_probes1 |
| 261187012454537 | 13958 | 0 | D | 120 | /system/bin/traced_probes | traced_probes0 |
| 261187012460318 | 46354 | 3 | S | 120 | /system/bin/traced_probes | traced_probes2 |
| 261187012468495 | 10625 | 0 | R | 120 | [NULL] | swapper/0 |
| 261187012479120 | 6459 | 0 | D | 120 | /system/bin/traced_probes | traced_probes0 |
| 261187012485579 | 7760 | 0 | R | 120 | [NULL] | swapper/0 |
| 261187012493339 | 34896 | 0 | D | 120 | /system/bin/traced_probes | traced_probes0 |
TraceConfig
To collect this data, include the following data sources:
# Scheduling data from the kernel.
data_sources: {
  config {
    name: "linux.ftrace"
    ftrace_config {
      compact_sched: {
        enabled: true
      }
      ftrace_events: "sched/sched_switch"
      # optional: precise thread lifetime tracking:
      ftrace_events: "sched/sched_process_exit"
      ftrace_events: "sched/sched_process_free"
      ftrace_events: "task/task_newtask"
      ftrace_events: "task/task_rename"
    }
  }
}

# Adds full process names and thread<>process relationships:
data_sources: {
  config {
    name: "linux.process_stats"
  }
}
Scheduling wakeups and latency analysis
By further enabling the following in the TraceConfig, the ftrace data source will record also scheduling wake up events:
  ftrace_events: "sched/sched_wakeup_new"
  ftrace_events: "sched/sched_waking"
While sched_switch events are emitted only when a thread is in the
R(unnable) state AND is running on a CPU run queue, sched_waking events are
emitted when any event causes a thread state to change.
Consider the following example:
Thread A
condition_variable.wait()
                                     Thread B
                                     condition_variable.notify()
When Thread A suspends on the wait() it will enter the state S(sleeping) and
get removed from the CPU run queue. When Thread B notifies the variable, the
kernel will transition Thread A into the R(unnable) state. Thread A at that
point is eligible to be put back on a run queue. However this might not happen
for some time because, for instance:
- All CPUs might be busy running some other thread, and Thread A needs to wait to get a run queue slot assigned (or the other threads have higher priority).
- Some other CPUs other than the current one, but the scheduler load balancer might take some time to move the thread on another CPU.
Unless using real-time thread priorities, most Linux Kernel scheduler configurations are not strictly work-conserving. For instance the scheduler might prefer to wait some time in the hope that the thread running on the current CPU goes to idle, avoiding a cross-cpu migration which might be more costly both in terms of overhead and power.
NOTE: sched_waking and sched_wakeup provide nearly the same information. The
difference lies in wakeup events across CPUs, which involve
inter-processor interrupts. The former is always emitted on the source (wakee)
CPU, the latter may be executed on either the source or the destination (waked) CPU
depending on several factors. sched_waking is usually sufficient for latency
analysis, unless you are looking into breaking down latency due to
the scheduler's wake up path, such as inter-processor signaling.
When enabling sched_waking events, the following will appear in the UI when
selecting a CPU slice:

Decoding end_state
The sched_slice table contains information on scheduling activity of the system:
> select * from sched_slice limit 1
id  type        ts          dur    cpu utid end_state priority
0   sched_slice 70730062200 125364 0   1    S         130
Each row of the table shows when a given thread (utid) began running
(ts), on which core it ran (cpu), for how long it ran (dur),
and why it stopped running: end_state.
end_state is encoded as one or more ascii characters. The UI uses
the following translations to convert end_state into human readable
text:
| end_state | Translation |
|---|---|
| R | Runnable |
| R+ | Runnable (Preempted) |
| S | Sleeping |
| D | Uninterruptible Sleep |
| T | Stopped |
| t | Traced |
| X | Exit (Dead) |
| Z | Exit (Zombie) |
| x | Task Dead |
| I | Idle |
| K | Wake Kill |
| W | Waking |
| P | Parked |
| N | No Load |
Not all combinations of characters are meaningful.
If we do not know when the scheduling ended (for example because the
trace ended while the thread was still running) end_state will be
NULL and dur will be -1.
