
Advanced Guide to Programmatic Trace Generation
This page serves as an advanced reference for programmatically creating Perfetto trace files. It builds upon the foundational concepts and examples presented in "Converting arbitrary timestamped data to Perfetto".
We assume you are familiar with:
- The basic structure of Perfetto traces (a
Tracemessage containing a stream ofTracePacketmessages). - Using the
TrackEventpayload withinTracePacketto create custom tracks with various types of slices (simple, nested, asynchronous), counters, and flows. - The Python script template (
trace_converter_template.py) for generating traces, and that the Python examples provided here are intended to be used within itspopulate_packets(builder)function.
This guide will currently focus on advanced TrackEvent features, such as:
- Associating your timeline data with operating system (OS) processes and threads for richer integration.
- Explicit track sorting and data interning for optimizing trace size and detail.
While TrackEvent is a primary method for representing timeline data,
TracePacket is a versatile container. In the future, this guide may expand to
cover other TracePacket payloads useful for synthetic trace generation.
The examples will continue to use Python, but the principles apply to any language with Protocol Buffer support. For complete definitions of all available fields, always refer to the official Perfetto protobuf sources, particularly TracePacket and its various sub-messages, including TrackEvent.
Associating Tracks with Operating System Concepts
While the "Converting arbitrary timestamped data to Perfetto" guide demonstrated creating generic custom tracks, you can provide more specific context to Perfetto by associating your tracks with operating system (OS) processes and threads. This allows Perfetto's UI and analysis tools to offer richer integration and better correlation with other system-wide data.
Associating Tracks with Processes
You can create a top-level track that represents an OS process. Any other custom tracks (which might contain slices or counters) can then be parented to this process track. This helps in:
- UI Grouping: Your custom tracks will appear under the specified process name and PID in the Perfetto UI, alongside any other data collected for that process (e.g., CPU scheduling, memory counters).
- Correlation: Events on your custom tracks can be more easily correlated with system-level activity related to that process.
- Clear Identification: Explicitly naming the process and providing its PID makes it unambiguous which process your custom data pertains to.
To define a process track, you populate the process field within its
TrackDescriptor. At a minimum, you should provide a pid and ideally a
process_name.
It is also recommended to add a timestamp to the TracePacket containing the
process's TrackDescriptor. This is especially important when the trace
contains data from other sources (e.g. scheduling information from the kernel).
Unlike with "global" tracks, these track types may interact with other data
sources and as such having a timestamp makes sure that Trace Processor can
accurately sort the descriptor into the right place.
Python Example
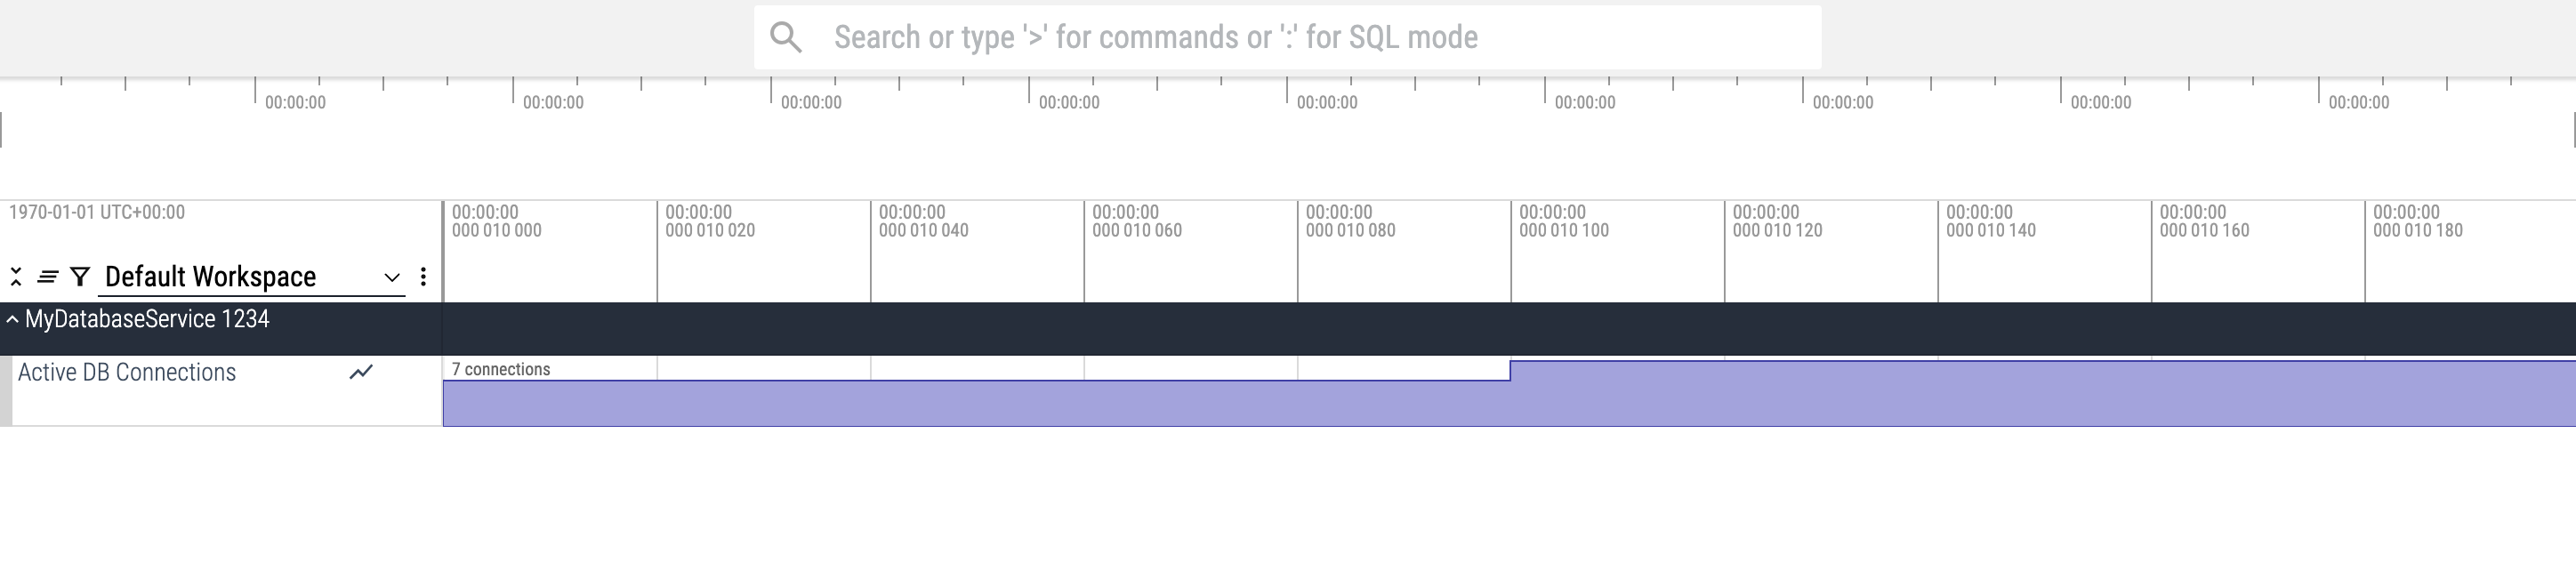
Let's say you want to emit a custom counter (e.g. "Active DB Connections") and have it appear under a specific process named "MyDatabaseService" with PID 1234.
Copy the following Python code into the populate_packets(builder) function in
your trace_converter_template.py script.
Click to expand/collapse Python code
    TRUSTED_PACKET_SEQUENCE_ID = 8008

    # --- Define OS Process ---
    PROCESS_ID = 1234
    PROCESS_NAME = "MyDatabaseService"

    # Define a UUID for the process track
    process_track_uuid = uuid.uuid4().int & ((1 << 63) - 1)

    # 1. Define the Process Track
    # This packet establishes "MyDatabaseService (1234)" in the trace.
    packet = builder.add_packet()
    # It's good practice to timestamp the descriptor to be before the first
    # event.
    packet.timestamp = 9999
    desc = packet.track_descriptor
    desc.uuid = process_track_uuid
    desc.process.pid = PROCESS_ID
    desc.process.process_name = PROCESS_NAME
    # This track itself usually doesn't have events, it serves as a parent.

    # --- Define a Custom Counter Track parented to the Process ---
    db_connections_counter_track_uuid = uuid.uuid4().int & ((1 << 63) - 1)

    packet = builder.add_packet()
    desc = packet.track_descriptor
    desc.uuid = db_connections_counter_track_uuid
    desc.parent_uuid = process_track_uuid # Link to the process track
    desc.name = "Active DB Connections"
    # Mark this track as a counter track
    desc.counter.unit_name = "connections" # Optional: specify units

    # Helper to add a counter event
    def add_counter_event(ts, value, counter_track_uuid):
        packet = builder.add_packet()
        packet.timestamp = ts
        packet.track_event.type = TrackEvent.TYPE_COUNTER
        packet.track_event.track_uuid = counter_track_uuid
        packet.track_event.counter_value = value
        packet.trusted_packet_sequence_id = TRUSTED_PACKET_SEQUENCE_ID

    # 3. Emit counter values on the custom counter track
    add_counter_event(ts=10000, value=5, counter_track_uuid=db_connections_counter_track_uuid)
    add_counter_event(ts=10100, value=7, counter_track_uuid=db_connections_counter_track_uuid)
    add_counter_event(ts=10200, value=6, counter_track_uuid=db_connections_counter_track_uuid)
If you only have symbolized function names, call add_frame(...) with just the
interned function name ID: e.g. add_frame(packet.interned_data, FRAME_MAIN, FUNC_MAIN).
You can query process-associated counter data using SQL in the Perfetto UI's Query tab or with Trace Processor:
SELECT counter.ts, counter.value, process.name AS process_name
FROM counter
JOIN process_counter_track ON counter.track_id = process_counter_track.id
JOIN process USING(upid)
WHERE process.pid = 1234;
Once you have defined a process track, you can parent various other kinds of tracks to it. This includes tracks for specific threads within that process (see next section), as well as custom tracks for process-wide counters (as shown above) or groups of asynchronous operations related to this process (using the techniques for asynchronous slices described in the "Converting arbitrary timestamped data to Perfetto" guide).
For details on how to explicitly control the display order of process tracks, see Controlling Track Sorting Order.
Associating Tracks with Threads
You can create tracks that are explicitly associated with specific threads within an OS process. This is the most common way to represent thread-specific activity, such as function call stacks or thread-local counters.
Benefits:
- Correct UI Placement: When a thread track's
pidandtidare specified in itsTrackDescriptor, the Perfetto UI typically groups it under the corresponding process (identified by thatpid). This helps organize the trace. - Correlation with System Data: Perfetto can automatically correlate events on your thread track with system-level data for that thread, such as CPU scheduling slices.
- Clear Naming: You can provide a human-readable name for your thread.
To define a thread track:
- Create a
TrackDescriptorfor the thread. - Populate its
threadfield, providing thepidof the process this thread belongs to and the uniquetidof the thread. You should also setthread_name. - Optionally and encouraged, you can also define a separate
TrackDescriptorfor the parent process itself (using itsprocessfield andpid), though it's not strictly required for the thread track to be recognized as a thread of that PID. The UI often infers process groupings from PIDs present in thread tracks.
Similarly to process tracks, it is also recommended to add a timestamp to the
TracePacket containing the thread's TrackDescriptor. This is especially
important when the trace contains data from other sources (e.g. scheduling
information from the kernel). Unlike with "global" tracks, these track types may
interact with other data sources and as such having a timestamp makes sure that
Trace Processor can accurately sort the descriptor into the right place.
Python Example: Thread-Specific Slices
This example defines a thread "MainWorkLoop" (TID 5678) belonging to process
"MyApplication" (PID 1234). It then emits a couple of slices directly onto this
thread's track. We also define a track for the process itself for clarity,
though the thread track's association is primarily through its pid and tid
fields.
Copy the following Python code into the populate_packets(builder) function in
your trace_converter_template.py script.
Click to expand/collapse Python code
    TRUSTED_PACKET_SEQUENCE_ID = 8009

    # --- Define OS Process and Thread IDs and Names ---
    APP_PROCESS_ID = 1234
    APP_PROCESS_NAME = "MyApplication"
    MAIN_THREAD_ID = 5678
    MAIN_THREAD_NAME = "MainWorkLoop"

    # --- Define UUIDs for the tracks ---
    # While not strictly necessary to parent a thread track to a process track
    # for the UI to group them by PID, defining a process track can be good practice
    # if you want to name the process explicitly or attach process-scoped tracks later.
    app_process_track_uuid = uuid.uuid4().int & ((1 << 63) - 1)
    main_thread_track_uuid = uuid.uuid4().int & ((1 << 63) - 1)

    # 1. Define the Process Track (Optional, but good for naming the process)
    packet = builder.add_packet()
    packet.timestamp = 14998
    desc = packet.track_descriptor
    desc.uuid = app_process_track_uuid
    desc.process.pid = APP_PROCESS_ID
    desc.process.process_name = APP_PROCESS_NAME

    # 2. Define the Thread Track
    # The .thread.pid field associates it with the process.
    # No parent_uuid is set here; UI will group by PID.
    packet = builder.add_packet()
    packet.timestamp = 14999
    desc = packet.track_descriptor
    desc.uuid = main_thread_track_uuid
    # desc.parent_uuid = app_process_track_uuid # This line is NOT used
    desc.thread.pid = APP_PROCESS_ID
    desc.thread.tid = MAIN_THREAD_ID
    desc.thread.thread_name = MAIN_THREAD_NAME

    # Helper to add a slice event to a specific track
    def add_slice_event(ts, event_type, event_track_uuid, name=None):
        packet = builder.add_packet()
        packet.timestamp = ts
        packet.track_event.type = event_type
        packet.track_event.track_uuid = event_track_uuid
        if name:
            packet.track_event.name = name
        packet.trusted_packet_sequence_id = TRUSTED_PACKET_SEQUENCE_ID

    # 3. Emit slices on the main_thread_track_uuid
    add_slice_event(ts=15000, event_type=TrackEvent.TYPE_SLICE_BEGIN,
                    event_track_uuid=main_thread_track_uuid, name="ProcessInputEvent")
    # Nested slice
    add_slice_event(ts=15050, event_type=TrackEvent.TYPE_SLICE_BEGIN,
                    event_track_uuid=main_thread_track_uuid, name="UpdateState")
    add_slice_event(ts=15150, event_type=TrackEvent.TYPE_SLICE_END, # Ends UpdateState
                    event_track_uuid=main_thread_track_uuid)
    add_slice_event(ts=15200, event_type=TrackEvent.TYPE_SLICE_END, # Ends ProcessInputEvent
                    event_track_uuid=main_thread_track_uuid)

    add_slice_event(ts=16000, event_type=TrackEvent.TYPE_SLICE_BEGIN,
                    event_track_uuid=main_thread_track_uuid, name="RenderFrame")
    add_slice_event(ts=16500, event_type=TrackEvent.TYPE_SLICE_END,
                    event_track_uuid=main_thread_track_uuid)
You can query thread-specific slices using SQL in the Perfetto UI's Query tab or with Trace Processor:
INCLUDE PERFETTO MODULE slices.with_context;

SELECT ts, dur, name, thread_name
FROM thread_slice
WHERE tid = 5678;
For details on how to explicitly control the display order of threads within a process, see Controlling Track Sorting Order.
Advanced Track Customization
Beyond associating tracks with OS concepts, Perfetto offers ways to fine-tune how your tracks are presented and how data is encoded.
Controlling Track Sorting Order
By default, the Perfetto UI applies its own heuristics to sort tracks (e.g., alphabetically by name, or by track UUID). However, for complex custom traces, you might want to explicitly define the order in which tracks appear. This sorting behavior differs depending on whether you are ordering standard custom child tracks, processes, or threads within a process.
Non-OS Scoped (Child Tracks) Sorting
For standard custom tracks that are parented to another custom track using parent_uuid,
you can configure child ordering on the parent track.
This setting only affects the direct children of that parent track.
Available child_ordering modes (defined in TrackDescriptor.ChildTracksOrdering):
UNKNOWN: The default. The UI will use its own heuristics.LEXICOGRAPHIC: Child tracks are sorted alphabetically by theirnameorstatic_name.CHRONOLOGICAL: Child tracks are sorted based on the timestamp of the earliestTrackEventthat occurs on each of them. Tracks with earlier events appear first.EXPLICIT: Child tracks are sorted based on thesibling_order_rankfield set in their respectiveTrackDescriptors. Lower ranks appear first. If ranks are equal, or ifsibling_order_rankis not set, the tie-breaking order is undefined.
Process Sorting
To explicitly control how the UI displays top-level process tracks relative to
each other, you must configure the root track descriptor (uuid = 0).
- Set
process_orderingon the root track descriptor (uuid = 0) toPROCESS_ORDERING_EXPLICIT. - Define a
sibling_order_rankon individual processTrackDescriptors. Processes with lower ranks will appear first. An unspecified rank defaults to 0.
Available process_ordering modes (defined in TrackDescriptor.ProcessOrdering):
PROCESS_ORDERING_UNSPECIFIED: The default. The UI will use its own heuristics.PROCESS_ORDERING_EXPLICIT: Sort processes bysibling_order_rankof their process track descriptors.
Thread Sorting
To explicitly control how the UI displays thread tracks within a process group
relative to each other, you must configure the root track descriptor (uuid = 0).
- Set
thread_orderingon the root track descriptor (uuid = 0) toTHREAD_ORDERING_EXPLICIT. - Define a
sibling_order_rankon individual threadTrackDescriptors. Threads with lower ranks will appear first. An unspecified rank defaults to 0.
Available thread_ordering modes (defined in TrackDescriptor.ThreadOrdering):
THREAD_ORDERING_UNSPECIFIED: The default. The UI will use its own heuristics.THREAD_ORDERING_EXPLICIT: Sort threads bysibling_order_rankof their thread track descriptors.
Note: The UI treats these as strong hints. While it generally respects these orderings, there are contexts in which the UI reserves the right not to show them in this order; generally this would be if the user explicitly requested this or if the UI has some special handling for these tracks.
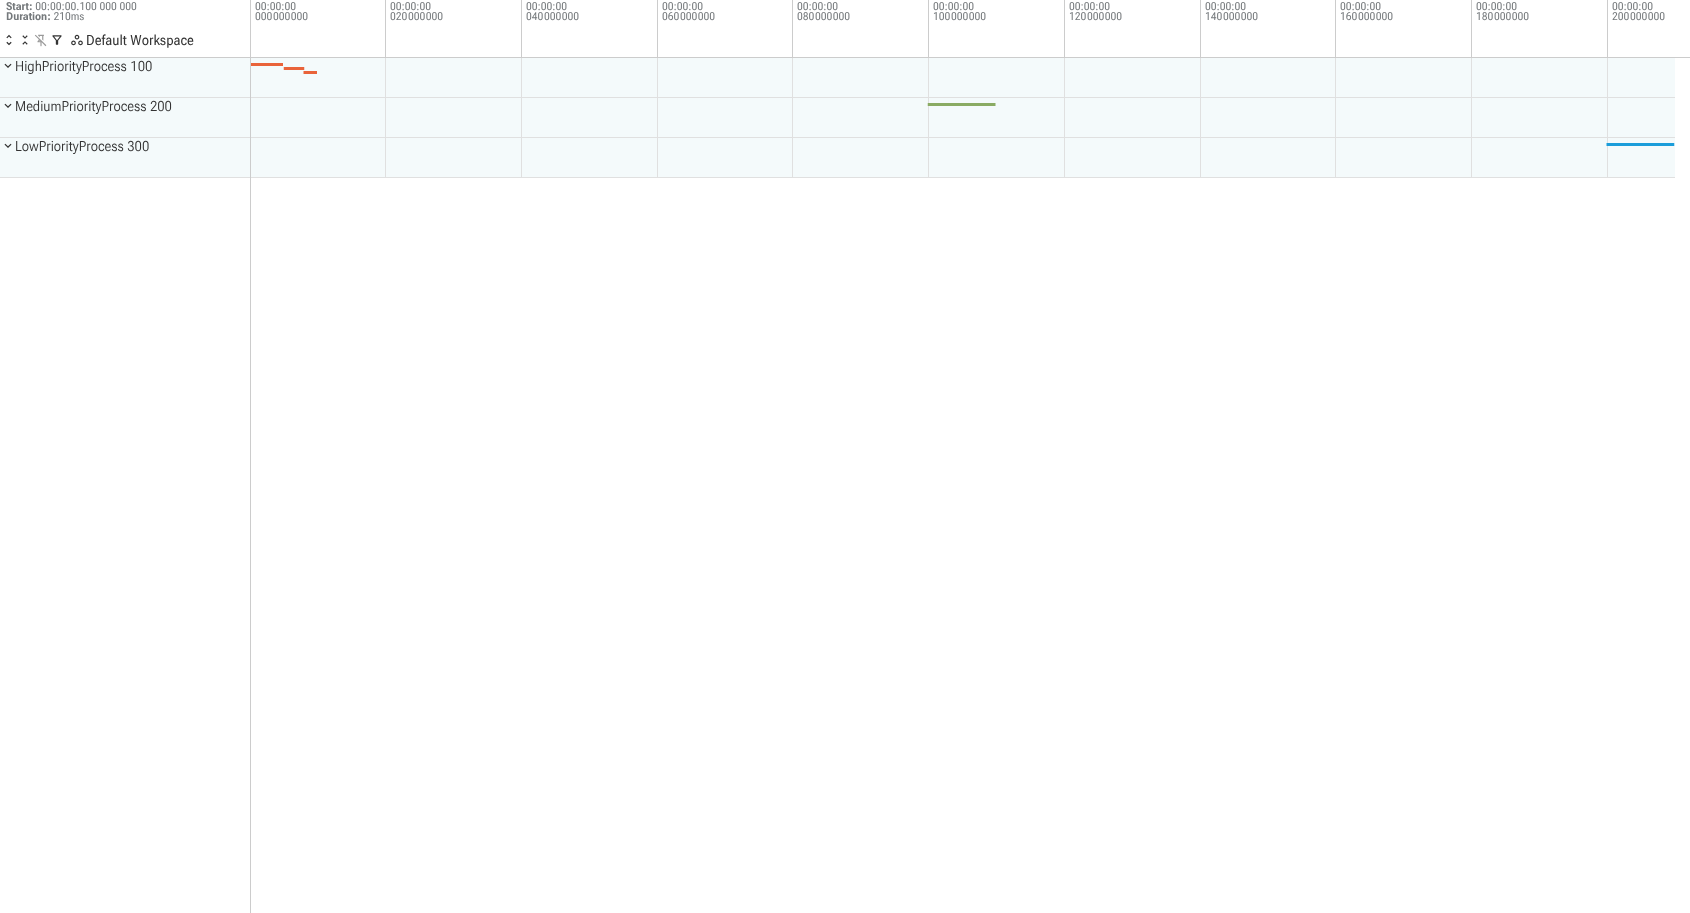
Python Example: Demonstrating All Sorting Types
This example defines three parent tracks demonstrating different child_ordering modes,
as well as configuring explicit process and thread ordering on the root track.
Copy the following Python code into the populate_packets(builder) function in
your trace_converter_template.py script.
Click to expand/collapse Python code
TRUSTED_PACKET_SEQUENCE_ID = 9000
# Helper to define a TrackDescriptor
def define_custom_track(track_uuid, name, parent_track_uuid=None, child_ordering_mode=None, order_rank=None):
packet = builder.add_packet()
desc = packet.track_descriptor
desc.uuid = track_uuid
desc.name = name
if parent_track_uuid:
desc.parent_uuid = parent_track_uuid
if child_ordering_mode:
desc.child_ordering = child_ordering_mode
if order_rank is not None:
desc.sibling_order_rank = order_rank
# Helper to add a simple instant event
def add_instant_event(ts, track_uuid, event_name):
packet = builder.add_packet()
packet.timestamp = ts
packet.track_event.type = TrackEvent.TYPE_INSTANT
packet.track_event.track_uuid = track_uuid
packet.track_event.name = event_name
packet.trusted_packet_sequence_id = TRUSTED_PACKET_SEQUENCE_ID
# --- 1. Lexicographical Sorting Example ---
parent_lex_uuid = uuid.uuid4().int & ((1 << 63) - 1)
define_custom_track(parent_lex_uuid, "Lexicographic Parent",
child_ordering_mode=TrackDescriptor.LEXICOGRAPHIC)
child_c_lex_uuid = uuid.uuid4().int & ((1 << 63) - 1)
child_a_lex_uuid = uuid.uuid4().int & ((1 << 63) - 1)
child_b_lex_uuid = uuid.uuid4().int & ((1 << 63) - 1)
define_custom_track(child_c_lex_uuid, "C-Item (Lex)", parent_track_uuid=parent_lex_uuid)
define_custom_track(child_a_lex_uuid, "A-Item (Lex)", parent_track_uuid=parent_lex_uuid)
define_custom_track(child_b_lex_uuid, "B-Item (Lex)", parent_track_uuid=parent_lex_uuid)
add_instant_event(ts=100, track_uuid=child_c_lex_uuid, event_name="Event C")
add_instant_event(ts=100, track_uuid=child_a_lex_uuid, event_name="Event A")
add_instant_event(ts=100, track_uuid=child_b_lex_uuid, event_name="Event B")
# Expected UI order under "Lexicographic Parent": A-Item, B-Item, C-Item
# --- 2. Chronological Sorting Example ---
parent_chrono_uuid = uuid.uuid4().int & ((1 << 63) - 1)
define_custom_track(parent_chrono_uuid, "Chronological Parent",
child_ordering_mode=TrackDescriptor.CHRONOLOGICAL)
child_late_uuid = uuid.uuid4().int & ((1 << 63) - 1)
child_early_uuid = uuid.uuid4().int & ((1 << 63) - 1)
child_middle_uuid = uuid.uuid4().int & ((1 << 63) - 1)
define_custom_track(child_late_uuid, "Late Event Track", parent_track_uuid=parent_chrono_uuid)
define_custom_track(child_early_uuid, "Early Event Track", parent_track_uuid=parent_chrono_uuid)
define_custom_track(child_middle_uuid, "Middle Event Track", parent_track_uuid=parent_chrono_uuid)
add_instant_event(ts=2000, track_uuid=child_late_uuid, event_name="Late Event")
add_instant_event(ts=1000, track_uuid=child_early_uuid, event_name="Early Event")
add_instant_event(ts=1500, track_uuid=child_middle_uuid, event_name="Middle Event")
# Expected UI order under "Chronological Parent": Early, Middle, Late Event Track
# --- 3. Explicit Sorting Example ---
parent_explicit_uuid = uuid.uuid4().int & ((1 << 63) - 1)
define_custom_track(parent_explicit_uuid, "Explicit Parent",
child_ordering_mode=TrackDescriptor.EXPLICIT)
child_rank10_uuid = uuid.uuid4().int & ((1 << 63) - 1)
child_rank_neg5_uuid = uuid.uuid4().int & ((1 << 63) - 1)
child_rank0_uuid = uuid.uuid4().int & ((1 << 63) - 1)
define_custom_track(child_rank10_uuid, "Explicit Rank 10",
parent_track_uuid=parent_explicit_uuid, order_rank=10)
define_custom_track(child_rank_neg5_uuid, "Explicit Rank -5",
parent_track_uuid=parent_explicit_uuid, order_rank=-5)
define_custom_track(child_rank0_uuid, "Explicit Rank 0",
parent_track_uuid=parent_explicit_uuid, order_rank=0)
add_instant_event(ts=3000, track_uuid=child_rank10_uuid, event_name="Event Rank 10")
add_instant_event(ts=3000, track_uuid=child_rank_neg5_uuid, event_name="Event Rank -5")
add_instant_event(ts=3000, track_uuid=child_rank0_uuid, event_name="Event Rank 0")
# Expected UI order under "Explicit Parent": Rank -5, Rank 0, Rank 10
# --- 4. Process and Thread Explicit Sorting Example ---
# Configure the root track (uuid = 0) to enable explicit process and thread ordering
packet = builder.add_packet()
root_desc = packet.track_descriptor
root_desc.uuid = 0
root_desc.process_ordering = TrackDescriptor.PROCESS_ORDERING_EXPLICIT
root_desc.thread_ordering = TrackDescriptor.THREAD_ORDERING_EXPLICIT
# Define Process A with rank 5
process_a_uuid = uuid.uuid4().int & ((1 << 63) - 1)
packet = builder.add_packet()
desc = packet.track_descriptor
desc.uuid = process_a_uuid
desc.process.pid = 100
desc.process.process_name = "Process A (Rank 5)"
desc.sibling_order_rank = 5
# Define Process B with rank 2 (should appear before Process A)
process_b_uuid = uuid.uuid4().int & ((1 << 63) - 1)
packet = builder.add_packet()
desc = packet.track_descriptor
desc.uuid = process_b_uuid
desc.process.pid = 200
desc.process.process_name = "Process B (Rank 2)"
desc.sibling_order_rank = 2
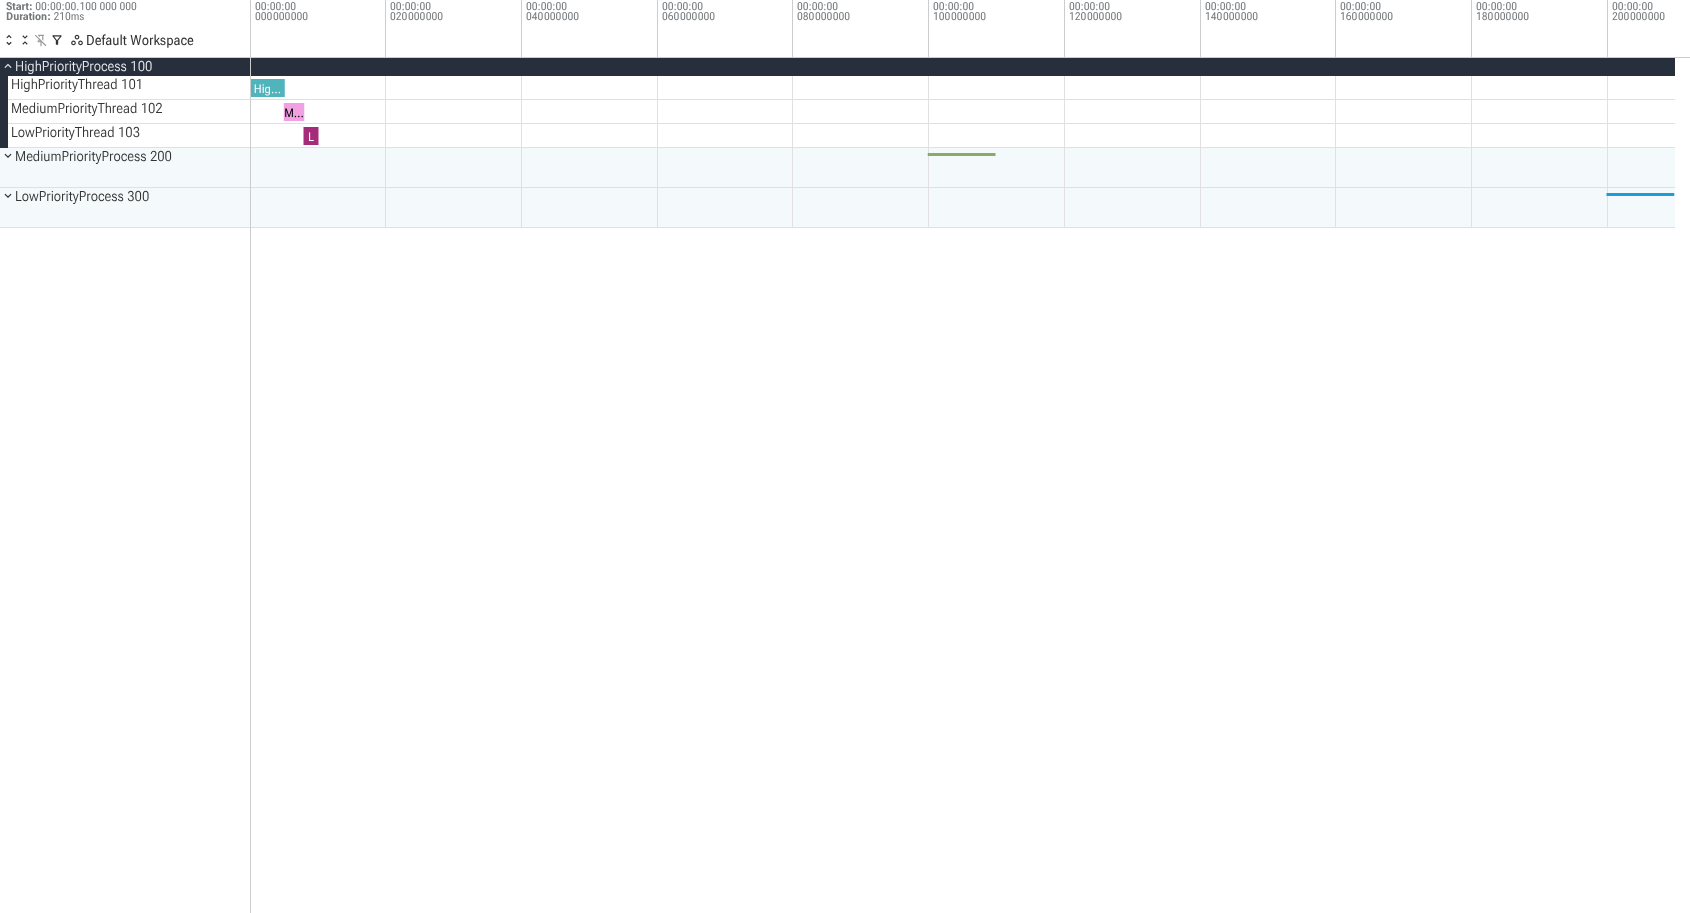
# Define Thread A1 under Process A with rank 42
thread_a1_uuid = uuid.uuid4().int & ((1 << 63) - 1)
packet = builder.add_packet()
desc = packet.track_descriptor
desc.uuid = thread_a1_uuid
desc.thread.pid = 100
desc.thread.tid = 101
desc.thread.thread_name = "Thread A1 (Rank 42)"
desc.sibling_order_rank = 42
# Define Thread A2 under Process A with rank 10 (should appear before Thread A1)
thread_a2_uuid = uuid.uuid4().int & ((1 << 63) - 1)
packet = builder.add_packet()
desc = packet.track_descriptor
desc.uuid = thread_a2_uuid
desc.thread.pid = 100
desc.thread.tid = 102
desc.thread.thread_name = "Thread A2 (Rank 10)"
desc.sibling_order_rank = 10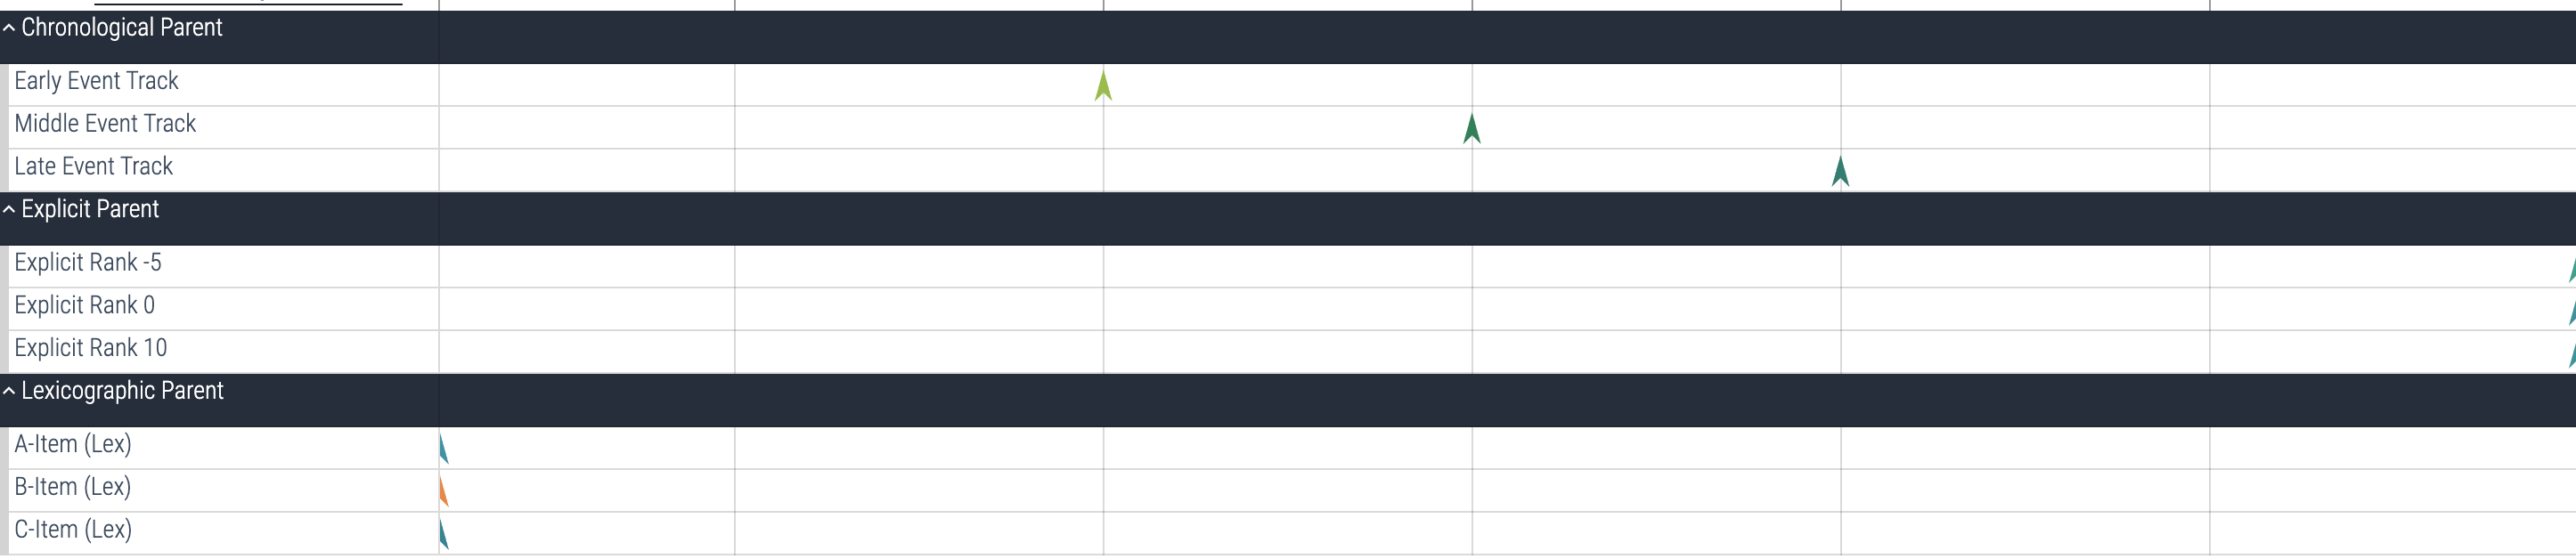
Sharing Y-Axis Between Counters
When visualizing multiple counter tracks, it is often useful to have them share
the same Y-axis range. This allows for easy comparison of their values. Perfetto
supports this feature through the y_axis_share_key field in the
CounterDescriptor.
All counter tracks that have the same y_axis_share_key and the same parent
track will share their Y-axis range in the UI.
Python Example: Sharing Y-Axis
In this example, we create two counter tracks with the same y_axis_share_key.
This will cause them to be rendered with the same Y-axis range in the Perfetto
UI.
Click to expand/collapse Python code
    TRUSTED_PACKET_SEQUENCE_ID = 9005

    # --- Define Track UUIDs ---
    counter1_uuid = 1
    counter2_uuid = 2

    # Helper to define a Counter TrackDescriptor
    def define_counter_track(track_uuid, name, share_key=None):
        packet = builder.add_packet()
        desc = packet.track_descriptor
        desc.uuid = track_uuid
        desc.name = name
        if share_key:
            desc.counter.y_axis_share_key = share_key

    # 1. Define the counter tracks with the same share key
    define_counter_track(counter1_uuid, "Counter 1", "group1")
    define_counter_track(counter2_uuid, "Counter 2", "group1")

    # Helper to add a counter event
    def add_counter_event(ts, value, counter_track_uuid):
        packet = builder.add_packet()
        packet.timestamp = ts
        packet.track_event.type = TrackEvent.TYPE_COUNTER
        packet.track_event.track_uuid = counter_track_uuid
        packet.track_event.counter_value = value
        packet.trusted_packet_sequence_id = TRUSTED_PACKET_SEQUENCE_ID

    # 2. Add events to the tracks
    add_counter_event(ts=1000, value=100, counter_track_uuid=counter1_uuid)
    add_counter_event(ts=2000, value=200, counter_track_uuid=counter1_uuid)

    add_counter_event(ts=1000, value=300, counter_track_uuid=counter2_uuid)
    add_counter_event(ts=2000, value=400, counter_track_uuid=counter2_uuid)
Adding a Track Description
You can add a human-readable description to any track to provide more context about the data it contains. In the Perfetto UI, this description appears in a popup when the user clicks the help icon next to the track's name. This is useful for explaining what a track represents, the meaning of its events, or how it should be interpreted, especially in complex custom traces.
To add a description, you simply set the optional description field in the
track's TrackDescriptor.
Python Example
This example defines two tracks: one with a description field set and one
without, to illustrate the difference in the UI.
Copy the following Python code into the populate_packets(builder) function in
your trace_converter_template.py script.
Click to expand/collapse Python code
    TRUSTED_PACKET_SEQUENCE_ID = 9005

    # --- Define Track UUID ---
    described_track_uuid = uuid.uuid4().int & ((1 << 63) - 1)
    undescribed_track_uuid = uuid.uuid4().int & ((1 << 63) - 1)

    # --- 1. Define two tracks, one with a description and one without ---
    # Track WITH description
    packet = builder.add_packet()
    desc = packet.track_descriptor
    desc.uuid = described_track_uuid
    desc.name = "Track With Description"
    desc.description = "This track shows the processing stages for incoming user requests. Click the (?) icon to see this text."

    # Track WITHOUT description
    packet = builder.add_packet()
    desc = packet.track_descriptor
    desc.uuid = undescribed_track_uuid
    desc.name = "Track Without Description"
    # The 'description' field is simply not set.

    # Helper to add a slice event to the track
    def add_slice_event(ts, event_type, event_track_uuid, name=None):
        packet = builder.add_packet()
        packet.timestamp = ts
        packet.track_event.type = event_type
        packet.track_event.track_uuid = event_track_uuid
        if name:
            packet.track_event.name = name
        packet.trusted_packet_sequence_id = TRUSTED_PACKET_SEQUENCE_ID

    # --- 2. Emit some events on both tracks ---
    # Events for the described track
    add_slice_event(ts=1000, event_type=TrackEvent.TYPE_SLICE_BEGIN,
                    event_track_uuid=described_track_uuid, name="Request #123")
    add_slice_event(ts=1200, event_type=TrackEvent.TYPE_SLICE_END,
                    event_track_uuid=described_track_uuid)

    # Events for the undescribed track
    add_slice_event(ts=1300, event_type=TrackEvent.TYPE_SLICE_BEGIN,
                    event_track_uuid=undescribed_track_uuid, name="Some Other Task")
    add_slice_event(ts=1500, event_type=TrackEvent.TYPE_SLICE_END,
                    event_track_uuid=undescribed_track_uuid)
Advanced Event Writing
This section covers advanced TrackEvent features for specialized use cases, including data optimization techniques and event linking mechanisms.
Interning Data for Trace Size Optimization
Interning is a technique used to reduce the size of trace files by emitting
frequently repeated strings (like event names or categories) only once in the
trace. Subsequent references to these strings use a compact integer identifier
(an "interning ID" or iid). This is particularly useful when you have many
events that share the same name or other string-based attributes.
How it works:
Define Interned Data: In a
TracePacket, you include aninterned_datamessage. Inside this, you map your strings toiids. For example, you can defineevent_nameswhere each entry has aniid(a non-zero integer you choose) and anamestring. This packet establishes the mapping.Reference by IID: In subsequent
TrackEvents (within the sametrusted_packet_sequence_idand before the interned state is cleared), instead of setting thenamefield directly, you set the correspondingname_iidfield to the integeriidyou defined.Sequence Flags: The
TracePacket.sequence_flagsfield is crucial:SEQ_INCREMENTAL_STATE_CLEARED(value 1): Set this on a packet if the interning dictionary (and other incremental state) for this sequence should be considered reset before processing this packet'sinterned_data. This is often used on the first packet of a sequence that defines interned entries.SEQ_NEEDS_INCREMENTAL_STATE(value 2): Set this on any packet that either defines new interned data entries OR uses iids that were defined in previous packets (within the current valid state of the sequence).
A typical packet that initializes the interning dictionary for a sequence will set both flags:
TracePacket.SEQ_INCREMENTAL_STATE_CLEARED | TracePacket.SEQ_NEEDS_INCREMENTAL_STATE. Packets that use these established interned entries (or add more entries to the existing valid dictionary) will setTracePacket.SEQ_NEEDS_INCREMENTAL_STATE.
Python Example: Interning Event Names
This example shows how to define an interned string for an event name and then use it multiple times.
Copy the following Python code into the populate_packets(builder) function in
your trace_converter_template.py script.
Click to expand/collapse Python code
    TRUSTED_PACKET_SEQUENCE_ID = 9002

    # --- Define Track UUID ---
    interning_track_uuid = uuid.uuid4().int & ((1 << 63) - 1)

    # Helper to define a TrackDescriptor
    def define_custom_track(track_uuid, name):
        packet = builder.add_packet()
        desc = packet.track_descriptor
        desc.uuid = track_uuid
        desc.name = name

    # 1. Define the track
    define_custom_track(interning_track_uuid, "Interning Demo Track")

    # --- Define Interned Event Name ---
    INTERNED_EVENT_NAME_IID = 1 # Choose a unique iid (non-zero)
    VERY_LONG_EVENT_NAME = "MyFrequentlyRepeatedLongEventNameThatTakesUpSpace"

    # Helper to add a TrackEvent packet, managing interning and sequence flags
    def add_slice_with_interning(ts, event_type, name_iid=None, name_literal=None, define_new_internment=False, new_intern_iid=None, new_intern_name=None):
        packet = builder.add_packet()
        packet.timestamp = ts
        tev = packet.track_event
        tev.type = event_type
        tev.track_uuid = interning_track_uuid

        if name_iid:
            tev.name_iid = name_iid
        elif name_literal and event_type != TrackEvent.TYPE_SLICE_END:
            tev.name = name_literal

        if define_new_internment:
            # This packet defines new interned data.
            # We'll also clear any prior state for this sequence.
            if new_intern_iid and new_intern_name:
                entry = packet.interned_data.event_names.add()
                entry.iid = new_intern_iid
                entry.name = new_intern_name
            packet.sequence_flags = TracePacket.SEQ_INCREMENTAL_STATE_CLEARED | TracePacket.SEQ_NEEDS_INCREMENTAL_STATE
        else:
            # This packet uses existing interned data (or has no interned fields)
            # but is part of a sequence that relies on incremental state.
            packet.sequence_flags = TracePacket.SEQ_NEEDS_INCREMENTAL_STATE

        packet.trusted_packet_sequence_id = TRUSTED_PACKET_SEQUENCE_ID
        return packet

    # --- Packet 1: Define the interned name and start a slice using it ---
    add_slice_with_interning(
        ts=1000,
        event_type=TrackEvent.TYPE_SLICE_BEGIN,
        name_iid=INTERNED_EVENT_NAME_IID,
        define_new_internment=True, # This packet defines/resets internment
        new_intern_iid=INTERNED_EVENT_NAME_IID,
        new_intern_name=VERY_LONG_EVENT_NAME
    )

    # End the first slice
    add_slice_with_interning(
        ts=1100,
        event_type=TrackEvent.TYPE_SLICE_END
        # No name_iid needed for END, uses existing interned state context
    )

    # --- Packet 2: Use the Interned Event Name Again ---
    add_slice_with_interning(
        ts=1200,
        event_type=TrackEvent.TYPE_SLICE_BEGIN,
        name_iid=INTERNED_EVENT_NAME_IID # Re-use the iid
        # define_new_internment is False by default, so this uses existing state
    )

    # End the second slice
    add_slice_with_interning(
        ts=1300,
        event_type=TrackEvent.TYPE_SLICE_END
    )
Interned Callstacks
The Getting Started guide covers inline callstacks for simple use cases. This section covers interned callstacks for efficiency when callstacks repeat or when you need binary mapping information for symbolization.
Interned callstacks define the callstack structure once in InternedData and
reference it by ID from multiple events. At a minimum you only need to define
frames, callstacks, and reference those callstacks from your events. The
other pieces are optional and can be supplied when you have that information:
- Build IDs and Mapping Paths → Mappings (binaries/libraries). You may skip this entirely if you do not have binary metadata.
- Mappings → Frames (function + location).
mapping_id,rel_pc,source_file_id,line_number, etc. are all optional—set only what makes sense for your data. - Frames → Callstacks (frame sequences)
- Callstacks → Events (via
callstack_iid)
Python Example: Interned Callstacks
This example demonstrates the complete workflow for interning callstacks, including mappings, frames, and callstacks. For minimal traces you can skip the mapping entries and populate frames with just function names (and whatever location details you have).
Copy the following Python code into the populate_packets(builder) function in
your trace_converter_template.py script.
Click to expand/collapse Python code
    from perfetto.protos.perfetto.trace.perfetto_trace_pb2 import TracePacket
    TRUSTED_PACKET_SEQUENCE_ID = 9001

    # --- Define Track UUID ---
    interned_callstack_track_uuid = uuid.uuid4().int & ((1 << 63) - 1)

    def add_function_name(entry, iid, name):
        item = entry.function_names.add()
        item.iid = iid
        item.str = name.encode()

    def add_mapping(entry, iid, build_id, start, end, path_id):
        mapping_entry = entry.mappings.add()
        mapping_entry.iid = iid
        mapping_entry.build_id = build_id
        mapping_entry.exact_offset = 0
        mapping_entry.start = start
        mapping_entry.end = end
        mapping_entry.load_bias = 0
        mapping_entry.path_string_ids.append(path_id)

    def add_frame(entry, iid, function_name_id, mapping_id=None, rel_pc=None):
        frame_entry = entry.frames.add()
        frame_entry.iid = iid
        frame_entry.function_name_id = function_name_id
        if mapping_id is not None:
            frame_entry.mapping_id = mapping_id
        if rel_pc is not None:
            frame_entry.rel_pc = rel_pc

    def add_callstack(entry, iid, frame_ids):
        callstack_entry = entry.callstacks.add()
        callstack_entry.iid = iid
        callstack_entry.frame_ids.extend(frame_ids)

    def emit_track_event(
        ts,
        event_type,
        name,
        callstack_iid,
    ):
        packet = builder.add_packet()
        packet.timestamp = ts
        packet.track_event.type = event_type
        packet.track_event.track_uuid = interned_callstack_track_uuid
        if name is not None:
            packet.track_event.name = name
        if callstack_iid is not None:
            packet.track_event.callstack_iid = callstack_iid
        packet.sequence_flags = TracePacket.SEQ_NEEDS_INCREMENTAL_STATE
        packet.trusted_packet_sequence_id = TRUSTED_PACKET_SEQUENCE_ID

    # 1. Define the track
    packet = builder.add_packet()
    desc = packet.track_descriptor
    desc.uuid = interned_callstack_track_uuid
    desc.name = "Interned Callstack Demo"

    # 2. Define interned data (mappings, frames, callstacks)
    # We'll create this in a single packet that initializes the interning state

    packet = builder.add_packet()
    packet.trusted_packet_sequence_id = TRUSTED_PACKET_SEQUENCE_ID
    packet.sequence_flags = (TracePacket.SEQ_INCREMENTAL_STATE_CLEARED |
                            TracePacket.SEQ_NEEDS_INCREMENTAL_STATE)

    # Define Build IDs
    BUILD_ID_APP = 1
    BUILD_ID_LIBC = 2

    build_id_entry = packet.interned_data.build_ids.add()
    build_id_entry.iid = BUILD_ID_APP
    build_id_entry.str = b"a1b2c3d4e5f67890"  # Hex-encoded build ID

    build_id_entry = packet.interned_data.build_ids.add()
    build_id_entry.iid = BUILD_ID_LIBC
    build_id_entry.str = b"1234567890abcdef"

    # Define Mapping Paths
    PATH_APP = 1
    PATH_LIBC = 2

    path_entry = packet.interned_data.mapping_paths.add()
    path_entry.iid = PATH_APP
    path_entry.str = b"/usr/bin/myapp"

    path_entry = packet.interned_data.mapping_paths.add()
    path_entry.iid = PATH_LIBC
    path_entry.str = b"/lib/x86_64-linux-gnu/libc.so.6"

    # Define Mappings
    MAPPING_APP = 1
    MAPPING_LIBC = 2

    add_mapping(packet.interned_data, MAPPING_APP, BUILD_ID_APP, 0x400000, 0x500000, PATH_APP)
    add_mapping(packet.interned_data, MAPPING_LIBC, BUILD_ID_LIBC, 0x7F0000000000, 0x7F0000200000, PATH_LIBC)

    # Define Frames
    FUNC_MAIN = 1
    FUNC_PROCESS_REQUESTS = 2
    FUNC_HANDLE_REQUEST = 3
    FUNC_MALLOC = 4

    add_function_name(packet.interned_data, FUNC_MAIN, "main")
    add_function_name(packet.interned_data, FUNC_PROCESS_REQUESTS, "ProcessRequests")
    add_function_name(packet.interned_data, FUNC_HANDLE_REQUEST, "HandleRequest")
    add_function_name(packet.interned_data, FUNC_MALLOC, "malloc")

    FRAME_MAIN = 1
    FRAME_PROCESS_REQUESTS = 2
    FRAME_HANDLE_REQUEST = 3
    FRAME_MALLOC = 4

    add_frame(packet.interned_data, FRAME_MAIN, FUNC_MAIN, MAPPING_APP, 0x1234)
    add_frame(packet.interned_data, FRAME_PROCESS_REQUESTS, FUNC_PROCESS_REQUESTS, MAPPING_APP, 0x2345)
    add_frame(packet.interned_data, FRAME_HANDLE_REQUEST, FUNC_HANDLE_REQUEST, MAPPING_APP, 0x3456)
    add_frame(packet.interned_data, FRAME_MALLOC, FUNC_MALLOC, MAPPING_LIBC, 0x8765)

    # Define Callstacks
    # Callstack 1: main -> ProcessRequests -> HandleRequest
    CALLSTACK_1 = 1
    add_callstack(packet.interned_data, CALLSTACK_1, [FRAME_MAIN, FRAME_PROCESS_REQUESTS, FRAME_HANDLE_REQUEST])

    # Callstack 2: main -> ProcessRequests -> HandleRequest -> malloc
    CALLSTACK_2 = 2
    add_callstack(
        packet.interned_data,
        CALLSTACK_2,
        [FRAME_MAIN, FRAME_PROCESS_REQUESTS, FRAME_HANDLE_REQUEST, FRAME_MALLOC],
    )

    # 3. Create events that reference the interned callstacks
    # Event 1: References CALLSTACK_1
    emit_track_event(
        ts=5000,
        event_type=TrackEvent.TYPE_SLICE_BEGIN,
        name="HandleRequest",
        callstack_iid=CALLSTACK_1,
    )

    emit_track_event(
        ts=5300,
        event_type=TrackEvent.TYPE_SLICE_END,
        name=None,
        callstack_iid=None,
    )

    # Event 2: References CALLSTACK_2
    emit_track_event(
        ts=5100,
        event_type=TrackEvent.TYPE_SLICE_BEGIN,
        name="AllocateMemory",
        callstack_iid=CALLSTACK_2,
    )

    emit_track_event(
        ts=5200,
        event_type=TrackEvent.TYPE_SLICE_END,
        name=None,
        callstack_iid=None,
    )

    # Event 3: Another event with CALLSTACK_1 (reusing the interned data)
    emit_track_event(
        ts=6000,
        event_type=TrackEvent.TYPE_SLICE_BEGIN,
        name="HandleRequest",
        callstack_iid=CALLSTACK_1,
    )

    emit_track_event(
        ts=6400,
        event_type=TrackEvent.TYPE_SLICE_END,
        name=None,
        callstack_iid=None,
    )
Notes:
- Sequence flags: Use
SEQ_INCREMENTAL_STATE_CLEARED | SEQ_NEEDS_INCREMENTAL_STATEwhen defining interned data (for the first time); use onlySEQ_NEEDS_INCREMENTAL_STATEwhen referencing it or defining more incremental data. - Frame order:
frame_idsare ordered outermost to innermost (same as inline callstacks). - Reuse: Event 3 reuses
CALLSTACK_1, demonstrating the efficiency gain.
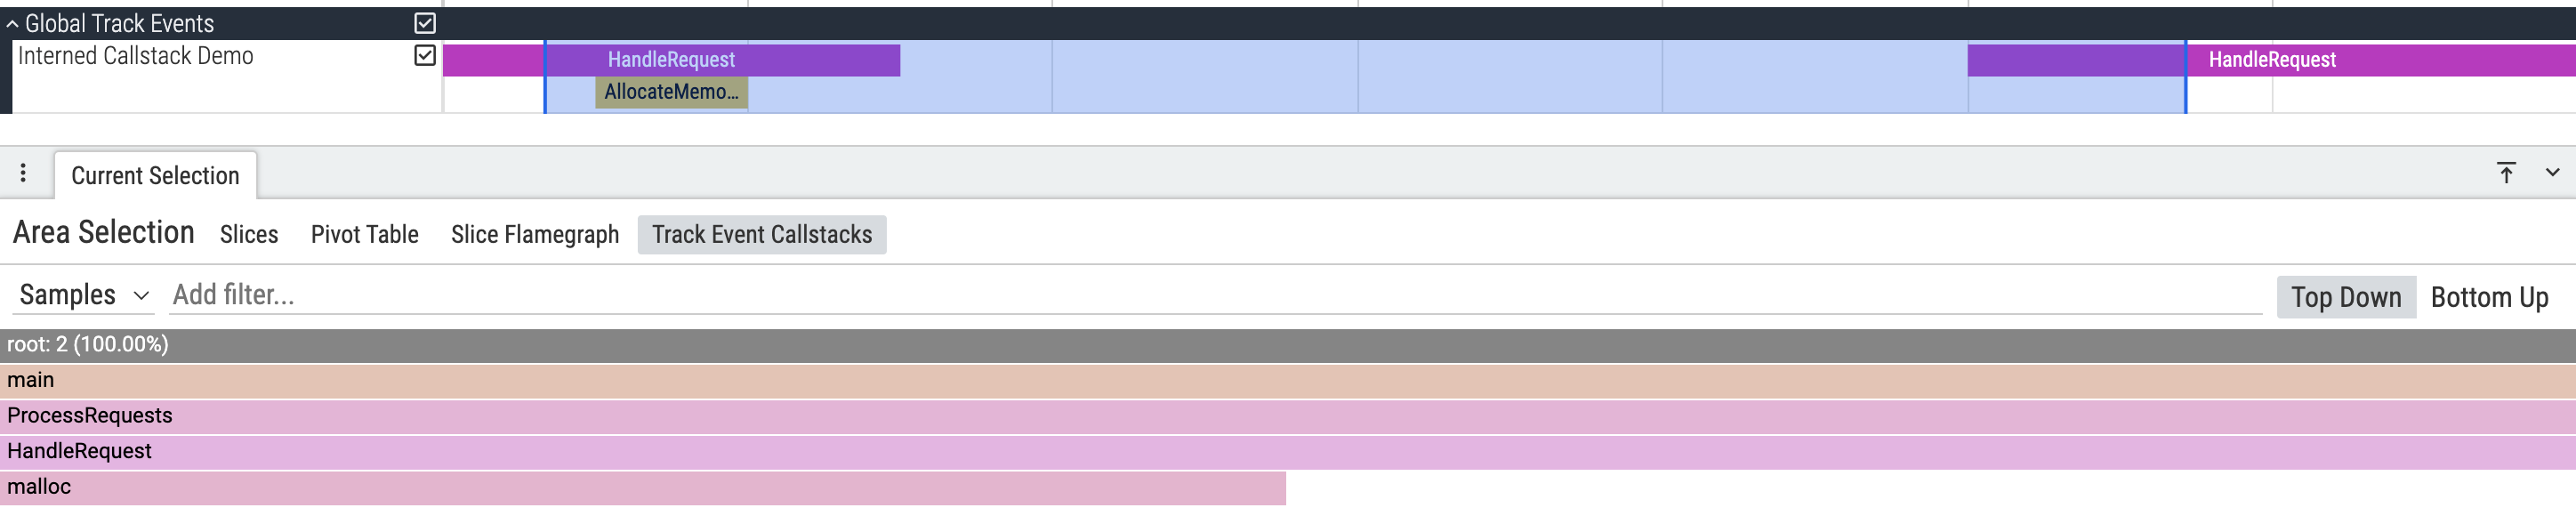
After running the script, opening the generated trace in the Perfetto UI and doing an area selection will display the following output:
Linking Related Events with Correlation IDs
Correlation IDs provide a way to visually link slices that are part of the same logical operation, even when they are not causally connected. Unlike flows, which represent direct cause-and-effect relationships, correlation IDs group events that share a common context or belong to the same high-level operation.
Common use cases:
- GPU rendering: Link all slices involved in rendering the same frame across different GPU stages
- Distributed systems: Group all slices related to the same RPC request as it moves through different services
- Network processing: Connect all slices involved in processing the same network request through different kernel stages
Visual benefits: The Perfetto UI can use correlation IDs to assign consistent colors to related slices or highlight the entire correlated set when one slice is hovered, making it easier to track related operations across different tracks.
Relationship to flows:
- Use flows when events have a direct causal relationship (A triggers B)
- Use correlation IDs when events are part of the same logical operation but not directly connected
- You can use both together: flows for causal connections within a correlated group
Perfetto supports three types of correlation identifiers:
correlation_id: A 64-bit unsigned integer (most efficient, recommended for most cases)correlation_id_str: A string value (most flexible, human-readable)correlation_id_str_iid: An interned string ID (see Interning Data for Trace Size Optimization above for details on interning)
Python Example
This example demonstrates correlation IDs using integer identifiers by simulating different stages of processing for two separate requests across multiple service tracks.
Copy the following Python code into the populate_packets(builder) function in
your trace_converter_template.py script.
Click to expand/collapse Python code
    TRUSTED_PACKET_SEQUENCE_ID = 9010

    # --- Define Track UUIDs ---
    frontend_track_uuid = uuid.uuid4().int & ((1 << 63) - 1)
    auth_track_uuid = uuid.uuid4().int & ((1 << 63) - 1)
    database_track_uuid = uuid.uuid4().int & ((1 << 63) - 1)
    cache_track_uuid = uuid.uuid4().int & ((1 << 63) - 1)

    # Helper to define a TrackDescriptor
    def define_custom_track(track_uuid, name):
        packet = builder.add_packet()
        desc = packet.track_descriptor
        desc.uuid = track_uuid
        desc.name = name

    # 1. Define the tracks
    define_custom_track(frontend_track_uuid, "Frontend Service")
    define_custom_track(auth_track_uuid, "Auth Service")
    define_custom_track(database_track_uuid, "Database Service")
    define_custom_track(cache_track_uuid, "Cache Service")

    # Helper to add slice with correlation ID
    def add_correlated_slice(ts_start, ts_end, track_uuid, slice_name, correlation_id):
        # Start slice
        packet = builder.add_packet()
        packet.timestamp = ts_start
        packet.track_event.type = TrackEvent.TYPE_SLICE_BEGIN
        packet.track_event.track_uuid = track_uuid
        packet.track_event.name = slice_name
        packet.track_event.correlation_id = correlation_id
        packet.trusted_packet_sequence_id = TRUSTED_PACKET_SEQUENCE_ID

        # End slice
        packet = builder.add_packet()
        packet.timestamp = ts_end
        packet.track_event.type = TrackEvent.TYPE_SLICE_END
        packet.track_event.track_uuid = track_uuid
        packet.trusted_packet_sequence_id = TRUSTED_PACKET_SEQUENCE_ID

    # --- Request #42: All slices with correlation_id = 42 ---
    REQUEST_42_ID = 42
    add_correlated_slice(1000, 1200, frontend_track_uuid, "Handle Request #42", REQUEST_42_ID)
    add_correlated_slice(1100, 1400, auth_track_uuid, "Authenticate Request #42", REQUEST_42_ID)
    add_correlated_slice(1350, 1600, database_track_uuid, "Query for Request #42", REQUEST_42_ID)

    # --- Request #123: All slices with correlation_id = 123 ---
    REQUEST_123_ID = 123
    add_correlated_slice(2000, 2300, frontend_track_uuid, "Handle Request #123", REQUEST_123_ID)
    add_correlated_slice(2100, 2500, database_track_uuid, "Query for Request #123", REQUEST_123_ID)
    add_correlated_slice(2400, 2600, cache_track_uuid, "Cache Request #123", REQUEST_123_ID)
Attaching Custom Typed Fields with Proto Extensions
When debug_annotations aren't expressive enough — you want a real schema
with nested messages, repeated fields, or types your downstream tooling can
rely on — extend TrackEvent with a protobuf extension. Trace Processor
parses every decoded extension field into the args table automatically,
provided its descriptor is available.
The full explanation of the mechanism (field-number allocation, wrapper-message requirement, the three ways descriptors can reach Trace Processor) lives in Extending TrackEvent with Custom Protos. This section focuses on the manual-trace-writing flow: how to set extension fields with the standard protobuf Python API and embed the descriptor in the trace so the result is self-contained.
Two-File Setup
Split the schema across two .proto files.
File 1 — acme_data.proto is your regular data schema. You'll generate
Python bindings for this one and use them like any other protobuf message.
syntax = "proto2";
package com.acme;

message AcmeRequestMetadata {
  optional string request_id = 1;
  repeated int32 retry_latencies_ms = 2;
  optional string endpoint = 3;
}
File 2 — acme_extension.proto is the extension hook: it binds the
data message to a specific field number on TrackEvent. You never import
Python bindings for this file — its only purpose is to produce the
FileDescriptorSet embedded in the trace so Trace Processor knows how to
decode that field number.
syntax = "proto2";
import "protos/perfetto/trace/perfetto_trace.proto";
import "acme_data.proto";
package com.acme;

message AcmeExtension {
  extend perfetto.protos.TrackEvent {
    optional AcmeRequestMetadata request_metadata = 9902;
  }
}
Place a copy of perfetto_trace.proto
(download from GitHub)
under protos/perfetto/trace/:
project/
├── protos/perfetto/trace/perfetto_trace.proto   # from the Perfetto repo
├── acme_data.proto
└── acme_extension.proto
From project/, compile:
# Python bindings for the data schema only.
protoc --python_out=. acme_data.proto

# Self-contained descriptor set for the extension hook (pulls in its imports).
protoc -I. --include_imports \
       --descriptor_set_out=acme_extension.desc \
       acme_extension.proto
Python Example
The extension payload is written as protobuf wire bytes onto the
TrackEvent — a length-delimited field (wire type 2) whose value is the
serialized bytes of your data message.
Copy the following into the populate_packets(builder) function in your
trace_converter_template.py script.
    from acme_data_pb2 import AcmeRequestMetadata

    # Field number declared in acme_extension.proto.
    REQUEST_METADATA_FIELD_NUMBER = 9902

    def _varint(n):
        out = bytearray()
        while n >= 0x80:
            out.append((n & 0x7f) | 0x80)
            n >>= 7
        out.append(n)
        return bytes(out)

    def set_request_metadata(track_event, meta):
        """Attach a message-typed extension field (wire type 2) onto a TrackEvent."""
        tag = (REQUEST_METADATA_FIELD_NUMBER << 3) | 2
        payload = meta.SerializeToString()
        wire = _varint(tag) + _varint(len(payload)) + payload
        # MergeFromString preserves fields outside the compiled schema as
        # unknown fields, which are carried through on re-serialization.
        track_event.MergeFromString(wire)

    TRUSTED_PACKET_SEQUENCE_ID = 1001
    TRACK_UUID = 77777

    # 1. Embed the descriptor set so Trace Processor can decode the extension.
    desc_packet = builder.add_packet()
    with open('acme_extension.desc', 'rb') as f:
        desc_packet.extension_descriptor.extension_set.ParseFromString(f.read())

    # 2. Describe the track on which the event will appear.
    td = builder.add_packet()
    td.track_descriptor.uuid = TRACK_UUID
    td.track_descriptor.name = "Requests"

    # 3. Build your metadata.
    meta = AcmeRequestMetadata()
    meta.request_id = "req-42"
    meta.retry_latencies_ms.extend([12, 34])
    meta.endpoint = "/api/v1/search"

    # 4. Emit a SLICE_BEGIN with the metadata spliced in as an extension.
    begin = builder.add_packet()
    begin.timestamp = 1000
    begin.trusted_packet_sequence_id = TRUSTED_PACKET_SEQUENCE_ID
    begin.track_event.type = TrackEvent.TYPE_SLICE_BEGIN
    begin.track_event.track_uuid = TRACK_UUID
    begin.track_event.name = "HandleRequest"
    set_request_metadata(begin.track_event, meta)

    # 5. Close the slice.
    end = builder.add_packet()
    end.timestamp = 1500
    end.trusted_packet_sequence_id = TRUSTED_PACKET_SEQUENCE_ID
    end.track_event.type = TrackEvent.TYPE_SLICE_END
    end.track_event.track_uuid = TRACK_UUID
After importing the resulting trace, extension fields are queryable with
EXTRACT_ARG. Trace Processor keys the extension field by its name
(request_metadata) and flattens nested messages with dot-notation; repeated
fields use [N] indexing.
SELECT
  slice.name,
  EXTRACT_ARG(slice.arg_set_id, 'request_metadata.request_id') AS request_id,
  EXTRACT_ARG(slice.arg_set_id, 'request_metadata.endpoint') AS endpoint,
  EXTRACT_ARG(slice.arg_set_id, 'request_metadata.retry_latencies_ms[0]') AS first_retry_ms
FROM slice
WHERE EXTRACT_ARG(slice.arg_set_id, 'request_metadata.request_id') IS NOT NULL;
Controlling Track Merging
By default, the Perfetto UI merges tracks that share the same name. This is
often the desired behavior for grouping related asynchronous events. However,
there are scenarios where you need more explicit control. You can override this
default merging logic using the sibling_merge_behavior and sibling_merge_key
fields in the TrackDescriptor.
This allows you to:
- Prevent merging: Force tracks, even with the same name, to always be displayed separately.
- Merge by key: Force tracks to merge based on a custom key, regardless of their names.
The sibling_merge_behavior field can be set to one of the following values:
SIBLING_MERGE_BEHAVIOR_BY_TRACK_NAME(the default): Merges sibling tracks that have the samename.SIBLING_MERGE_BEHAVIOR_NONE: Prevents the track from being merged with any of its siblings.SIBLING_MERGE_BEHAVIOR_BY_SIBLING_MERGE_KEY: Merges sibling tracks that have the samesibling_merge_keystring.
Python Example: Preventing Merging
In this example, we create two tracks with the same name. By setting their
sibling_merge_behavior to SIBLING_MERGE_BEHAVIOR_NONE, we ensure they are
always displayed as distinct tracks in the UI.
Click to expand/collapse Python code
    TRUSTED_PACKET_SEQUENCE_ID = 9003

    # --- Define Track UUIDs ---
    track1_uuid = 1
    track2_uuid = 2

    # Helper to define a TrackDescriptor
    def define_custom_track(track_uuid, name):
        packet = builder.add_packet()
        desc = packet.track_descriptor
        desc.uuid = track_uuid
        desc.name = name
        desc.sibling_merge_behavior = TrackDescriptor.SIBLING_MERGE_BEHAVIOR_NONE

    # 1. Define the tracks
    define_custom_track(track1_uuid, "My Separate Track")
    define_custom_track(track2_uuid, "My Separate Track")

    # Helper to add a slice event
    def add_slice_event(ts, event_type, event_track_uuid, name=None):
        packet = builder.add_packet()
        packet.timestamp = ts
        packet.track_event.type = event_type
        packet.track_event.track_uuid = event_track_uuid
        if name:
            packet.track_event.name = name
        packet.trusted_packet_sequence_id = TRUSTED_PACKET_SEQUENCE_ID

    # 2. Add events to the tracks
    add_slice_event(ts=1000, event_type=TrackEvent.TYPE_SLICE_BEGIN, event_track_uuid=track1_uuid, name="Slice 1")
    add_slice_event(ts=1100, event_type=TrackEvent.TYPE_SLICE_END, event_track_uuid=track1_uuid)

    add_slice_event(ts=1200, event_type=TrackEvent.TYPE_SLICE_BEGIN, event_track_uuid=track2_uuid, name="Slice 2")
    add_slice_event(ts=1300, event_type=TrackEvent.TYPE_SLICE_END, event_track_uuid=track2_uuid)
Python Example: Merging by Key
In this example, we create two tracks with different names but the same
sibling_merge_key. By setting their sibling_merge_behavior to
SIBLING_MERGE_BEHAVIOR_BY_SIBLING_MERGE_KEY, we instruct the UI to merge them
into a single visual track. The name of the merged group will be taken from one
of the tracks (usually the one with the lower UUID).
Click to expand/collapse Python code
    TRUSTED_PACKET_SEQUENCE_ID = 9004

    # --- Define Track UUIDs ---
    track1_uuid = 1
    track2_uuid = 2

    # Helper to define a TrackDescriptor
    def define_custom_track(track_uuid, name, merge_key):
        packet = builder.add_packet()
        desc = packet.track_descriptor
        desc.uuid = track_uuid
        desc.name = name
        desc.sibling_merge_behavior = TrackDescriptor.SIBLING_MERGE_BEHAVIOR_BY_SIBLING_MERGE_KEY
        desc.sibling_merge_key = merge_key

    # 1. Define the tracks with the same merge key
    define_custom_track(track1_uuid, "HTTP GET", "conn-123")
    define_custom_track(track2_uuid, "HTTP POST", "conn-123")

    # Helper to add a slice event
    def add_slice_event(ts, event_type, event_track_uuid, name=None):
        packet = builder.add_packet()
        packet.timestamp = ts
        packet.track_event.type = event_type
        packet.track_event.track_uuid = event_track_uuid
        if name:
            packet.track_event.name = name
        packet.trusted_packet_sequence_id = TRUSTED_PACKET_SEQUENCE_ID

    # 2. Add events to the tracks
    add_slice_event(ts=1000, event_type=TrackEvent.TYPE_SLICE_BEGIN, event_track_uuid=track1_uuid, name="GET /data")
    add_slice_event(ts=1100, event_type=TrackEvent.TYPE_SLICE_END, event_track_uuid=track1_uuid)

    add_slice_event(ts=1200, event_type=TrackEvent.TYPE_SLICE_BEGIN, event_track_uuid=track2_uuid, name="POST /submit")
    add_slice_event(ts=1300, event_type=TrackEvent.TYPE_SLICE_END, event_track_uuid=track2_uuid)
Handling Large Traces with Streaming
All the examples so far have used the TraceProtoBuilder, which builds the
entire trace in memory before writing it to a file. This is simple and effective
for moderately sized traces, but can lead to high memory consumption if you are
generating traces with millions of events.
For these scenarios, the StreamingTraceProtoBuilder is the recommended
solution. It writes each TracePacket to a file as it's created, keeping memory
usage minimal regardless of the trace size.
How it Works
The API for the streaming builder is slightly different:
- Initialization: You initialize
StreamingTraceProtoBuilderwith a file-like object opened in binary write mode. - Packet Creation: Instead of
builder.add_packet(), you callbuilder.create_packet()to get a new, emptyTracePacket. - Packet Writing: After populating the packet, you must explicitly call
builder.write_packet(packet)to serialize and write it to the file.
Python Example: Complete Streaming Script
Here is a complete, standalone Python script that demonstrates how to use the
StreamingTraceProtoBuilder. It is based on the "Creating Basic Timeline
Slices" example from the
Getting Started guide.
You can save this code as a new file (e.g., streaming_converter.py) and run
it.
Click to expand/collapse Python code
#!/usr/bin/env python3
import uuid

from perfetto.trace_builder.proto_builder import StreamingTraceProtoBuilder
from perfetto.protos.perfetto.trace.perfetto_trace_pb2 import TrackEvent

def populate_packets(builder: StreamingTraceProtoBuilder):
    """
    This function defines and writes TracePackets to the stream.

    Args:
        builder: An instance of StreamingTraceProtoBuilder.
    """
    # Define a unique ID for this sequence of packets
    TRUSTED_PACKET_SEQUENCE_ID = 1001

    # Define a unique UUID for your custom track
    CUSTOM_TRACK_UUID = 12345678

    # 1. Define the Custom Track
    packet = builder.create_packet()
    packet.track_descriptor.uuid = CUSTOM_TRACK_UUID
    packet.track_descriptor.name = "My Custom Data Timeline"
    builder.write_packet(packet)

    # 2. Emit events for this custom track
    # Example Event 1: "Task A"
    packet = builder.create_packet()
    packet.timestamp = 1000
    packet.track_event.type = TrackEvent.TYPE_SLICE_BEGIN
    packet.track_event.track_uuid = CUSTOM_TRACK_UUID
    packet.track_event.name = "Task A"
    packet.trusted_packet_sequence_id = TRUSTED_PACKET_SEQUENCE_ID
    builder.write_packet(packet)

    packet = builder.create_packet()
    packet.timestamp = 1500
    packet.track_event.type = TrackEvent.TYPE_SLICE_END
    packet.track_event.track_uuid = CUSTOM_TRACK_UUID
    packet.trusted_packet_sequence_id = TRUSTED_PACKET_SEQUENCE_ID
    builder.write_packet(packet)

    # Example Event 2: "Task B"
    packet = builder.create_packet()
    packet.timestamp = 1600
    packet.track_event.type = TrackEvent.TYPE_SLICE_BEGIN
    packet.track_event.track_uuid = CUSTOM_TRACK_UUID
    packet.track_event.name = "Task B"
    packet.trusted_packet_sequence_id = TRUSTED_PACKET_SEQUENCE_ID
    builder.write_packet(packet)

    packet = builder.create_packet()
    packet.timestamp = 1800
    packet.track_event.type = TrackEvent.TYPE_SLICE_END
    packet.track_event.track_uuid = CUSTOM_TRACK_UUID
    packet.trusted_packet_sequence_id = TRUSTED_PACKET_SEQUENCE_ID
    builder.write_packet(packet)

    # Example Event 3: An instantaneous event
    packet = builder.create_packet()
    packet.timestamp = 1900
    packet.track_event.type = TrackEvent.TYPE_INSTANT
    packet.track_event.track_uuid = CUSTOM_TRACK_UUID
    packet.track_event.name = "Milestone Y"
    packet.trusted_packet_sequence_id = TRUSTED_PACKET_SEQUENCE_ID
    builder.write_packet(packet)

def main():
    """
    Initializes the StreamingTraceProtoBuilder and calls populate_packets
    to write the trace to a file.
    """
    output_filename = "my_streamed_trace.pftrace"
    with open(output_filename, 'wb') as f:
        builder = StreamingTraceProtoBuilder(f)
        populate_packets(builder)

    print(f"Trace written to {output_filename}")
    print(f"Open with [https://ui.perfetto.dev](https://ui.perfetto.dev).")

if __name__ == "__main__":
    main()