
Buffers and dataflow
This page describes the dataflow in Perfetto when recording traces. It describes all the buffering stages, explains how to size the buffers and how to debug data losses.
Concepts
Tracing in Perfetto is an asynchronous multiple-writer single-reader pipeline. In many senses, its architecture is very similar to modern GPUs' command buffers.
The design principles of the tracing dataflow are:
- The tracing fastpath is based on direct writes into a shared memory buffer.
- Highly optimized for low-overhead writing. NOT optimized for low-latency reading.
- Trace data is eventually committed in the central trace buffer by the end of the trace or when explicit flush requests are issued via the IPC channel.
- Producers are untrusted and should not be able to see each-other's trace data, as that would leak sensitive information.
In the general case, there are two types buffers involved in a trace. When pulling data from the Linux kernel's ftrace infrastructure, there is a third stage of buffering (one per-CPU) involved:
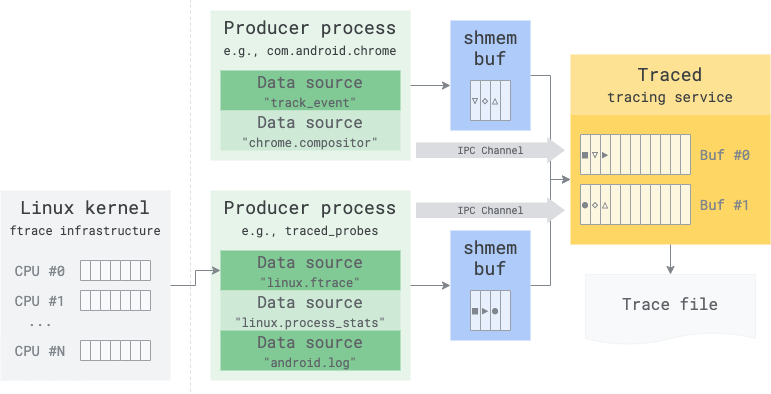
Tracing service's central buffers
These buffers (yellow, in the picture above) are defined by the user in the
buffers section of the trace config. In the most simple cases,
one tracing session = one buffer, regardless of the number of data sources and
producers.
This is the place where the tracing data is ultimately kept, while in memory,
whether it comes from the kernel ftrace infrastructure, from some other data
source in traced_probes or from another userspace process using the
Perfetto SDK.
At the end of the trace (or during, if in streaming mode) these buffers are
written into the output trace file.
These buffers can contain a mixture of trace packets coming from different data sources and even different producer processes. What-goes-where is defined in the buffers mapping section of the trace config. Because of this, the tracing buffers are not shared across processes, to avoid cross-talking and information leaking across producer processes.
Shared memory buffers
Each producer process has one memory buffer shared 1:1 with the tracing service (blue, in the picture above), regardless of the number of data sources it hosts. This buffer is a temporary staging buffer and has two purposes:
Zero-copy on the writer path. This buffer allows direct serialization of the tracing data from the writer fastpath in a memory region directly readable by the tracing service.
Decoupling writes from reads of the tracing service. The tracing service has the job of moving trace packets from the shared memory buffer (blue) into the central buffer (yellow) as fast as it can. The shared memory buffer hides the scheduling and response latencies of the tracing service, allowing the producer to keep writing without losing data when the tracing service is temporarily blocked.
Ftrace buffer
When the linux.ftrace data source is enabled, the kernel will have its own
per-CPU buffers. These are unavoidable because the kernel cannot write directly
into user-space buffers. The traced_probes process will periodically read
those buffers, convert the data into binary protos and follow the same dataflow
of userspace tracing. These buffers need to be just large enough to hold data
between two ftrace read cycles (TraceConfig.FtraceConfig.drain_period_ms).
Life of a trace packet
Here is a summary to understand the dataflow of trace packets across buffers. Consider the case of a producer process hosting two data sources writing packets at a different rates, both targeting the same central buffer.
When each data source starts writing, it will grab a free page of the shared memory buffer and directly serialize proto-encoded tracing data onto it.
When a page of the shared memory buffer is filled, the producer will send an async IPC to the service, asking it to copy the shared memory page just written. Then, the producer will grab the next free page in the shared memory buffer and keep writing.
When the service receives the IPC, it copies the shared memory page into the central buffer and marks the shared memory buffer page as free again. Data sources within the producer are able to reuse that page at this point.
When the tracing session ends, the service sends a
Flushrequest to all data sources. In reaction to this, data sources will commit all outstanding shared memory pages, even if not completely full. The services copies these pages into the service's central buffer.
Buffer sizing
Central buffer sizing
The math for sizing the central buffer is quite straightforward: in the default
case of tracing without write_into_file (when the trace file is written only
at the end of the trace), the buffer will hold as much data as it has been
written by the various data sources.
The total length of the trace will be (buffer size) / (aggregated write rate).
If all producers write at a combined rate of 2 MB/s, a 16 MB buffer will hold
~ 8 seconds of tracing data.
The write rate is highly dependent on the data sources configured and by the activity of the system. 1-2 MB/s is a typical figure on Android traces with scheduler tracing, but can go up easily by 1+ orders of magnitude if chattier data sources are enabled (e.g., syscall or pagefault tracing).
When using streaming mode the buffer needs to be able to hold enough data
between two file_write_period_ms periods (default: 5s).
For instance, if file_write_period_ms = 5000 and the write data rate is 2 MB/s
the central buffer needs to be at least 5 * 2 = 10 MB to avoid data losses.
Shared memory buffer sizing
The sizing of the shared memory buffer depends on:
- The scheduling characteristics of the underlying system, i.e. for how long the
tracing service can be blocked on the scheduler queues. This is a function of
the kernel configuration and nice-ness level of the
tracedprocess. - The max write rate of all data sources within a producer process.
Suppose that a producer produce at a max rate of 8 MB/s. If traced gets
blocked for 10 ms, the shared memory buffer need to be at least 8 * 0.01 = 80 KB
to avoid losses.
Empirical measurements suggest that on most Android systems a shared memory buffer size of 128-512 KB is good enough.
The default shared memory buffer size is 256 KB. When using the Perfetto Client
Library, this value can be tweaked setting TracingInitArgs.shmem_size_hint_kb.
WARNING: if a data source writes very large trace packets in a single batch,
either the shared memory buffer needs to be big enough to handle that or
BufferExhaustedPolicy.kStall must be employed.
For instance, consider a data source that emits a 2MB screenshot every 10s. Its (simplified) code, would look like:
for (;;) {
  ScreenshotDataSource::Trace([](ScreenshotDataSource::TraceContext ctx) {
    auto packet = ctx.NewTracePacket();
    packet.set_bitmap(Grab2MBScreenshot());
  });
  std::this_thread::sleep_for(std::chrono::seconds(10));
}
Its average write rate is 2MB / 10s = 200 KB/s. However, the data source will create bursts of 2MB back-to-back without yielding; it is limited only by the tracing serialization overhead. In practice, it will write the 2MB buffer at O(GB/s). If the shared memory buffer is < 2 MB, the tracing service will be unlikely to catch up at that rate and data losses will be experienced.
In a case like this these options are:
- Increase the size of the shared memory buffer in the producer that hosts the data source.
- Split the write into chunks spaced by some delay.
- Adopt the
BufferExhaustedPolicy::kStallwhen defining the data source:
class ScreenshotDataSource : public perfetto::DataSource<ScreenshotDataSource> {
 public:
  constexpr static BufferExhaustedPolicy kBufferExhaustedPolicy =
      BufferExhaustedPolicy::kStall;
 ...
};
Debugging data losses
Ftrace kernel buffer losses
When using the Linux kernel ftrace data source, losses can occur in the
kernel -> userspace path if the traced_probes process gets blocked for too
long.
At the trace proto level, losses in this path are recorded:
- In the
FtraceCpuStatsmessages, emitted both at the beginning and end of the trace. If theoverrunfield is non-zero, data has been lost. - In the
FtraceEventBundle.lost_eventsfield. This allows to locate precisely the point where data loss happened.
At the TraceProcessor SQL level, this data is available in the stats table:
> select * from stats where name like 'ftrace_cpu_overrun_end'
name                 idx                  severity             source value
-------------------- -------------------- -------------------- ------ ------
ftrace_cpu_overrun_e                    0 data_loss            trace       0
ftrace_cpu_overrun_e                    1 data_loss            trace       0
ftrace_cpu_overrun_e                    2 data_loss            trace       0
ftrace_cpu_overrun_e                    3 data_loss            trace       0
ftrace_cpu_overrun_e                    4 data_loss            trace       0
ftrace_cpu_overrun_e                    5 data_loss            trace       0
ftrace_cpu_overrun_e                    6 data_loss            trace       0
ftrace_cpu_overrun_e                    7 data_loss            trace       0
These losses can be mitigated either increasing
TraceConfig.FtraceConfig.buffer_size_kb
or decreasing
TraceConfig.FtraceConfig.drain_period_ms
Shared memory losses
Tracing data can be lost in the shared memory due to bursts while traced is blocked.
At the trace proto level, losses in this path are recorded:
- In
TraceStats.BufferStats.trace_writer_packet_loss. - In
TracePacket.previous_packet_dropped. This is aDataLossReasonbitmask: a nonzero value means the preceding packets on the sequence were dropped, and (for TraceBufferV2) the bits identify the cause. Caveat: the very first packet emitted by every data source is also marked as dropped (value 1). This is because the service has no way to tell if that was the truly first packet or everything else before that was lost.
At the TraceProcessor SQL level, this data is available in the stats table:
> select * from stats where name = 'traced_buf_trace_writer_packet_loss'
name                 idx                  severity             source    value
-------------------- -------------------- -------------------- --------- -----
traced_buf_trace_wri                    0 data_loss            trace         0
Central buffer losses
Data losses in the central buffer can happen for two different reasons:
When using
fill_policy: RING_BUFFER, older tracing data is overwritten by virtue of wrapping in the ring buffer. These losses are recorded, at the trace proto level, inTraceStats.BufferStats.chunks_overwritten.When using
fill_policy: DISCARD, newer tracing data committed after the buffer is full is dropped. These losses are recorded, at the trace proto level, inTraceStats.BufferStats.chunks_discarded.
At the TraceProcessor SQL level, this data is available in the stats table,
one entry per central buffer:
> select * from stats where name = 'traced_buf_chunks_overwritten' or name = 'traced_buf_chunks_discarded'
name                 idx                  severity             source  value
-------------------- -------------------- -------------------- ------- -----
traced_buf_chunks_di                    0 info                 trace       0
traced_buf_chunks_ov                    0 data_loss            trace       0
Summary: the best way to detect and debug data losses is to use Trace Processor
and issue the query:
select * from stats where severity = 'data_loss' and value != 0
Atomicity and ordering guarantees
A "writer sequence" is the sequence of trace packets emitted by a given TraceWriter from a data source. In almost all cases 1 data source == 1+ TraceWriter(s). Some data sources that support writing from multiple threads typically create one TraceWriter per thread.
Trace packets written from a sequence are emitted in the trace file in the same order they have been written.
There is no ordering guarantee between packets written by different sequences. Sequences are, by design, concurrent and more than one linearization is possible. The service does NOT respect global timestamp ordering across different sequences. If two packets from two sequences were emitted in global timestamp order, the service can still emit them in the trace file in the opposite order.
Trace packets are atomic. If a trace packet is emitted in the trace file, it is guaranteed to be contain all the fields that the data source wrote. If a trace packet is large and spans across several shared memory buffer pages, the service will save it in the trace file only if it can observe that all fragments have been committed without gaps.
If a trace packet is lost (e.g. because of wrapping in the ring buffer or losses in the shared memory buffer), no further trace packet will be emitted for that sequence, until all packets before are dropped as well. In other words, if the tracing service ends up in a situation where it sees packets 1,2,5,6 for a sequence, it will only emit 1, 2. If, however, new packets (e.g., 7, 8, 9) are written and they overwrite 1, 2, clearing the gap, the full sequence 5, 6, 7, 8, 9 will be emitted. This behavior, however, doesn't hold when using streaming mode because, in that case, the periodic read will consume the packets in the buffer and clear the gaps, allowing the sequence to restart.
Incremental state in trace packets
In many cases trace packets are fully independent of each other and can be processed and interpreted without further context. In some cases, however, they can have incremental state and behave similarly to inter-frame video encoding techniques, where some frames require the keyframe to be present to be meaningfully decoded.
Here are two concrete examples:
- Ftrace scheduling slices and /proc/pid scans. ftrace scheduling events are
keyed by thread id. In most cases users want to map those events back to the
parent process (the thread-group). To solve this, when both the
linux.ftraceand thelinux.process_statsdata sources are enabled in a Perfetto trace, the latter does capture process<>thread associations from the /proc pseudo-filesystem, whenever a new thread-id is seen by ftrace. A typical trace in this case looks as follows:# From process_stats's /proc scanner. pid: 610; ppid: 1; cmdline: "/system/bin/surfaceflinger" # From ftrace timestamp: 95054961131912; sched_wakeup: pid: 610; target_cpu: 2; timestamp: 95054977528943; sched_switch: prev_pid: 610 prev_prio: 98
The /proc entry is emitted only once per process to avoid bloating the size of the trace. In lack of data losses this is fine to be able to reconstruct all scheduling events for that pid. If, however, the process_stats packet gets dropped in the ring buffer, there will be no way left to work out the process details for all the other ftrace events that refer to that PID.
- The Track Event library in the Perfetto SDK makes extensive use of string interning. Most strings and descriptors (e.g. details about processes / threads) are emitted only once and later referred to using a monotonic ID. In case a loss of the descriptor packet, it is not possible to make fully sense of those events.
Trace Processor has built-in mechanism that detect loss of interning data and skips ingesting packets that refer to missing interned strings or descriptors.
When using tracing in ring-buffer mode, these types of losses are very likely to happen.
There are two mitigations for this:
Issuing periodic invalidations of the incremental state via
TraceConfig.IncrementalStateConfig.clear_period_ms. This will cause the data sources that make use of incremental state to periodically drop the interning / process mapping tables and re-emit the descriptors / strings on the next occurrence. This mitigates quite well the problem in the context of ring-buffer traces, as long as theclear_period_msis one order of magnitude lower than the estimated length of trace data in the central trace buffer.Recording the incremental state into a dedicated buffer (via
DataSourceConfig.target_buffer). This technique is quite commonly used with in the ftrace + process_stats example mentioned before, recording the process_stats packet in a dedicated buffer less likely to wrap (ftrace events are much more frequent than descriptors for new processes).
Flushes and windowed trace importing
Another common problem experienced in traces that involve multiple data sources is the non-synchronous nature of trace commits. As explained in the Life of a trace packet section above, trace data is committed only when a full memory page of the shared memory buffer is filled (or at when the tracing session ends). In most cases, if data sources produce events at a regular cadence, pages are filled quite quickly and events are committed in the central buffers within seconds.
In some other cases, however, a data source can emit events only sporadically. Imagine the case of a data source that emits events when the display is turned on/off. Such an infrequent event might end up being staged in the shared memory buffer for very long times and can end up being committed in the trace buffer hours after it happened.
Another scenario where this can happen is when using ftrace and when a particular CPU is idle most of the time or gets hot-unplugged (ftrace uses per-cpu buffers). In this case a CPU might record little-or-no data for several minutes while the other CPUs pump thousands of new trace events per second.
This causes two side effects that end up breaking user expectations or causing bugs:
The UI can show an abnormally long timeline with a huge gap in the middle. The packet ordering of events doesn't matter for the UI because events are sorted by timestamp at import time. The trace in this case will contain very recent events plus a handful of stale events that happened hours before. The UI, for correctness, will try to display all events, showing a handful of early events, followed by a huge temporal gap when nothing happened, followed by the stream of recent events.
When recording long traces, Trace Processor can show import errors of the form "XXX event out-of-order". This is because. in order to limit the memory usage at import time, Trace Processor sorts events using a sliding window. If trace packets are too out-of-order (trace file order vs timestamp order), the sorting will fail and some packets will be dropped.
Mitigations
The best mitigation for these sort of problems is to specify a
flush_period_ms in the trace config (10-30 seconds is usually
good enough for most cases), especially when recording long traces.
This will cause the tracing service to issue periodic flush requests to data sources. A flush requests causes the data source to commit the shared memory buffer pages into the central buffer, even if they are not completely full. By default, a flush issued only at the end of the trace.
In case of long traces recorded without flush_period_ms, another option is to
pass the --full-sort option to trace_processor_shell when importing the
trace. Doing so will disable the windowed sorting at the cost of a higher
memory usage (the trace file will be fully buffered in memory before parsing).