
Recording system traces with Perfetto
In this guide, you'll learn how to:
- Record a system-wide trace on Android and Linux.
- Visualize the trace in the Perfetto UI.
- Programmatically analyze the trace using PerfettoSQL.
A powerful use of Perfetto is to collect tracing information from many different processes and data sources on a single machine and combine them all into a single trace. This allows debugging a wide range of performance and functional problems including complex ones. Examples include problems which might span multiple processes, between an app and the OS or even interactions between hardware and the OS. Such traces are known as system traces or commonly abbreviated to just systraces.
NOTE: Recording system traces with Perfetto is only supported out of the box on Android and Linux. While trace recording daemons work on Windows and macOS, there is no integration with system-level data sources meaning traces are unlikely to be useful.
Recording your first system trace
This section walks you through the process of recording your first system-wide trace. There are multiple paths depending on whether you want to record on Android with a GUI, on Android using the command line or on Linux (with the command line only).
Prerequisites
- Any Android device running R+ (if using an older version of Android, please see the Android (command line) tab instead).
- A desktop/laptop with the Android device connected via a USB cable.
- Developer options and USB debugging must be enabled on the device.
Instructions
Start by navigating to ui.perfetto.dev. This is the Perfetto UI, our all-in-one graphical UI for recording, analysing and visualizing traces; we'll be making heavy use of this throughout the rest of the guide.
Click on "Record New Trace" on the left sidebar.
This should take you to the Recording page of the UI which looks like this:
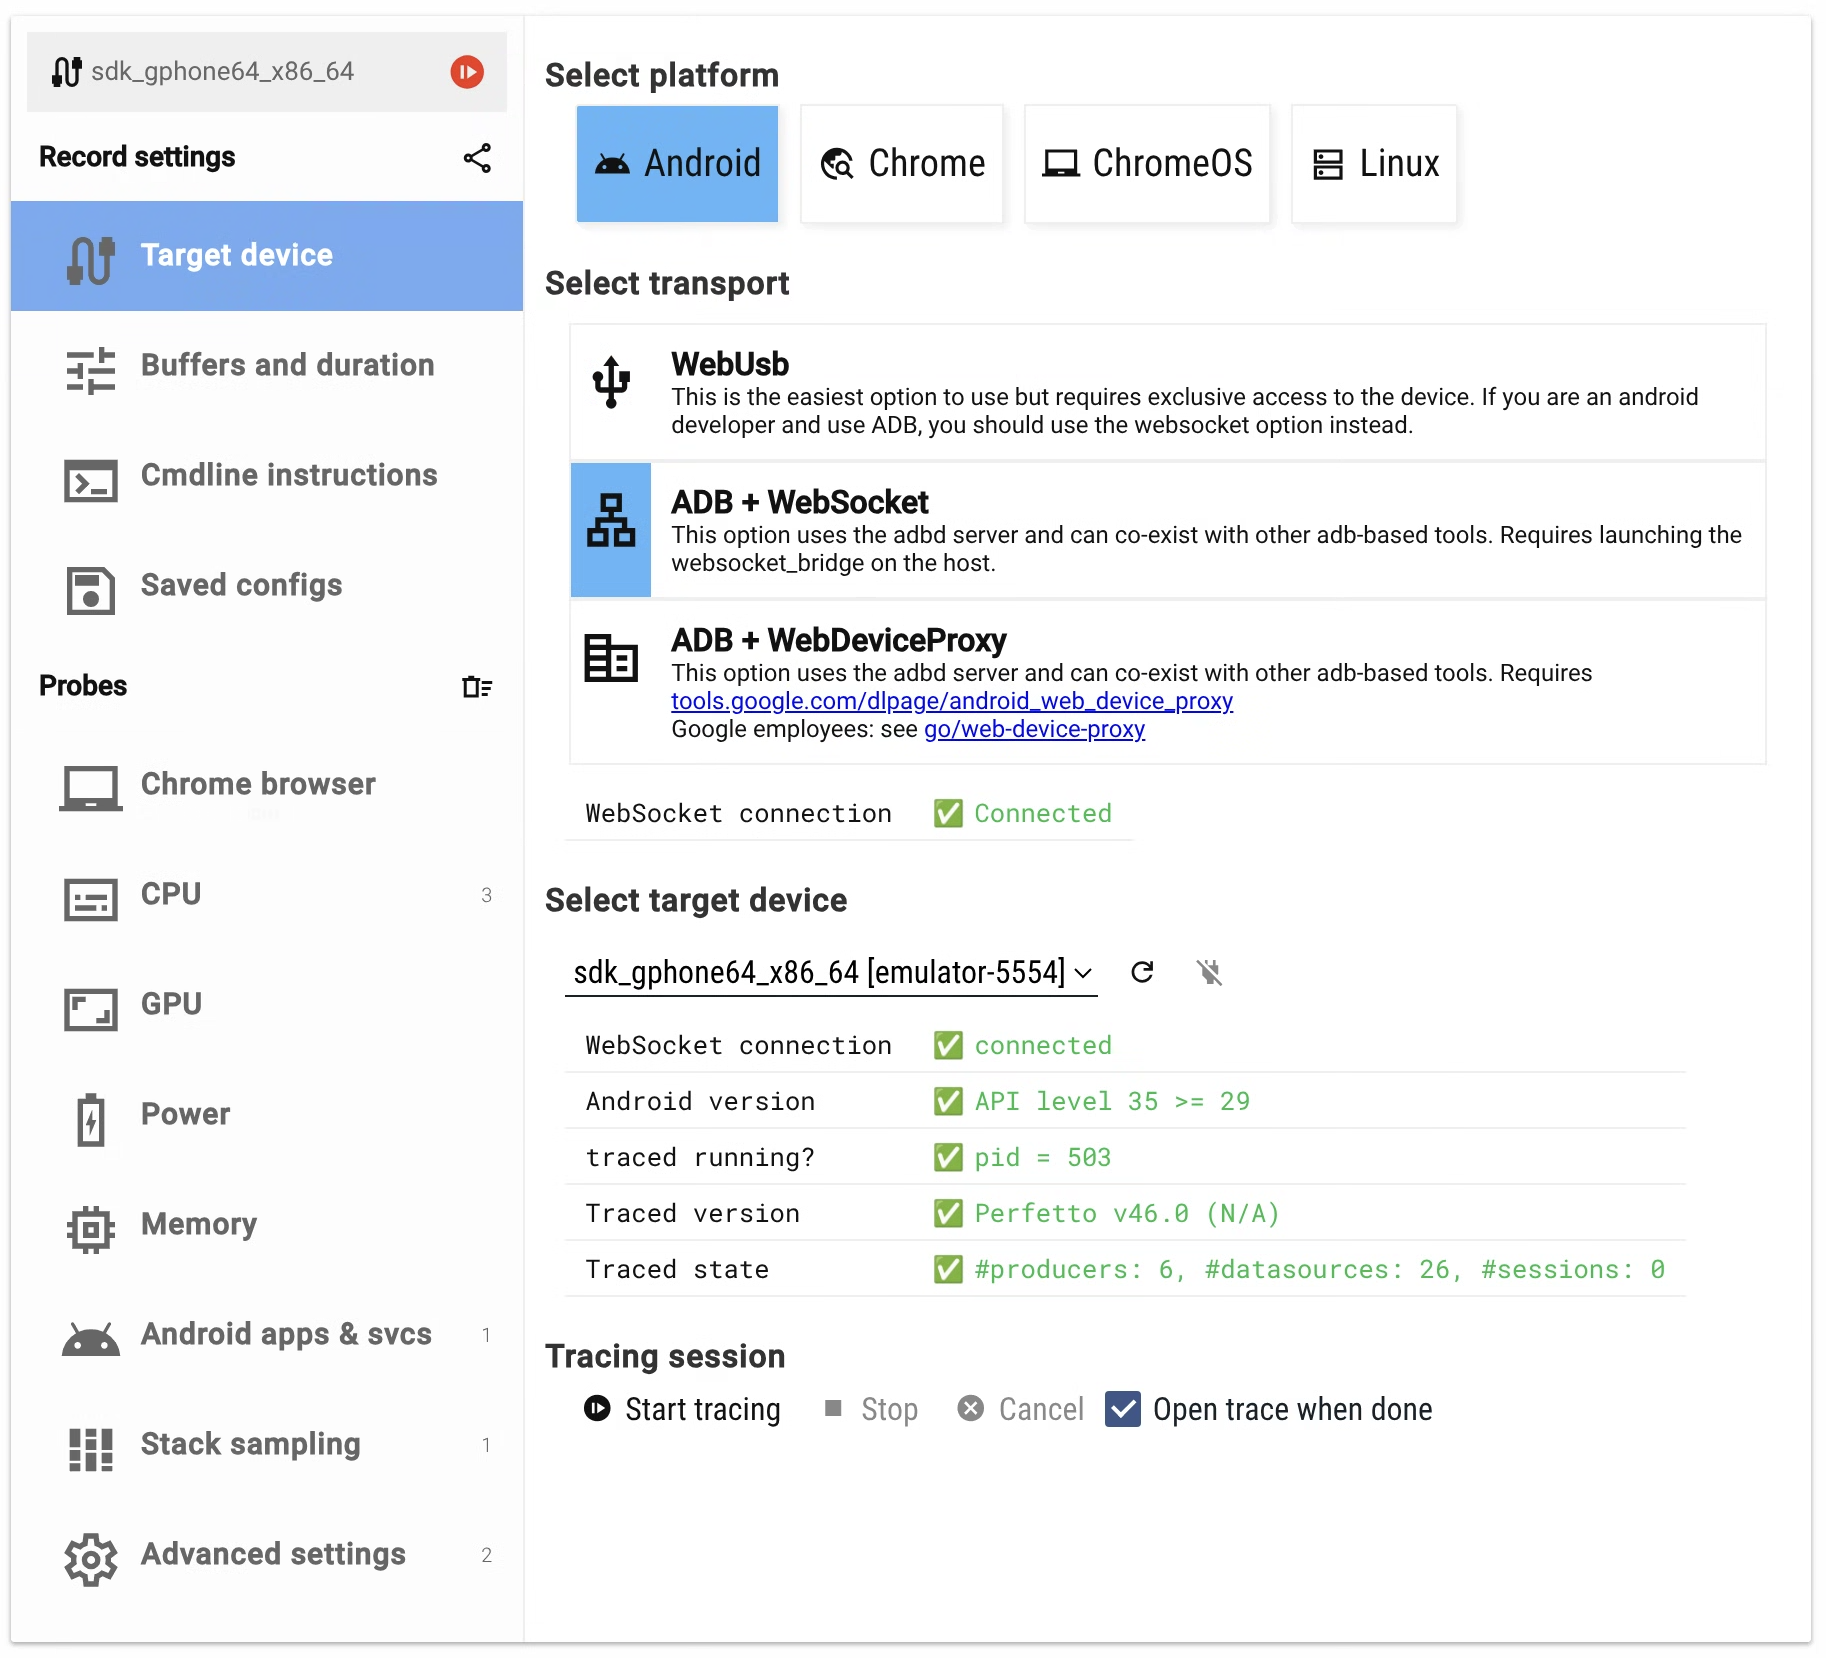
You can choose between different ways of connecting to your Android device. Follow the instructions on the screen to connect to your device. Perfetto UI will check if all the condition is met or show a descriptive error message otherwise. For example, for the ABD+Websocket transport the success message will look like on the screenshot above.
On the Recording Settings page, you can leave the default settings for this guide. These settings control how the trace is recorded:
- Recording Mode: This setting determines how the trace is collected.
- Stop when full: Stops tracing when the in-memory buffer is full.
- Ring buffer: Overwrites the oldest data when the buffer is full.
- Long trace: Periodically saves the trace from memory to a file, allowing for very long traces.
- In-memory buffer size: Sets the amount of memory on the device used to store trace data before it's written to a file.
- Max duration: Sets a time limit for the trace. You can also stop it manually at any time.
- Recording Mode: This setting determines how the trace is collected.
Now we can configure the exact types of tracing information we want to collect in the Probes sections. Feel free to explore the tabs and the options they contain: the UI should briefly explain what each option does and why it might be useful. For the purposes of this guide, we will want to enable the following probes:
- CPU:
- Scheduling details: See what process/thread is running on each CPU over time.
- CPU frequency and idle states: See the frequency each CPU was running at.
- Android Apps and Svcs:
- Atrace userspace annotations: Get context on what systems and apps are doing. Enable the "System server", "View system" and "Input" categories (press Ctrl/Cmd while clicking to multi-select).
- Event log (logcat): Include
logcatmessages in the trace.
- CPU:
Click the green "Start Recording" button and, while the trace is recording, take some action on the Android device (e.g. opening an app, unlocking the phone etc).
After 10s, the trace will automatically stop and you will switch to the timeline view of the collected trace; this discussed in the next section.
Prerequisites
- Any Android device running M+
- Desktop/Laptop with the Android device connected via a USB cable
adb(Android Debug Bridge) executable to be available on yourPATH- ADB binaries for Linux, Mac or Windows can be downloaded from https://developer.android.com/studio/releases/platform-tools
The Perfetto team provides a helper script for recording traces from the command
line on Android called record_android_trace. This takes care of much of the
heavy lifiting of collecting the trace, pulling it from the server and even
opening it in the Perfetto UI:
curl -O https://raw.githubusercontent.com/google/perfetto/main/tools/record_android_trace

# See python3 record_android_trace --help for more details.
python3 record_android_trace \
   -o trace_file.perfetto-trace
   # This option configure the trace to run for 10s.
   -t 10s \
   # This option configures the main buffer size to be 32MB.
   -b 32mb \
   # This option enables atrace annotations from all apps on the system.
   -a '*' \
   # These options specify some of the most important instrumentation on the
   # device: CPU scheduling/frequency to know what is running on the CPUs and
   # the importance the system placed on that work and atrace annotations to
   # have context on what was happening inside userspace processes (platform
   # and app).
   sched freq view ss input
The above command should cause a trace to be collected lasting 10 seconds: while it runs, take some action on the Android device (e.g. opening an app, unlocking the phone etc). When recording is complete, the trace will automatically be opened in the Perfetto UI in a browser window.
NOTE: if you are running this on a remote machine (i.e. via SSH), you should
pass the flag --no-open (which prevents the automatic opening of the Perfetto
UI) and manually download the file at the printed path (e.g. with scp) and
open it in the UI; instructions on this are provided in the next section.
Perfetto can capture system traces on Linux. All ftrace-based data sources and most other procfs / sysfs-based data sources are supported.
Due to Perfetto's service-based architecture,
in order to capture a trace, the traced (session daemon) and traced_probes
(probes and ftrace-interop daemon) need to be running. As per Perfetto v16, the
tracebox binary bundles together all the binaries you need in a single
statically linked executable (a bit like toybox or busybox), which makes it
easy to copy and run on different machines.
You can download the tracebox binary from GitHub:
curl -LO https://get.perfetto.dev/tracebox
chmod +x tracebox
Capturing a trace
To capture a trace you need to pass the config file to the downloaded tracebox
binary. We have some sample config files in the /test/configs/
directory.
Lets say you want to capture a trace with the scheduling information. You can
do so by downloading the config file
curl -LO https://raw.githubusercontent.com/google/perfetto/refs/heads/main/test/configs/scheduling.cfgand running the following command:
./tracebox -o trace_file.perfetto-trace --txt -c scheduling.cfgThe scheduling information is captured using ftrace, so you may need to start
the tracebox with root privileges.
Viewing your first trace
We can now explore the captured trace visually by using the web-based trace visualizer: the Perfetto UI.
NOTE: The Perfetto UI runs fully locally, in-browser using JavaScript + WebAssembly. The trace file is not uploaded anywhere by default, unless you explicitly click on the 'Share' link.
NOTE: The 'Share' link is available only to Googlers.
The recording instructions above should all have caused the trace to automatically open in the browser. However, if they did not work for any reasons (most likely if you are running the commands over SSH), you can also open the traces manually:
- Navigate to ui.perfetto.dev in a browser.
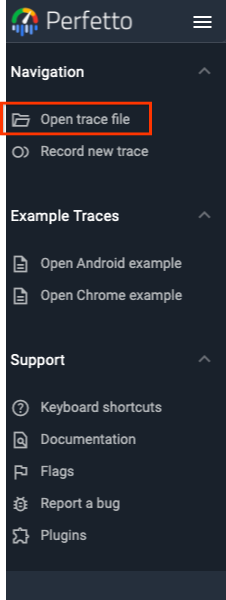
- Click the Open trace file on the left-hand menu, and load the captured traces or simply drag and drop your trace into the Perfetto UI.
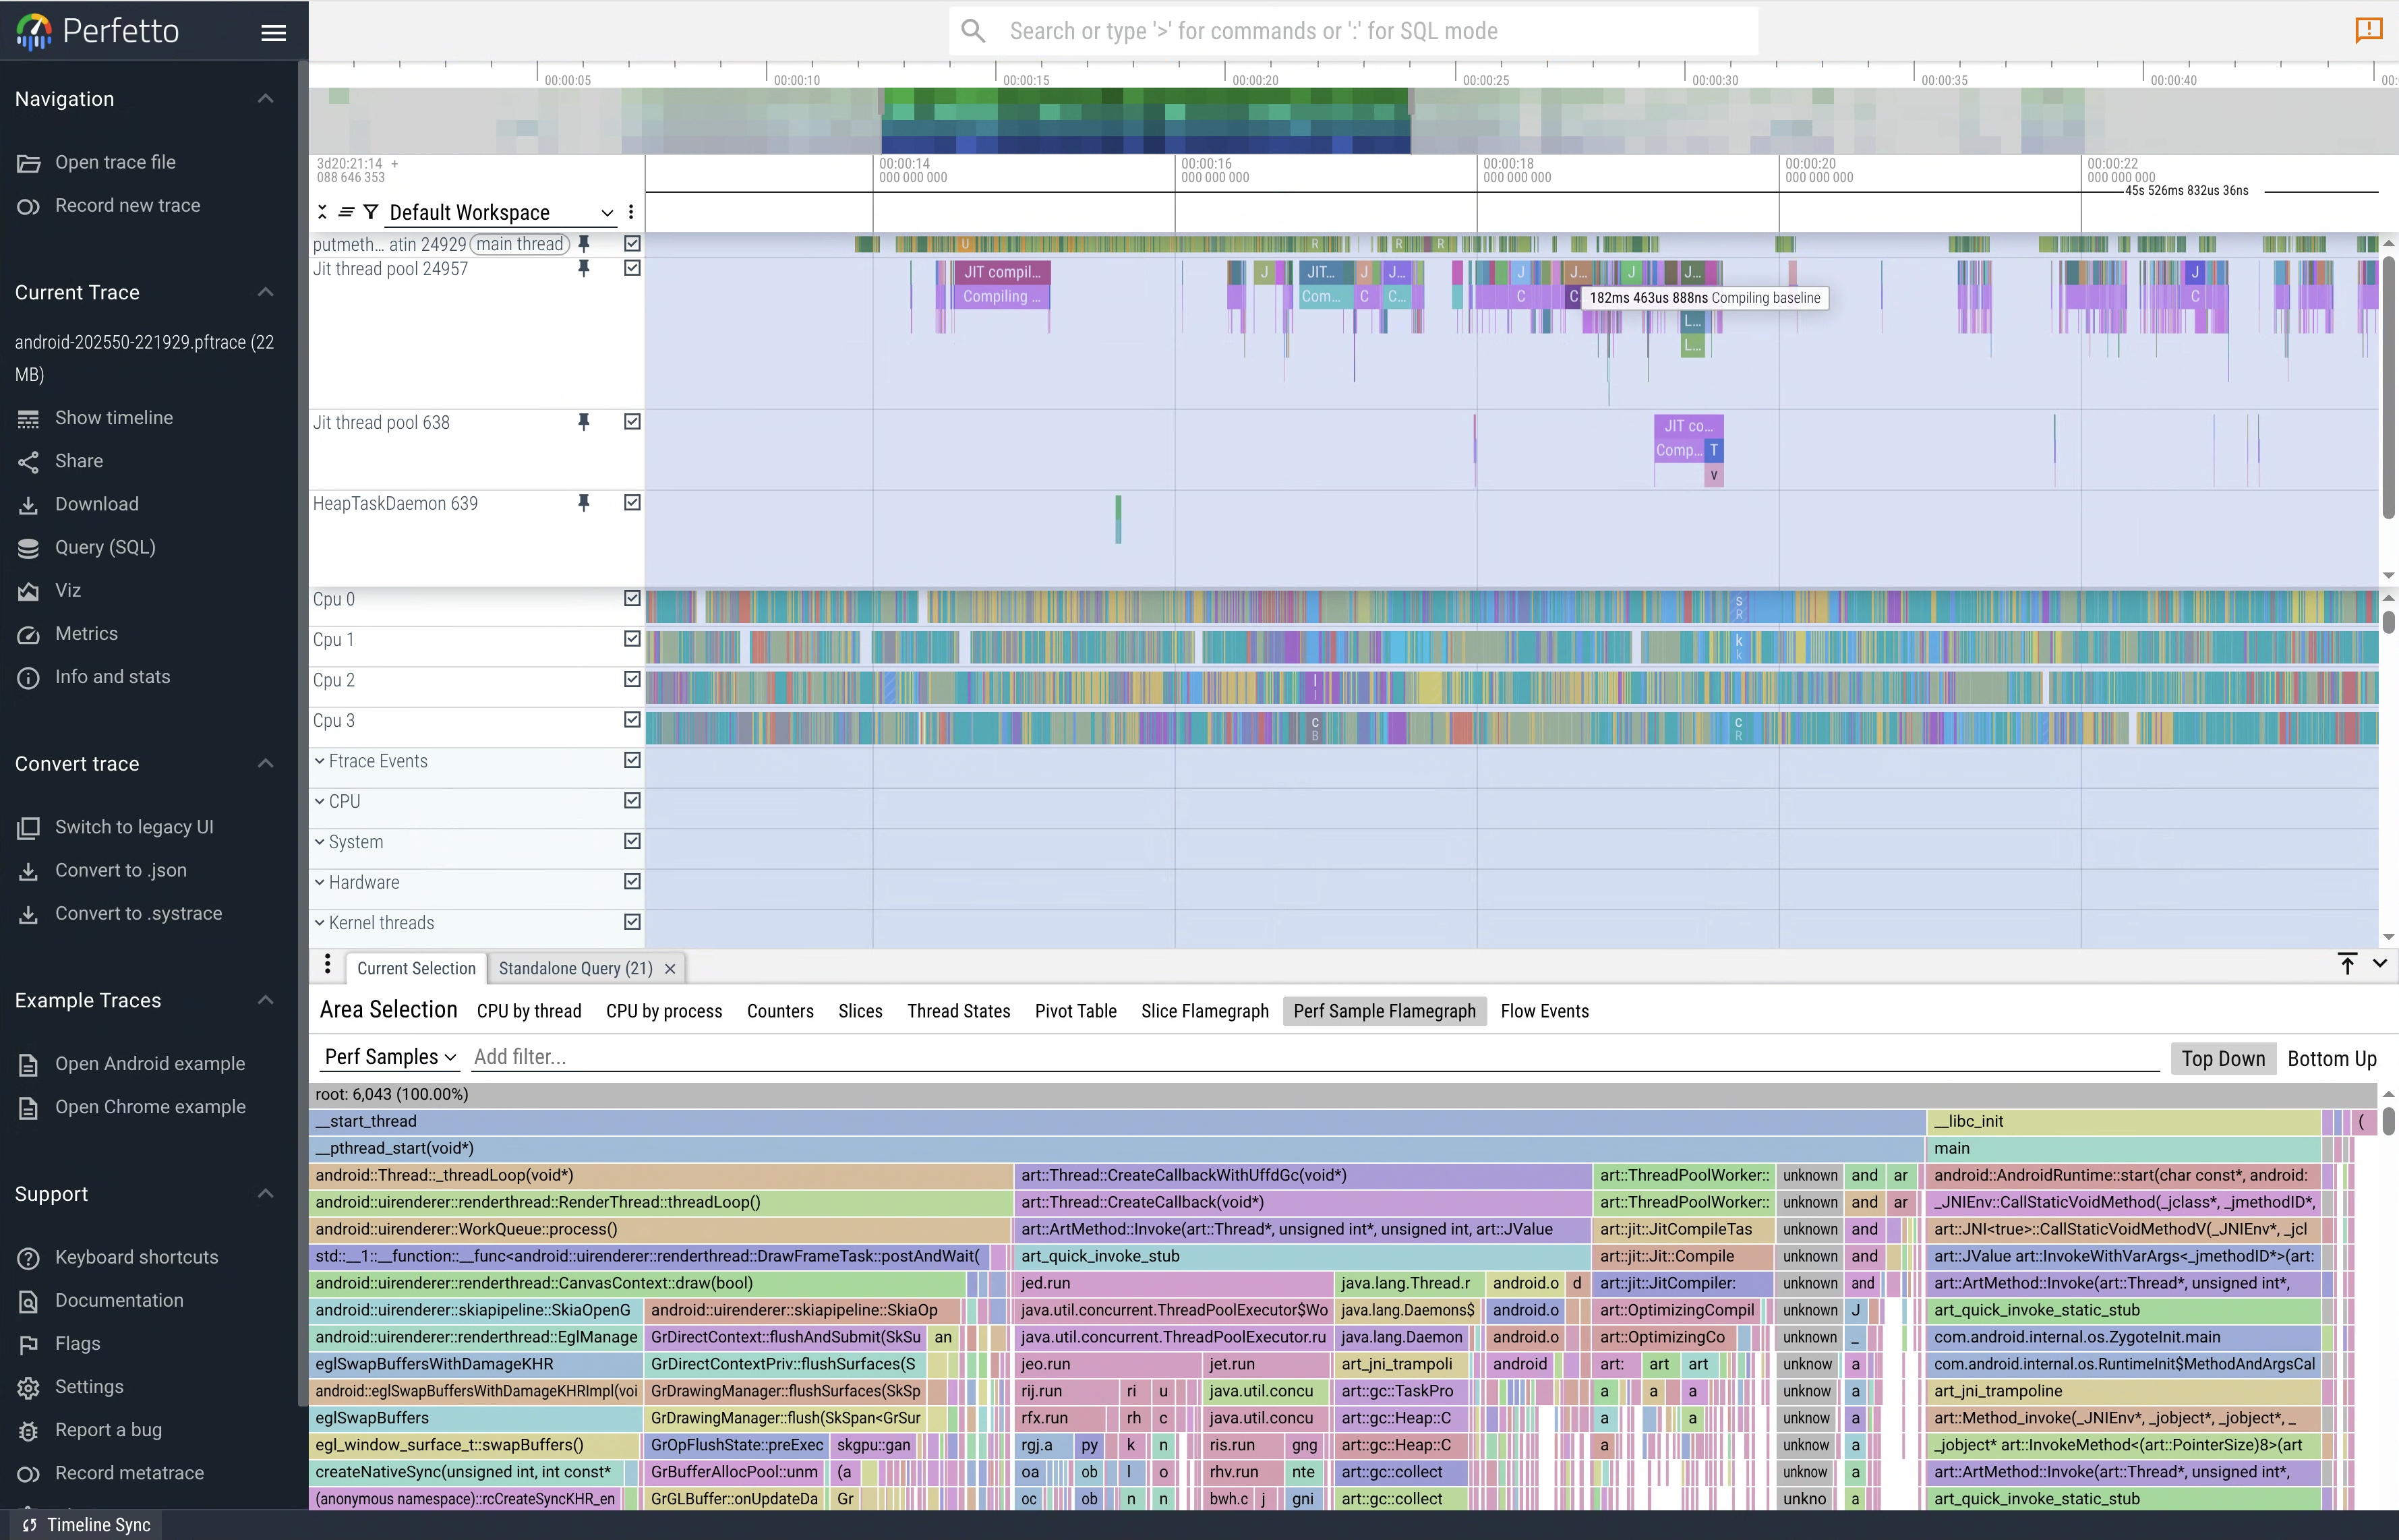
- Explore the trace by zooming/panning using WASD, and mouse for expanding process tracks (rows) into their constituent thread tracks. Press "?" for further navigation controls.
- Please also take a look at our Perfetto UI documentation page
Querying your first trace
As well as visualizing traces on a timeline, Perfetto has support for querying traces using SQL. The easiest way to do this is using the query engine available directly in the UI.
In the Perfetto UI, click on the "Query (SQL)" tab in the left-hand menu.
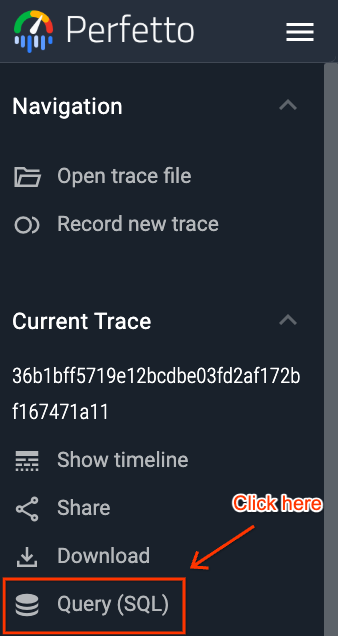
This will open a two-part window. You can write your PerfettoSQL query in the top section and view the results in the bottom section.
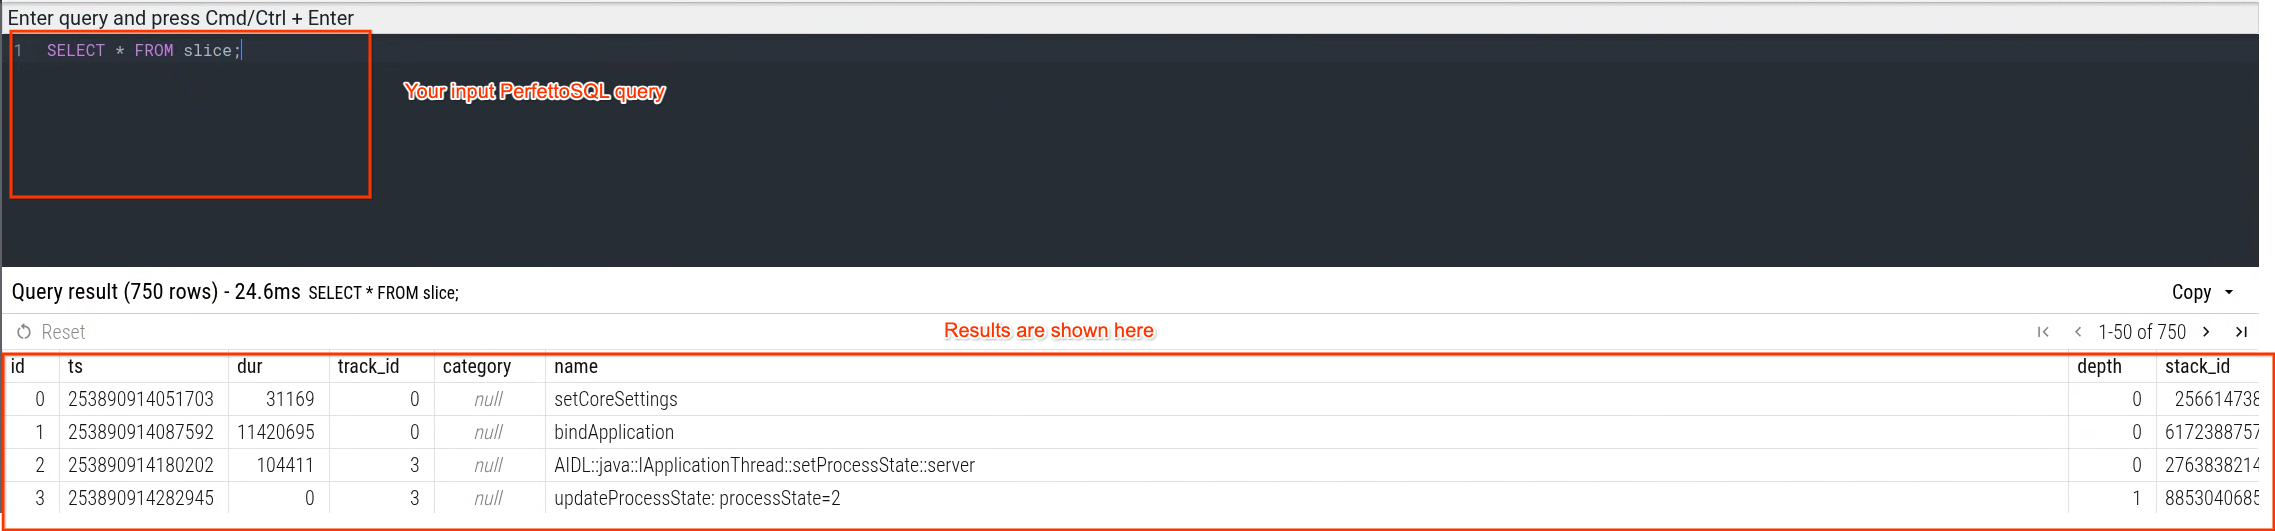
You can now execute queries. For example, to see all the processes captured in the trace, run the following query (you can use Ctrl/Cmd + Enter as a shortcut):
For example, to query the CPU scheduling information we recorded you can use:
INCLUDE PERFETTO MODULE sched.with_context;

SELECT *
FROM sched_with_thread_process
LIMIT 100;
For the CPU frequency information, you can do:
INCLUDE PERFETTO MODULE linux.cpu.frequency;

SELECT *
FROM cpu_frequency_counters
LIMIT 100;
For Android traces, to query the atrace slices, you can do:
INCLUDE PERFETTO MODULE slices.with_context;

SELECT *
FROM thread_or_process_slice
LIMIT 100;
And atrace counters are available by doing:
SELECT *
FROM counter
LIMIT 100;
Next steps
Now that you've recorded and analyzed your first system trace, you can explore more topics:
More data sources
A system trace can include data from many different parts of the system. Learn more about some of the most common data sources:
- Scheduling events: Get detailed information about which threads are running on which CPUs.
- CPU Frequency: See how the CPU frequency changes over time.
- System Calls: Trace the entry and exit of system calls.
For Android developers, it's also common to include:
More about trace recording
- Trace Configuration: Get a deeper understanding of how to configure traces.
- Tracing in the Background: Learn how to record traces over a long period of time.
More about trace analysis
To get the most out of the Perfetto UI, check out the detailed Perfetto UI documentation.
To learn more about programmatic analysis, see:
- Trace Analysis with SQL: Learn how to analyze traces using the Trace Processor and PerfettoSQL.
- Android Analysis Cookbooks: A collection of useful queries and visualization tips for working with Android traces.