Debugging scheduling blockages with tracing and callstack sampling
In this guide, you'll learn how to:
- Capture combined scheduling and callstack sampling traces.
- Perform precise callstack sampling based on scheduling events, rather than time-based / random sampling.
- Use the data to reason about lock contention, priority inversions and other scheduling blockage problems.
The problem we are after
A bug was causing the Android SystemUI main thread to block for 1-10 ms when pulling down the notification shade, causing occasional stutter in the shade animation. The bug was fairly reproducible.
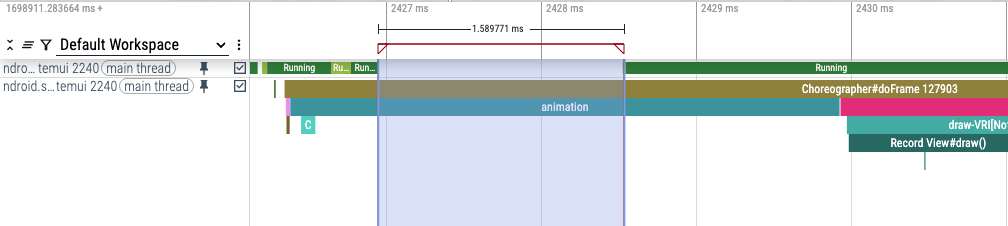
In the trace, the bug manifests as the main thread of Android's systemui getting blocked (i.e. descheduled) in the middle of an animation, like this:
Spoiler: the root cause
We root caused this using call-stack sampling in Perfetto triggered on
sched_switch + sched_waking. This gives callstacks precisely at the points
where threads either suspend while trying to acquire an already-taken lock or
wake up a waiter after releasing the lock.
The actual problem was the following:
- Android's SystemUI uses Kotlin coroutines.
- Internally, Kotlin coroutines rely on ScheduledThreadPoolExecutor.
- SystemUI's main thread is trying to schedule low-priority coroutines.
- Internally, this translates into appending future tasks onto the task queue using a background thread pool.
- Enqueueing a task in ScheduledThreadPoolExecutor requires a ReentrantLock.
- That same lock is required by the background threads to pull tasks from the queue.
- ReentrantLock isn't aware of the priority of the waiters. When the lock is released, it wakes up one waiter thread at a time, in order of lock() calls.
- There are many background-priority coroutines in SystemUI, so that lock is frequently contended by BG threads.
- ReentrantLock is also not CPU-aware and can end up serializing CPU-affine threads on the same core when waking up waiters after an unlock().
- This leads to a form of priority inversion, where the main thread ends up waiting for a long chain of background threads before being able to acquire the lock.
Methodology
If you want to jump directly to the trace config, see Appendix: final trace config used.
If instead you want to learn our debugging journey and how we got to that config, read below.
Our journey started with a colleague asking if we could record callstack samples at 10KHz or higher. The answer was a blanket "forget about it": due to the way callstack sampling works on Android, that is simply unachievable. (Need to uncompress debug sections; async unwinding where the kernel copies raw stacks over the perf_event buffer for each samples; DWARF-based unwinding).
The discussion got interesting when we asked "why do you need hi-rate sampling?". Our colleague told us about this bug: "I want to know where the main thread blocks and resume execution. If the samples are frequent enough, with some luck I might be able to get the right callstack with the culprit".
Unfortunately even the most perf-savy engineers often tend to conflate "callstack sampling" with random sampling or time-based (or instruction/cycle-based) sampling, forgetting that callstack sampling is a far more powerful machinery.
While random sampling is undeniably one of the most popular forms of callstack sampling, such methodology is more useful to answer questions of the form "where is a function spending CPU cycles?" or "what could I do to reduce the CPU usage of my task?". None of these apply here.
Callstack sampling on Linux - and many other OSes - is far more powerful. To simplify, you can think of callstack sampling as "grab a callstack every N times a specific event happens" (see also this easyperf.net blogpost for an in-depth explanation).
The interesting part is which specific event. Typically this can be:
- The overflow of a timer, to achieve the "grab a callstack every X ms".
- The overflow of a PMU counter, e.g. to achieve the "grab a callstack every N instructions retired / M cache misses"
- Any kernel trace point available in
/sys/kernel/tracing/event/**/*.
The latter is the interesting option that can turn callstack sampling into a practical Swiss army knife. Now, there are a large number of trace points defined in the kernel, but two of them are particularly interesting here:
sched_switch: this is triggered every time a context switch happens. The interesting case is when you try to acquire a lock → the lock is held → you ask the kernel to put the thread on a wait chain → the kernel schedules you out. Internally this usually ends up in asys_futex(FUTEX_WAIT, ...).
This is important because it is the moment when the thread we care about blocks.sched_waking: this is triggered whenever a thread makes another thread eligible to be scheduled again. Note that "eligible to be scheduled" != "scheduled now". A thread can be put on the runqueue (i.e. scheduled) many milliseconds after it has been woken up. Other threads might be scheduled meanwhile.
This is important because it is the moment when another thread eventually wakes up (unblocks) our thread.
So the overall game is the following: if you can see the callstack where your thread gets blocked, and where another thread unblocks your thread, those two callstacks usually give enough information to figure out everything else via code search.
This technique is not particularly novel nor Linux-specific. If you fancy reading a more detailed writeup, look at Bruce Dawson's The Lost Xperf Documentation–CPU Usage (Precise), which explains this use-case in detail on Windows (most of those principles apply on Linux as well).
Our first failed attempt
At first we got over-excited and wrote a config that grabs a callstack on every
sched_switch and on every sched_waking. The config used is provided below
for reference (don't use it) together with some useful commentary.
linux.perf is the data source in Perfetto that performs callstack sampling
(the equivalent of Linux's perf or Android's simpleperf cmdline tools).
You'll notice there are two instances of the data source. Why? This reflects how the perf_event_open syscall works under the hoods: if you want callstacks on something that something must be a leader counter. In our implementation each perf data source maps to a leader counter, with its own perf buffers.
So we have one data source for sched_switch and one for sched_waking, the
two trace points we are after.
period:1 means "sample every event". We really don't
want to do any sampling here. We are not after a generic aggregated flamechart.
We want to catch a very specific (set of callstacks) for an event that happens
precisely once per frame. No sampling, thank you.
ring_buffer_pages: 2048 uses a larger-than-usual perf event ring buffer.
This is the buffer where the kernel queues all the samples, and our traced_perf
daemon reads them.
A bigger buffer gives more ability to handle bursts.
The size is in pages, so 2048 * 4KB -> 8MB.
Unfortunately higher values seem to fail, because the kernel is unable to find a
contiguous mlockable region of memory.
# *** DO NOT USE THIS CONFIG ***
# This overruns the callstack sampler (See commentary).
# Improved config below in appendix.

#Part 1

data_sources {
  config {
    name: "linux.perf"
    perf_event_config {
      timebase {
        period: 1
        tracepoint {
          name: "sched/sched_switch"
        }
        timestamp_clock: PERF_CLOCK_MONOTONIC
      }
      callstack_sampling {
        kernel_frames: true
      }
      ring_buffer_pages: 2048  # 8MB
    }
  }
}

# Part 2

data_sources {
  config {
    name: "linux.perf"
    perf_event_config {
      timebase {
        period: 1
        tracepoint {
          name: "sched/sched_waking"
        }
        timestamp_clock: PERF_CLOCK_MONOTONIC
      }
      callstack_sampling {
        kernel_frames: true
      }
      ring_buffer_pages: 2048  # 8MB
    }
  }
}
Unfortunately this approach sounded good in theory but lead to a catastrophic failure.
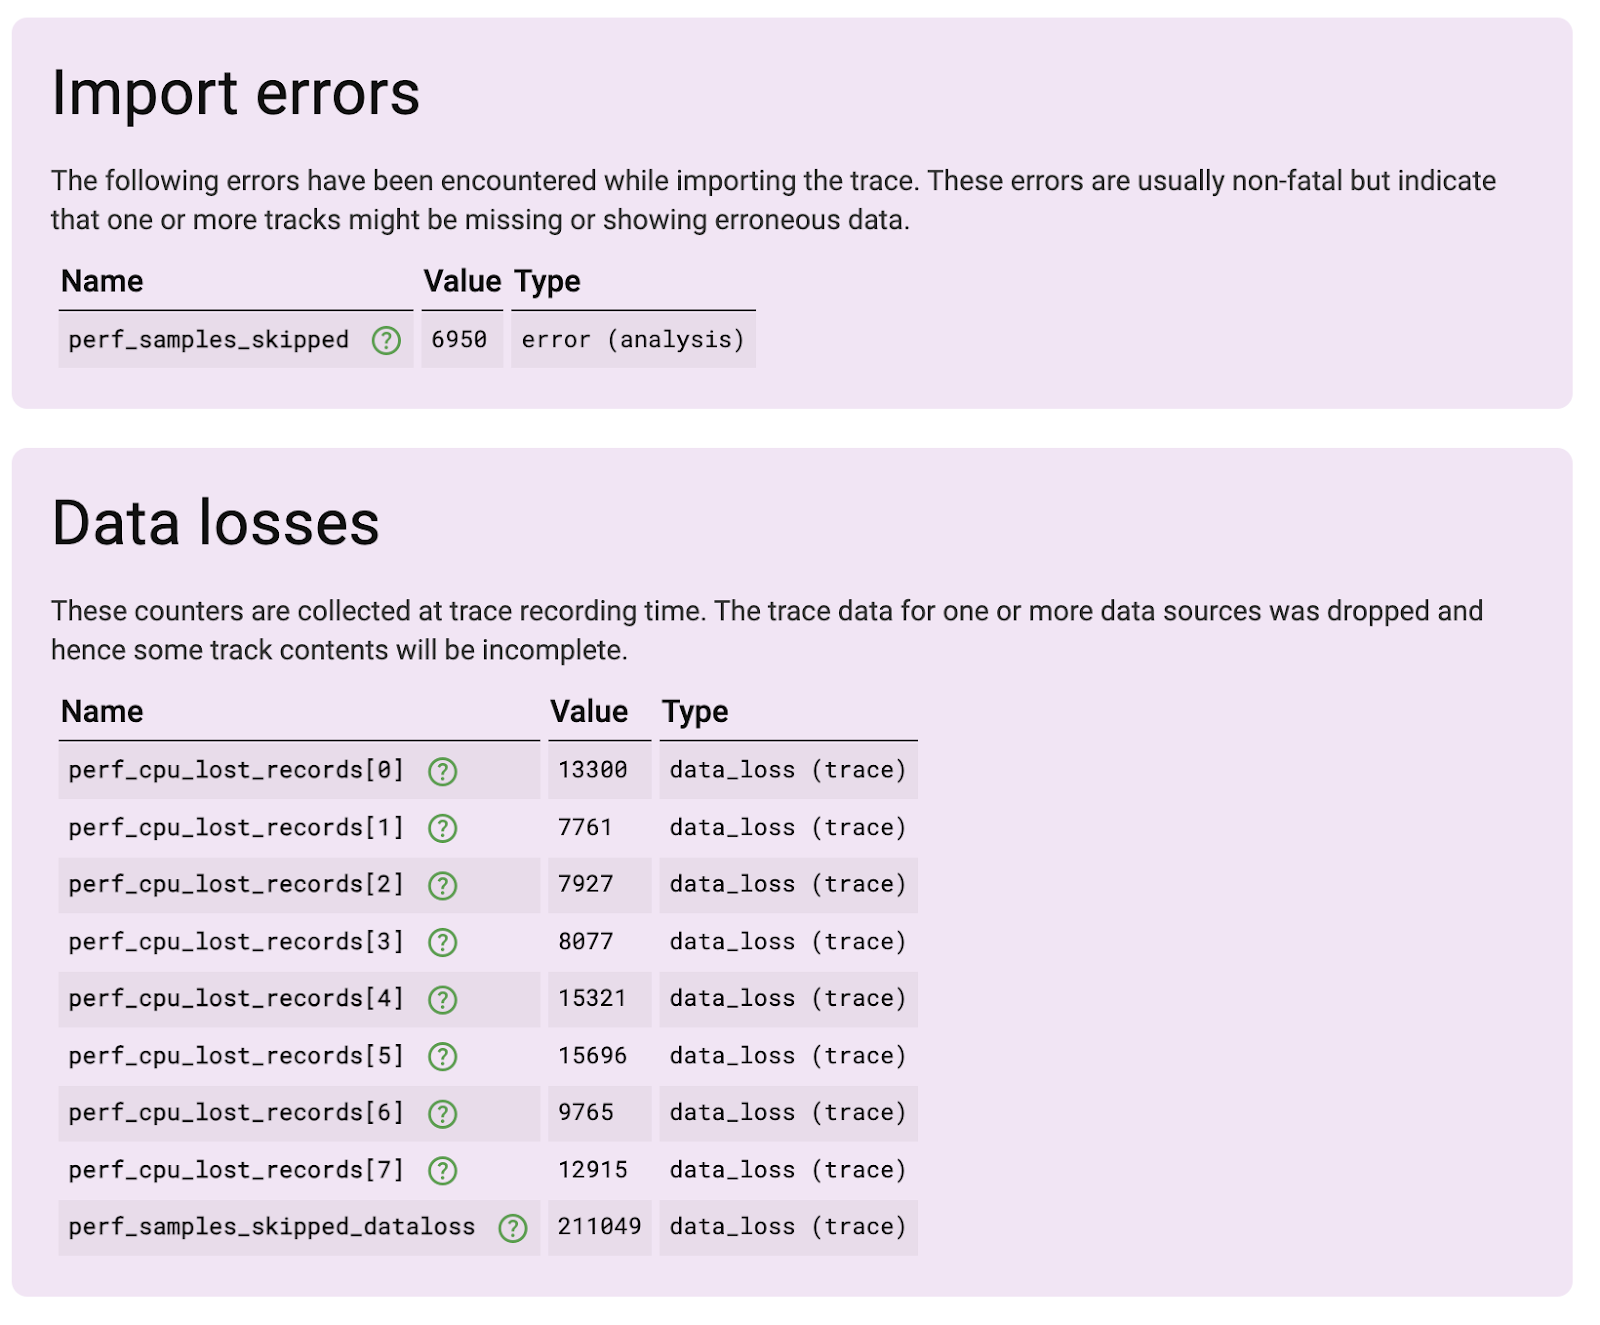
Sampling on each sched_switch is far too much. On an idle-ish phone with screen on, there are on average ~20K scheduling events/second, with bursts that go far beyond that rate when starting to touch the screen. Neither the kernel, nor traced_perf can keep up with that rate.
Trace point filters to the rescue
After all, we don't need callstacks for every scheduling activity in the system. We really care about the main thread of SystemUI, and any other thread involved in its blockage.
So in our next iteration we calmed down the callstack sampler by filtering only SystemUI threads, as shown below.
The "filter" operator is passed all the way down to the kernel, which does filtering at the trace point level (i.e. before the callstack sample is emitted)
There are a few things to keep in mind:
- Each sched_switch event has two thread names (called "comm"s): the one being
scheduled out (
prev_comm) and the new thread being scheduled in (next_comm). We want to grab all instances when we are scheduling in or out SystemUI's main thread. - sched_waking instead has only the "comm" of the thread being woken up.
So we updated our config adding as follows:
...
tracepoint {
name: "sched/sched_switch"
filter: "prev_comm ~ \"*systemui*\" || next_comm ~ \"*systemui*\"
}
...
tracepoint {
name: "sched/sched_waking"
filter: "comm ~ \"*systemui*\"
}
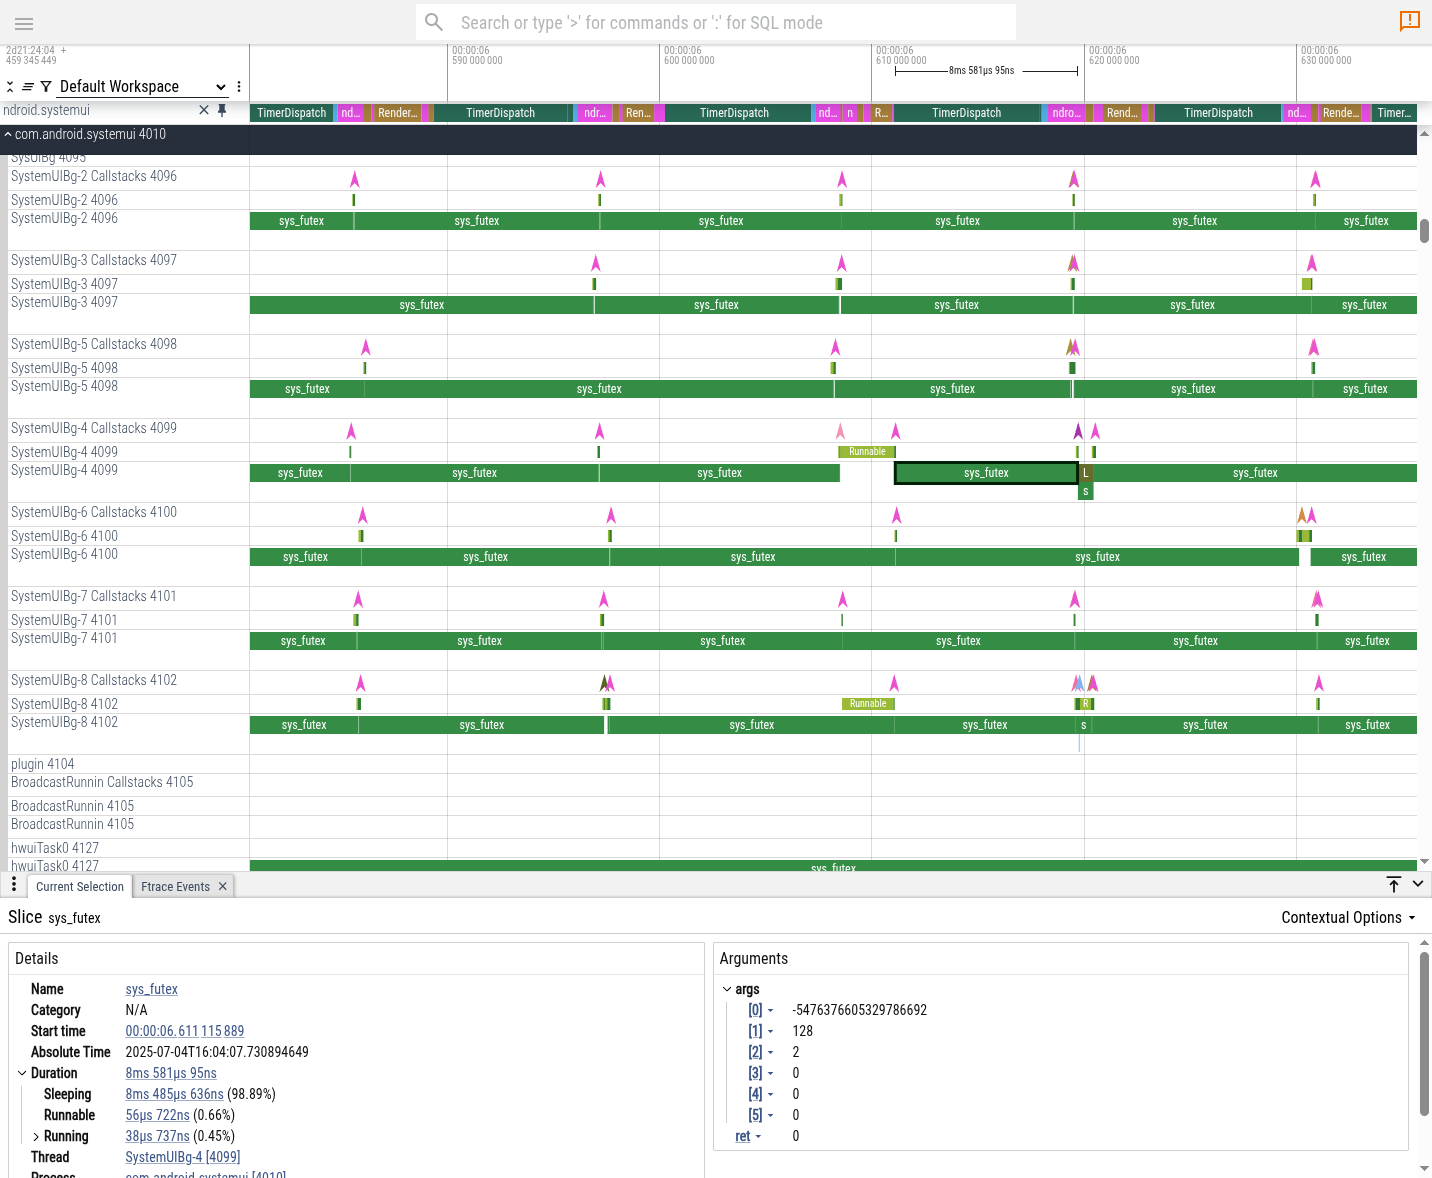
...The recording overruns went away and we got a far more useful trace back. Now every thread in the trace has three tracks:
- One with the scheduling state of the thread (Running, Runnable, ...)
- One with the usual tracing slices (Choreographer#doFrame, Animation)
- A new one with callstacks (the colored chevrons). Each chevron corresponds to a sample. If you click on it you can see the callstack.
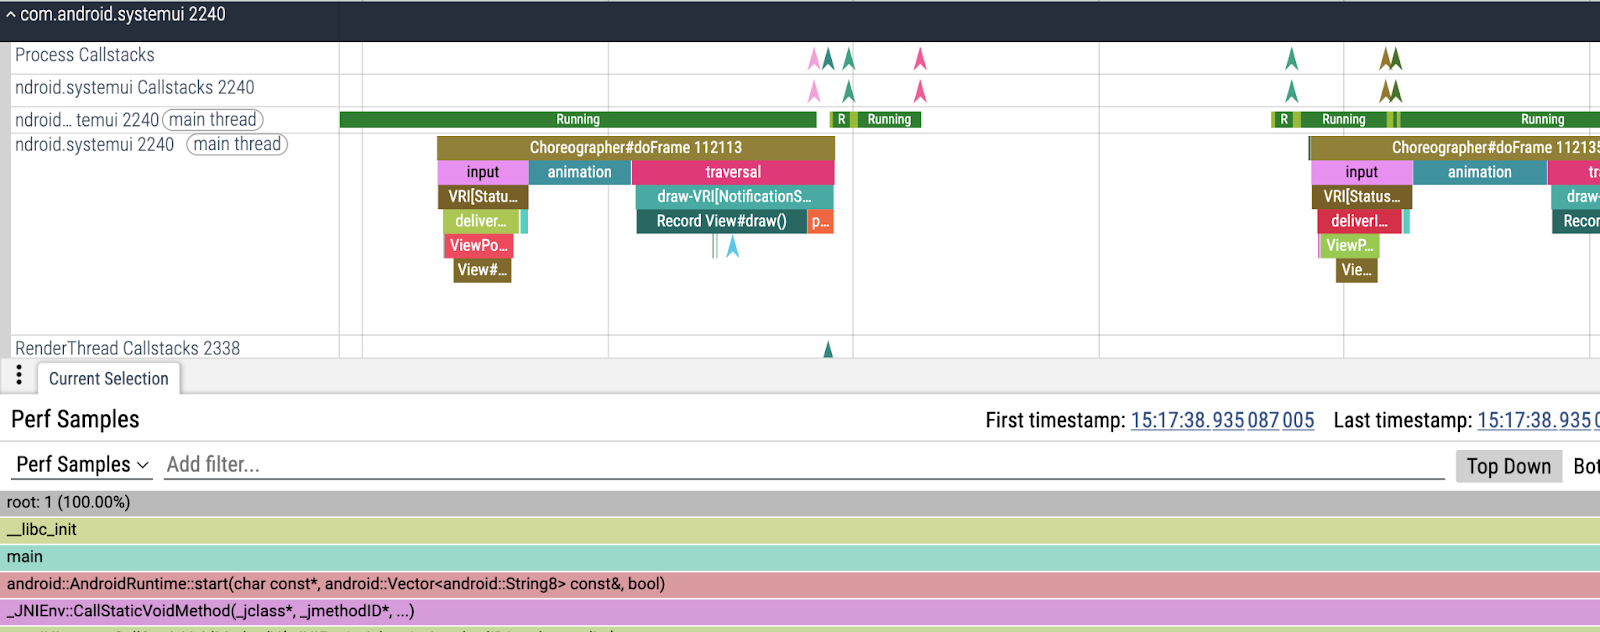
Now we can zoom into the main thread blocking we were looking for and finally find where we got blocked.
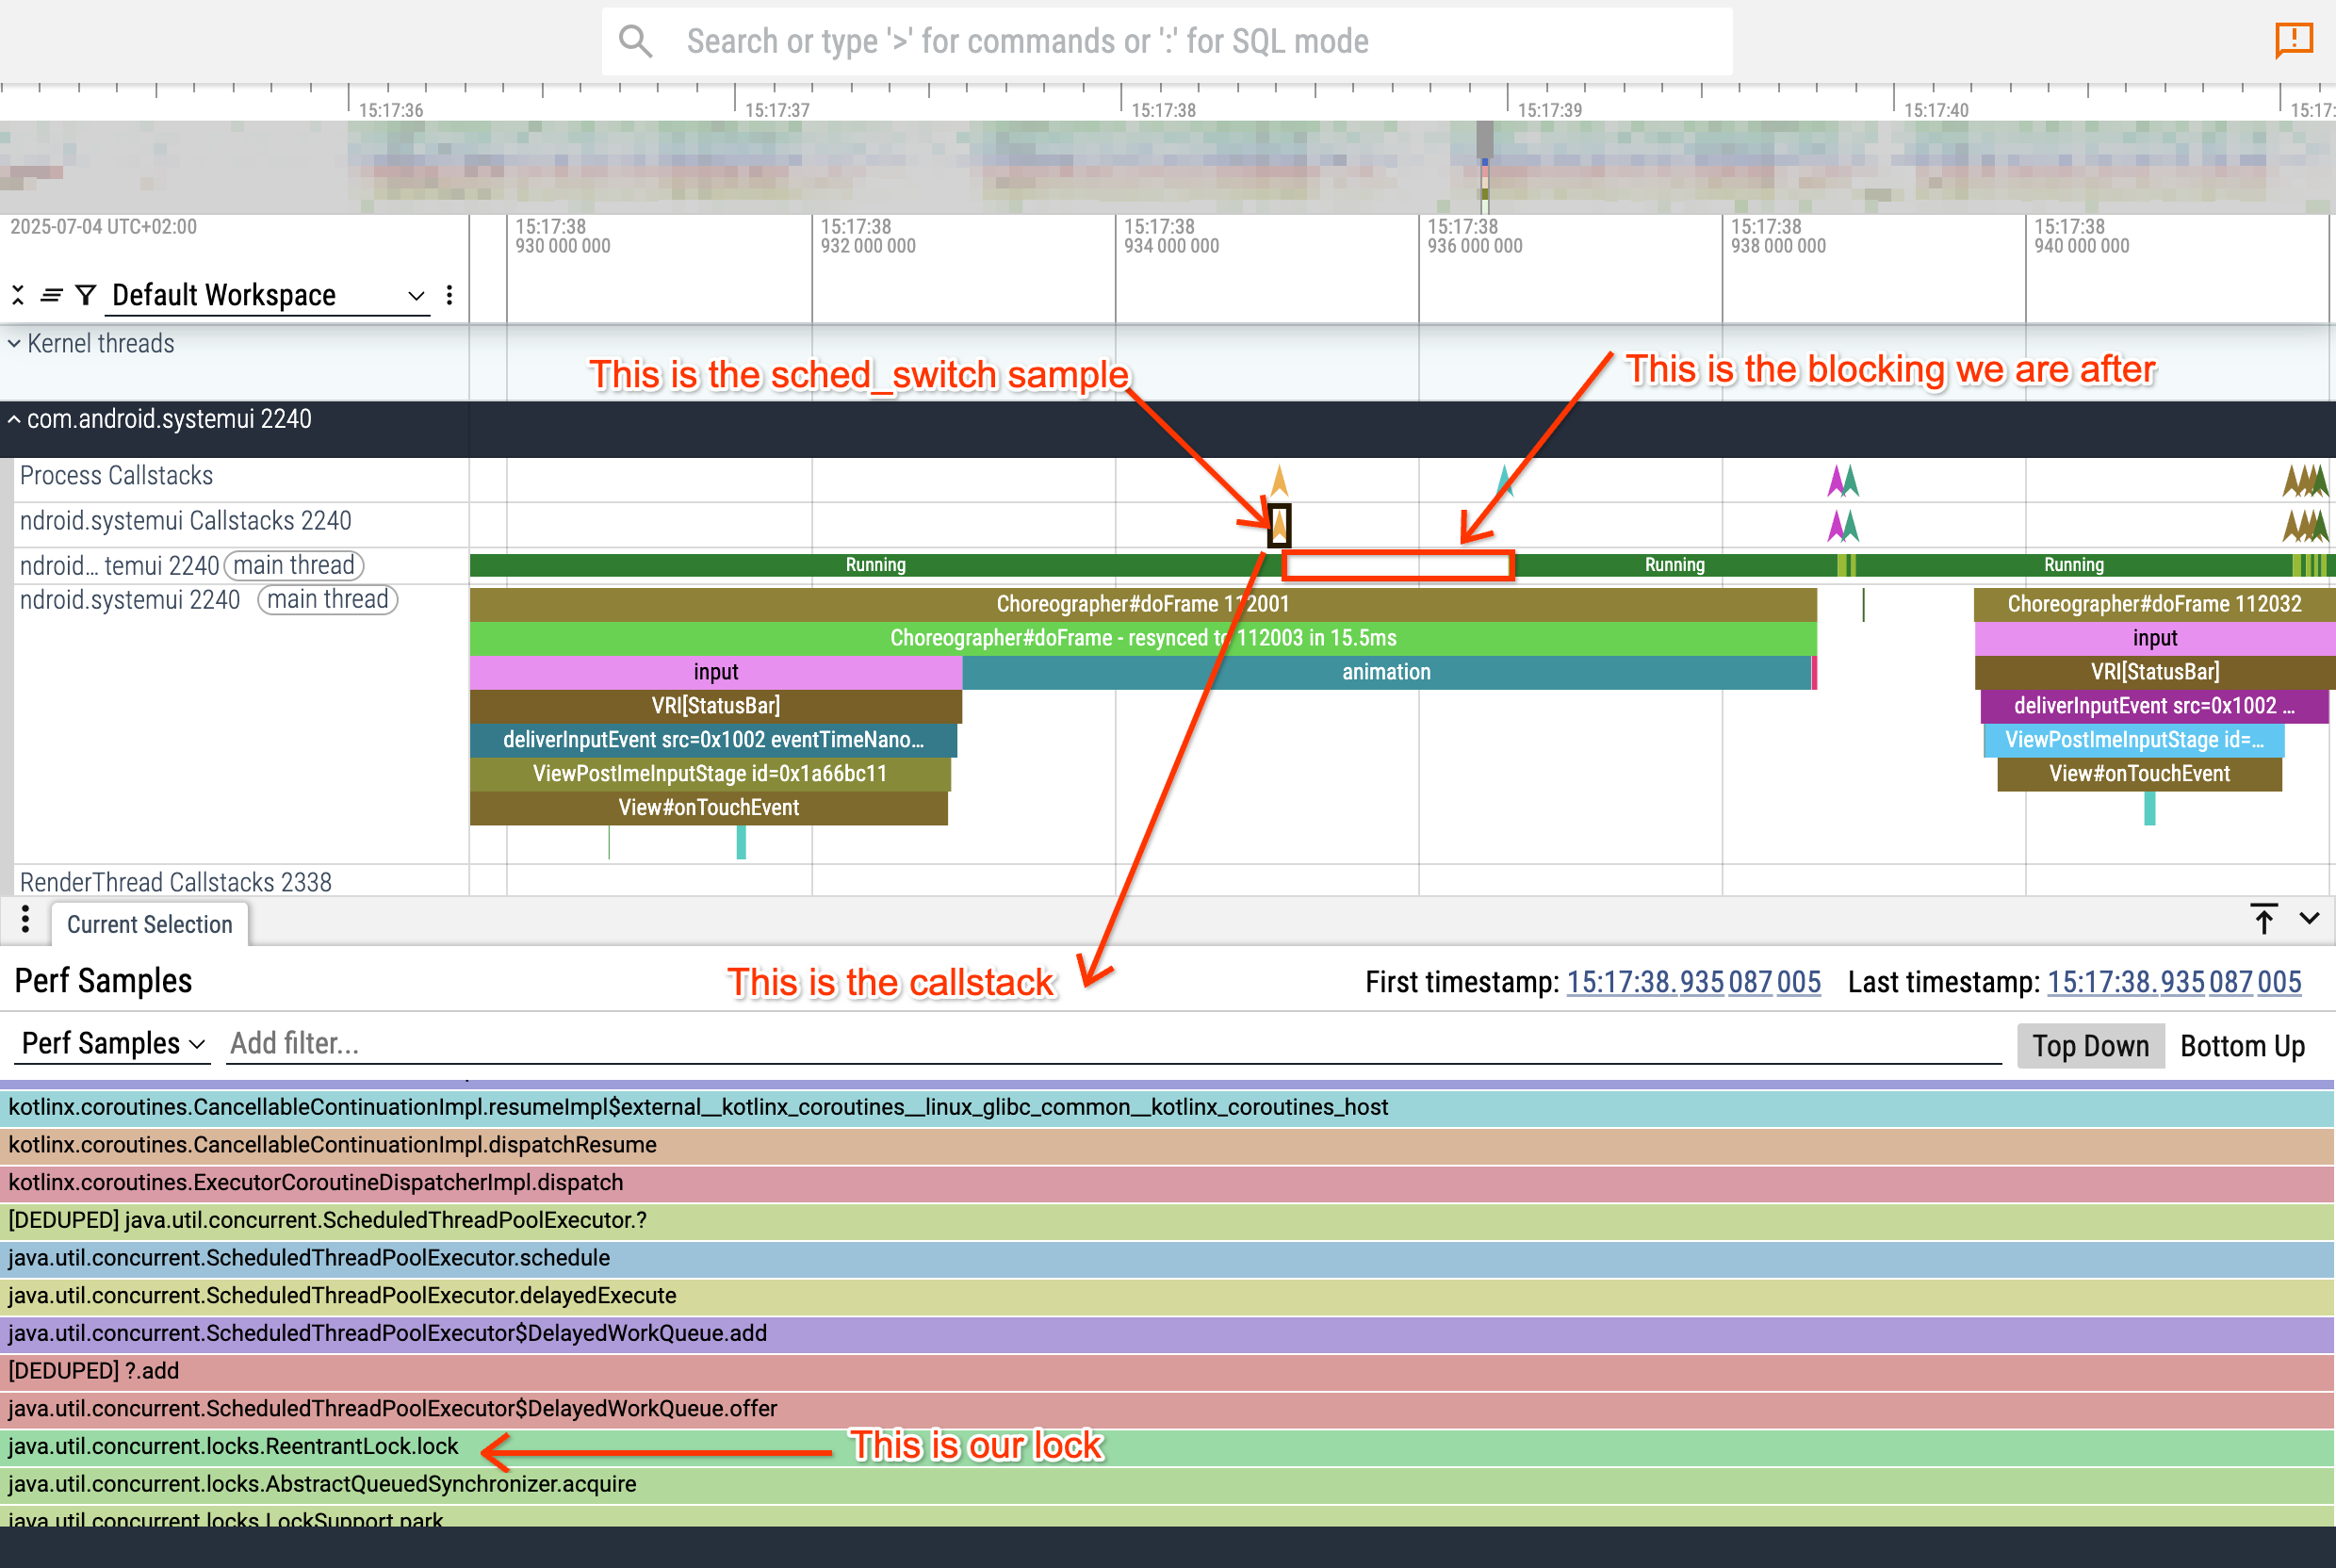
We got our first piece of intel: sysui's main thread gets blocked on a mutex while trying to post a future task onto the ScheduledThreadPoolExecutor's task queue.
There are a number of questions here:
- Why posting a task requires a lock (this is more an off-topic Kotlin coroutine architectural design question)
- Why is this lock held for 1.5ms?
- Who holds this lock?
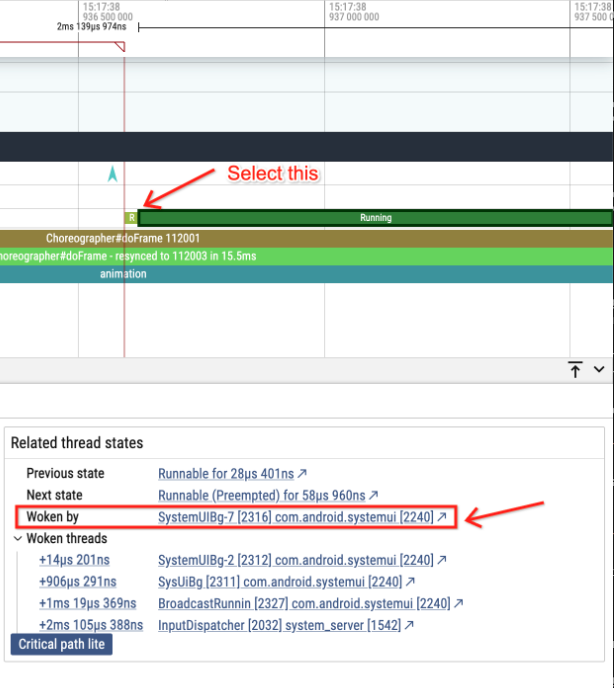
In order to answer this question, let's follow the events in reverse. Click on the Running slice of the main thread after the mysterious blocking point and look at "woken by". That indicates the thread that woke us up.
Click on that and we'll see we are woken up by a BG thread.
Clicking on that link takes us to the waker thread's timeline.
But here the magic happens. Because we enabled stack sampling also on
sched_waking, now our waker has a callstack as well.
Selecting the chevron will show us the callstack that caused the wakeup:
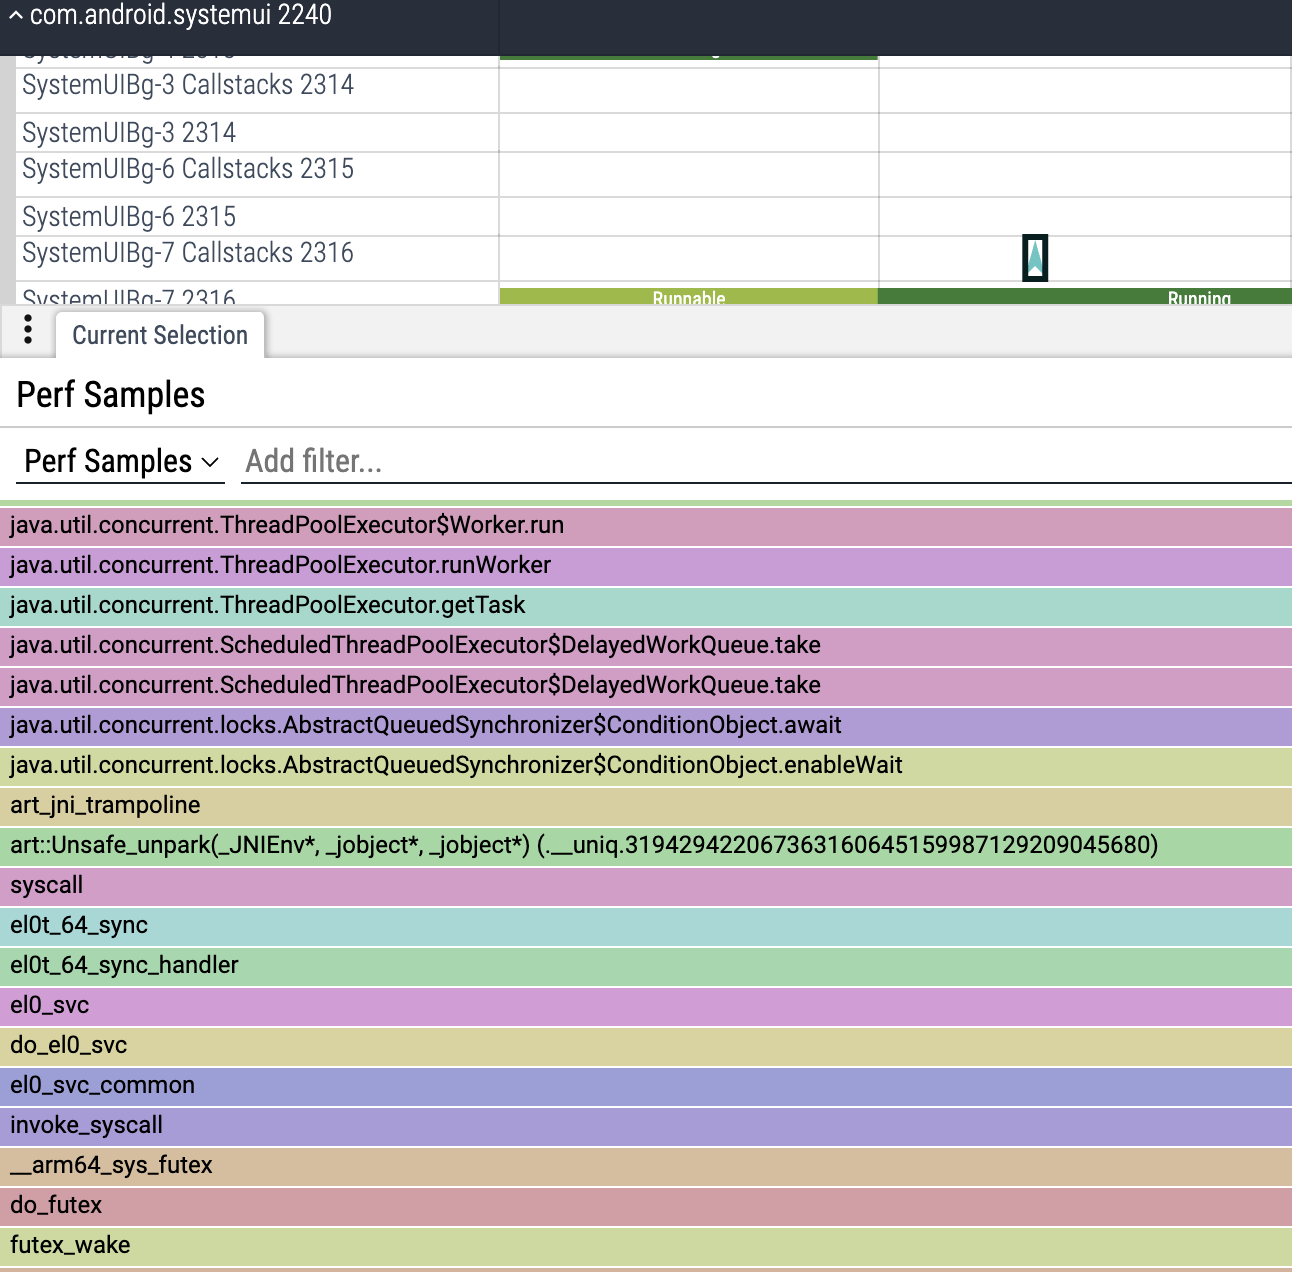
What we see here is that the execution of a background task takes the lock, takes a task from the queue, and releases the lock.
The act of releasing the lock eventually wakes up the main thread. This is not the full answer we were looking for though. How did we end up with this one random BG thread owning the lock? This one thread ran just a tiny task for 160 us. But the whole blocking time of the main thread was 1.5 ms, 10x more. What happened meanwhile?
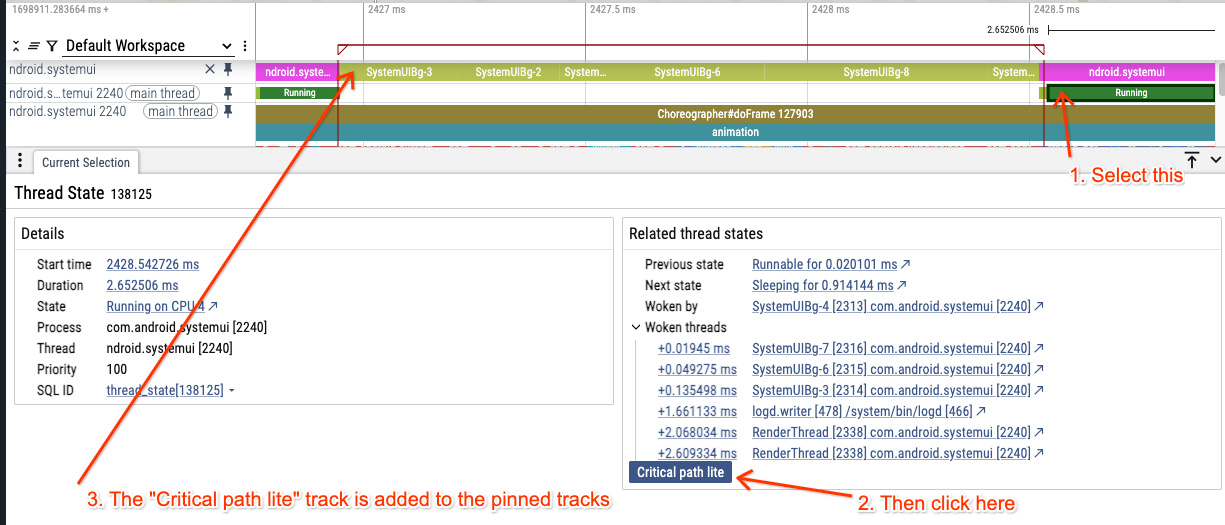
We can use the "Critical path lite" button to see the list of threads that lead to the change of state of the main thread, without having to follow manually the various "Woken by" labels in the thread state tracks:
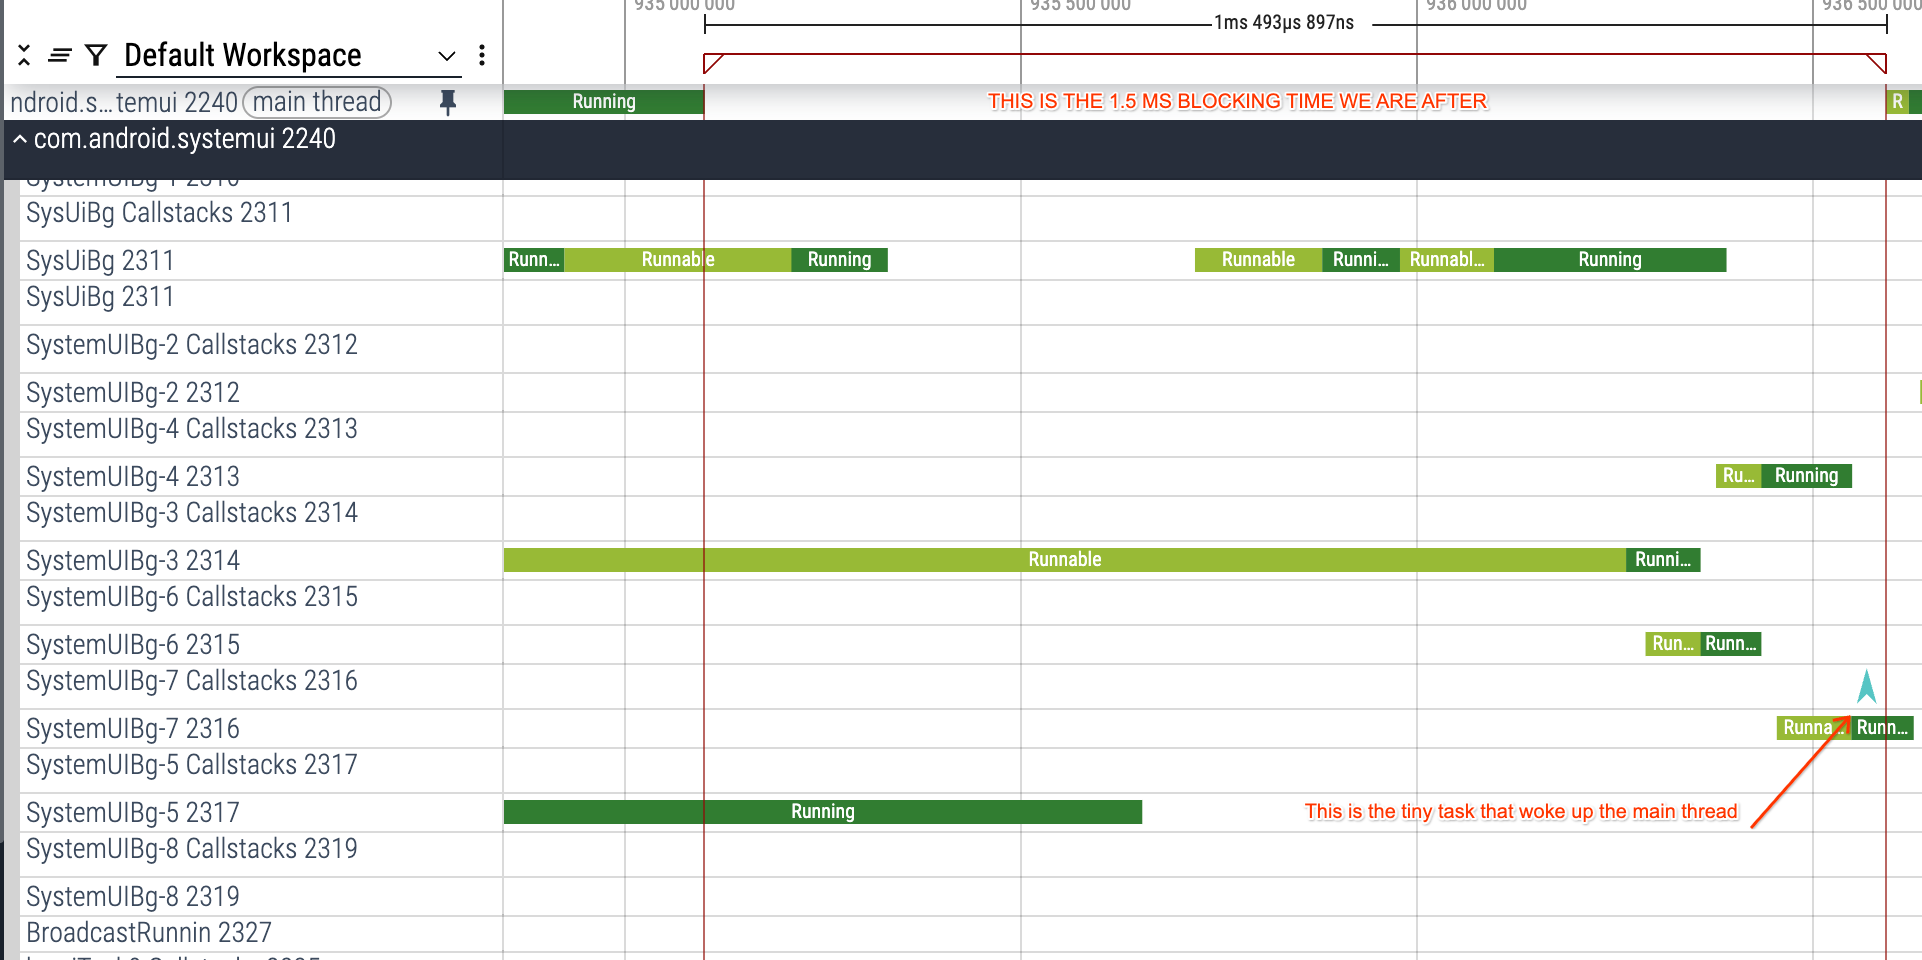
Now there is something suspicious here, let's recap:
- The main thread is blocked for 1.5 ms
- We are blocked on the ScheduledThreadPoolExecutor lock
- The thread that woke us up was very short (150us)
- What happened in the remaining 1.35 ms?
- There are a bunch of other BG threads active around the same timeframe
- At this point we suspect this is a form of priority inversion (in the more general and lax sense of priority inversion).
This is what's happening:
- The main thread is trying to acquire a lock.
- The lock is taken by a bg thread (so far so good, this can happen).
- Meanwhile other BG threads are trying to acquire the lock, and joining the list of waiters for the lock.
- When the BG thread is done, another BG thread wins the race, instead of the main thread, which has a higher scheduling priority.
Unfortunately we can't see (yet) callstacks of the BG threads, because we were filtering only for sysui main thread (and its wakers). We will have to tweak the config one more time for that.
Re-capturing the trace
Let's tweak the config a little bit and add also the BG threads:
tracepoint {
name: "sched/sched_switch"
filter: "prev_comm ~ \"*systemui*\" || next_comm ~ \"*systemui*\" || prev_comm ~ \"SystemUIBg-*\" || next_comm ~ \"SystemUIBg-*\""
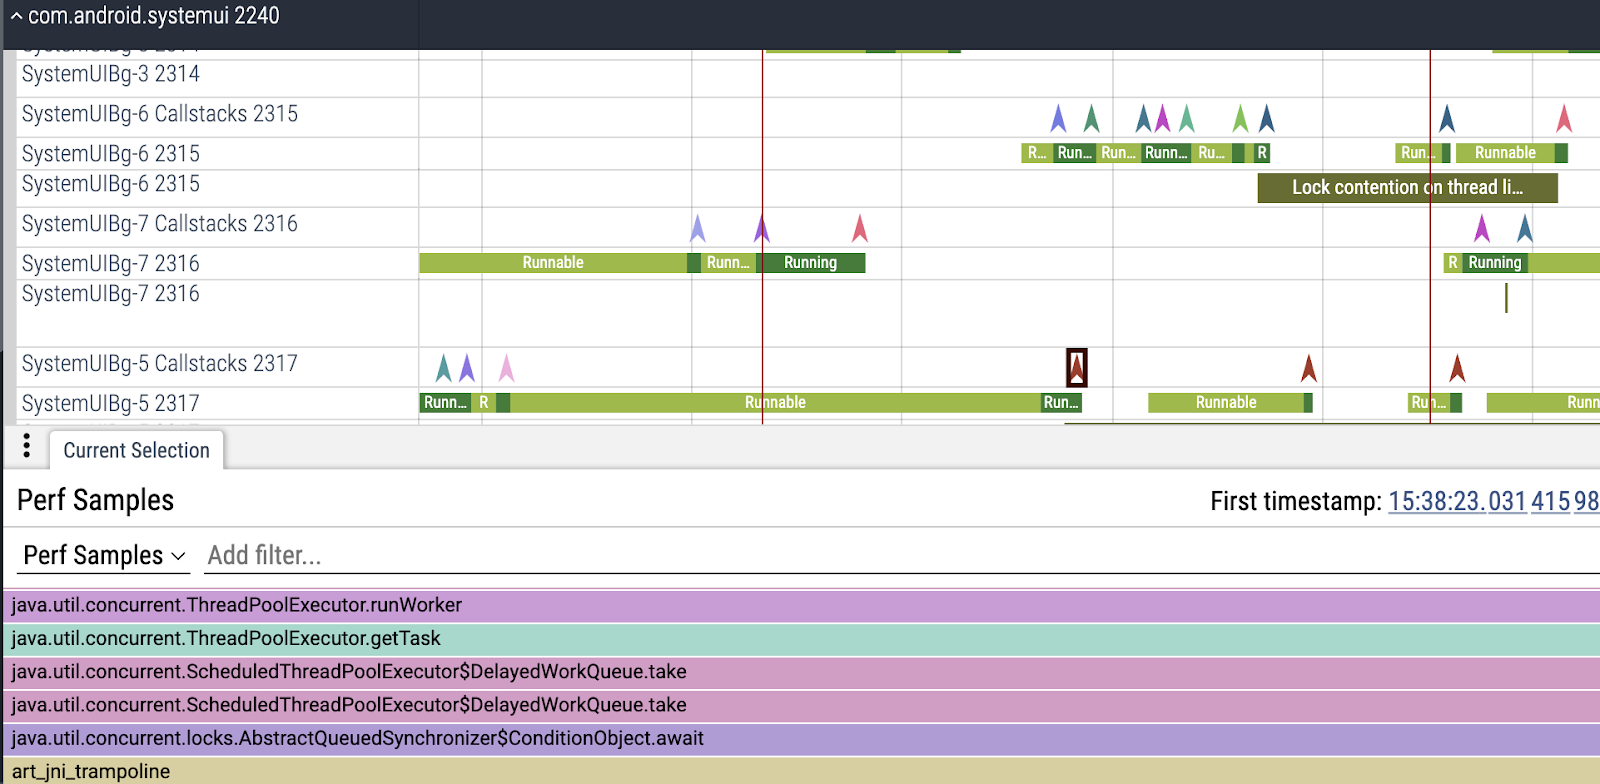
}The new trace looks like this. You'll notice now we have more chevrons, as we have callstacks for each scheduling event of the SystemUiBG* threads as well. Clicking on them confirms our theory. All those BG threads are all acquiring and releasing the ScheduledThreadPoolExecutor lock.
At this point we can reconstruct the full sequence of events.
Each worker thread in the ScheduledThreadPoolExecutor does the following:
- Acquire the lock
- Pull a task from the queue
- Release the lock
- Run the task
(3) Causes the wake up of another thread waiting for the lock.
Unfortunately a few things go wrong here:
Because of the large number of BG coroutines, there is a large number of BG threads queued on the lock, trying to extract tasks. The underlying ReentrantLock implementation will notify them in queueing order, increasing the blocking time of the main thread.
The ReentrantLock implementation is different than a standard
synchronized (x) {...}monitor. While a monitor is backed by a standard in-kernel futex, ReentrantLock has its own re-implementation of the waiters list in Java, which manually parks/unparks threads, somewhat shadowing the job that a kernel would do. Unfortunately this implementation is not aware of CPU affinity of threads, and can lead to suboptimal decisions when waking up a waiters upon unlock(). In fact, it can end up unparking a thread that was bound to the same CPU of the current one.The Linux/Android CFS scheduler is NOT work conserving when using the default SCHED_OTHER policy, and will NOT aggressively migrate threads across cores to minimize scheduling latency (it does so to balance power vs latency). Because of this, the woken up thread ends up waiting for the current thread to finish its task, even though the lock is released. The end result is that the two threads end up executing in linear order on the same CPU, despite the fact that the mutex was unlocked most of the time. This serialization of the BG workload and amplifies even more the blocking time of the main thread. You can notice the absence of real parallelization of the SystemUIBg-* threads in the screenshots above.
Appendix: final trace config used
duration_ms: 10000

buffers: {
  size_kb: 102400
  fill_policy: DISCARD
}

data_sources {
  config {
    name: "linux.perf"
    perf_event_config {
      timebase {
        period: 1
        tracepoint {
          name: "sched/sched_switch"
          filter: "prev_comm ~ \"*systemui*\" || next_comm ~ \"*systemui*\" || prev_comm ~ \"SystemUIBg-*\" || next_comm ~ \"SystemUIBg-*\""
        }
        timestamp_clock: PERF_CLOCK_MONOTONIC
      }
      callstack_sampling {
        kernel_frames: true
      }
      ring_buffer_pages: 2048
    }
  }
}

data_sources {
  config {
    name: "linux.perf"
    perf_event_config {
      timebase {
        period: 1
        tracepoint {
          name: "sched/sched_waking"
          filter: "comm ~ \"*systemui*\" || comm ~ \"SystemUIBg-*\""
        }
        timestamp_clock: PERF_CLOCK_MONOTONIC
      }
      callstack_sampling {
        kernel_frames: true
      }
      ring_buffer_pages: 2048
    }
  }
}

# include scheduling data via ftrace
data_sources: {
  config: {
    name: "linux.ftrace"
    ftrace_config: {
      ftrace_events: "sched/sched_switch"
      ftrace_events: "sched/sched_waking"
      atrace_categories: "dalvik"
      atrace_categories: "gfx"
      atrace_categories: "view"
    }
  }
}

# include process names and grouping via procfs
data_sources: {
  config: {
    name: "linux.process_stats"
    process_stats_config {
      scan_all_processes_on_start: true
    }
  }
}
Appendix: adding syscall tracing
As a further note, in hindsight the trace could have been augmented with
syscall tracing, adding instrumentation of sys_futex calls.
This is just a matter of adding this line to the ftrace config:
syscall_events: "sys_futex" as follows:
data_sources: {
  config: {
    name: "linux.ftrace"
    ftrace_config: {
      syscall_events: "sys_futex"
      ftrace_events: "sched/sched_switch"
      ftrace_events: "sched/sched_waking"
      atrace_categories: "dalvik"
      atrace_categories: "gfx"
      atrace_categories: "view"
    }
  }
}
The resulting trace would have looked like this: