
Recording In-App Traces with Perfetto
In this guide, you'll learn how to:
- Use the Perfetto SDK to add custom trace points to a C++ application.
- Record a trace containing your custom events.
- Visualize the trace in the Perfetto UI.
- Programmatically analyze the trace using PerfettoSQL.
The Perfetto SDK is a C++ library that allows you to instrument your application to record trace events. These events can then be visualized and analyzed with the Perfetto UI and Trace Processor.
Adding your first instrumentation
Setup
Checkout the latest SDK release
git clone https://github.com/google/perfetto.git -b v50.1The SDK consists of two files, sdk/perfetto.h and sdk/perfetto.cc. These are
an amalgamation of the Client API designed to easy to integrate to existing
build systems. The sources are self-contained and require only a C++17 compliant
standard library.
Copy them in your project. The next steps assume they're in the perfetto/sdk
folder. Assuming your build looks like this:
cmake_minimum_required(VERSION 3.13)
project(Example)

# Main executable
add_executable(example example.cc)
You can add the perfetto static library like this:
# It's recommended to use a recent version of CMake.
cmake_minimum_required(VERSION 3.13)

# Name of the project.
project(Example)

# Find the thread library, which is a dependency of Perfetto.
find_package(Threads)

# Add the Perfetto SDK source files to a static library.
include_directories(perfetto/sdk)
add_library(perfetto STATIC perfetto/sdk/perfetto.cc)

# Add your application's source files to an executable.
add_executable(example example.cc)

# Link the Perfetto library and the thread library to your executable.
target_link_libraries(example perfetto ${CMAKE_THREAD_LIBS_INIT})

# Windows-specific settings.
if (WIN32)
  # The Perfetto library contains many symbols, so it needs the "big object"
  # format.
  target_compile_options(perfetto PRIVATE "/bigobj")

  # Disable legacy features in windows.h.
  add_definitions(-DWIN32_LEAN_AND_MEAN -DNOMINMAX)

  # On Windows, we need to link to the WinSock2 library.
  target_link_libraries(example ws2_32)
endif (WIN32)

# Enable standards-compliant mode when using the Visual Studio compiler.
if (MSVC)
  target_compile_options(example PRIVATE "/permissive-")
endif (MSVC)
Initialize perfetto in your program and define your tracing categories:
PERFETTO_DEFINE_CATEGORIES(
perfetto::Category("rendering")
.SetDescription("Events from the graphics subsystem"),
perfetto::Category("network")
.SetDescription("Network upload and download statistics"));
PERFETTO_TRACK_EVENT_STATIC_STORAGE();
int main(int argc, char** argv) {
perfetto::TracingInitArgs args;
args.backends |= perfetto::kInProcessBackend;
perfetto::Tracing::Initialize(args);
perfetto::TrackEvent::Register();
//...
}You can now add instrumentation points to your code. They will emit events when tracing is enabled.
The TRACE_EVENT macro records a scoped event. The event starts when the macro
is called and ends at the end of the current scope (e.g., when the function
returns). This is the most common type of event and is useful for tracing the
duration of a function.
The TRACE_EVENT_BEGIN and TRACE_EVENT_END macros can be used to record
events that don't follow function scoping. TRACE_EVENT_BEGIN starts an event,
and TRACE_EVENT_END ends the most recent event started on the same thread by
default, but can be configured to work across threads and even across processes
(see the
Track Event documentation for
more details). This is useful for tracing operations that span multiple
functions.
The TRACE_COUNTER macro records the value of a counter at a specific point in
time. This is useful for tracking things like memory usage or the number of
items in a queue.
void DrawPlayer(int player_number) {
  TRACE_EVENT("rendering", "DrawPlayer", "player_number", player_number);
  // ...
}

void DrawGame() {
  TRACE_EVENT_BEGIN("rendering", "DrawGame");
  DrawPlayer(1);
  DrawPlayer(2);
  TRACE_EVENT_END("rendering");

  // ...
  TRACE_COUNTER("rendering", "Framerate", 120);
}
Collecting your first app trace
You can start collecting events with:
  // Create a trace configuration object. This is used to define the buffers,
  // data sources, and other settings for the trace.
  perfetto::TraceConfig cfg;

  // Add a buffer to the config. Traces are written to this buffer in memory.
  cfg.add_buffers()->set_size_kb(1024);  // 1 MB

  // Add a data source to the config. This specifies what kind of data to
  // collect. In this case, we're collecting track events.
  auto* ds_cfg = cfg.add_data_sources()->mutable_config();
  ds_cfg->set_name("track_event");

  // Configure the track event data source. We can specify which categories of
  // events to enable or disable.
  perfetto::protos::gen::TrackEventConfig te_cfg;
  te_cfg.add_disabled_categories("*");         // Disable all categories by default.
  te_cfg.add_enabled_categories("rendering");  // Enable our "rendering" category.
  ds_cfg->set_track_event_config_raw(te_cfg.SerializeAsString());

  // Create a new tracing session.
  std::unique_ptr<perfetto::TracingSession> tracing_session =
      perfetto::Tracing::NewTrace();

  // Set up the tracing session with the configuration.
  tracing_session->Setup(cfg);

  // Start tracing. This will block until the trace is stopped.
  tracing_session->StartBlocking();

  // The tracing_session object must be kept alive for the duration of the
  // trace.

  // ...
And you can stop and save them into a file with:
  // Stop the tracing session. This will block until all tracing data has been
  // flushed.
  tracing_session->StopBlocking();

  // Read the trace data from the session.
  std::vector<char> trace_data(tracing_session->ReadTraceBlocking());

  // Write the trace data to a file.
  std::ofstream output;
  output.open("example.pftrace", std::ios::out | std::ios::binary);
  output.write(trace_data.data(), std::streamsize(trace_data.size()));
  output.close();
Visualizing your first app trace
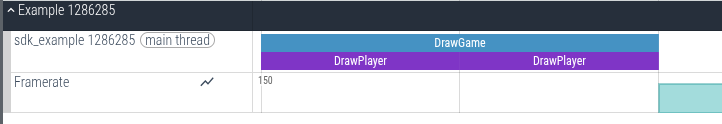
You can now open the example.pftrace file with https://ui.perfetto.dev/
It will show the events captured by the execution of your instrumentation points:
Querying your first app trace
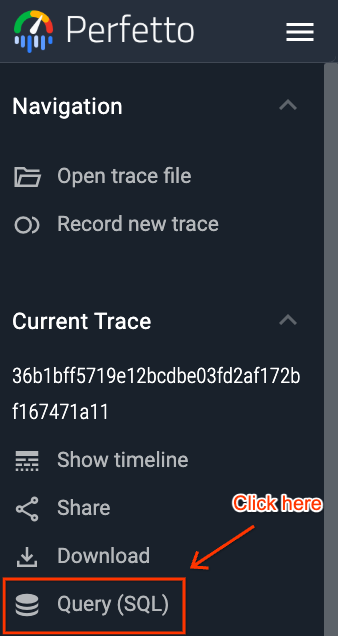
As well as visualizing traces on a timeline, Perfetto has support for querying traces using SQL. The easiest way to do this is using the query engine available directly in the UI.
In the Perfetto UI, click on the "Query (SQL)" tab in the left-hand menu.
This will open a two-part window. You can write your PerfettoSQL query in the top section and view the results in the bottom section.
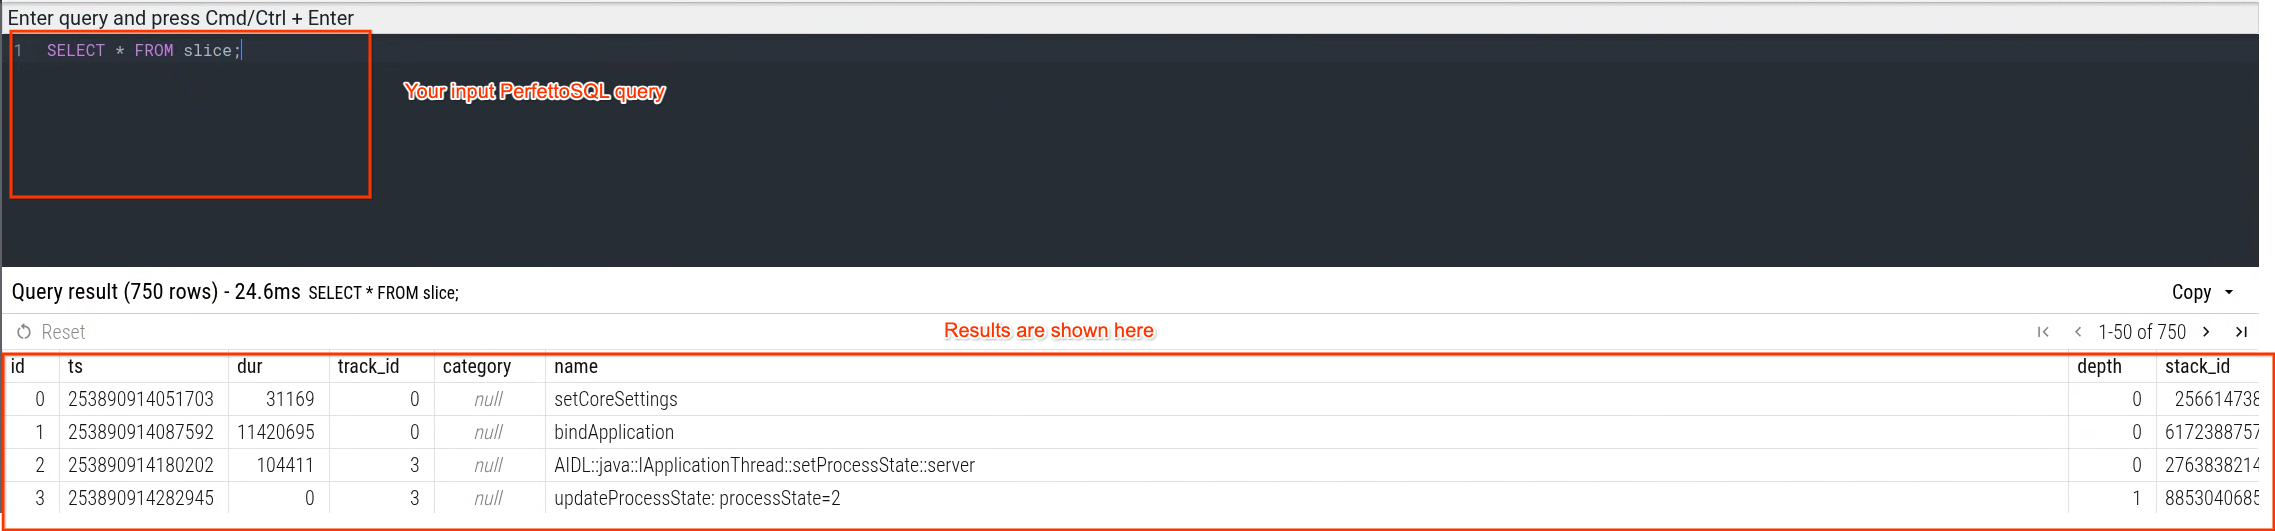
You can then execute queries Ctrl/Cmd + Enter:
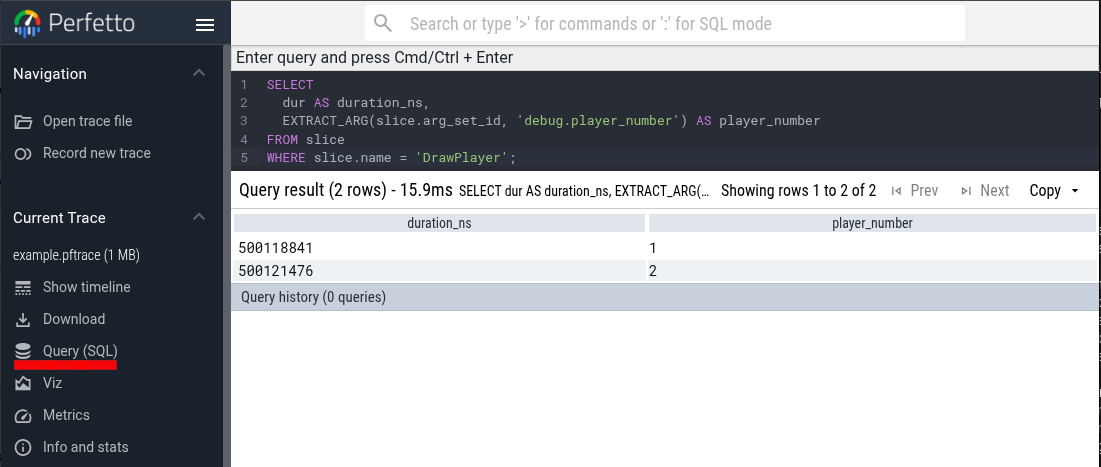
For example, by running:
SELECT
  dur AS duration_ns,
  EXTRACT_ARG(slice.arg_set_id, 'debug.player_number') AS player_number
FROM slice
WHERE slice.name = 'DrawPlayer';
you can see how many times the DrawPlayer instrumentation point has been hit,
how long each execution took and its player_number annotation.
The framerate counter is available in the counter table:
SELECT ts AS timestamp_ns, value AS frame_rate
FROM counter
JOIN track ON track.id = counter.track_id
WHERE name = 'Framerate';
Combined In-App and System Tracing
While in-app tracing is useful for understanding your application's behavior in isolation, its real power comes from combining it with a system-wide trace. This allows you to see how your app's events correlate with system events like CPU scheduling, memory usage, and I/O, providing a complete picture of your app's performance in the context of the entire system.
To enable combined tracing, you need to change your application to connect to the system-wide tracing service and then use the standard system tracing tools to record a trace.
Modify your application code:
- Change the initialization to connect to the system backend
(
kSystemBackend). This tells the Perfetto SDK to send trace events to the central system tracing service instead of collecting them within the app. - Remove all the code related to managing the tracing session
(
perfetto::Tracing::NewTrace(),tracing_session->Setup(),tracing_session->StartBlocking(), etc.). Your application now only acts as a producer of trace data, and the system tracing service will control when tracing starts and stops.
Your
mainfunction should now look like this:// Define your categories as before. PERFETTO_DEFINE_CATEGORIES( perfetto::Category("rendering") .SetDescription("Events from the graphics subsystem"), perfetto::Category("network") .SetDescription("Network upload and download statistics")); PERFETTO_TRACK_EVENT_STATIC_STORAGE(); int main(int argc, char** argv) { // Connect to the system tracing service. perfetto::TracingInitArgs args; args.backends |= perfetto::kSystemBackend; perfetto::Tracing::Initialize(args); // Register your track event data source. perfetto::TrackEvent::Register(); // Your application logic goes here. // The TRACE_EVENT macros will now write to the system trace buffer // when tracing is enabled externally. // ... }- Change the initialization to connect to the system backend
(
Record a system trace:
With your application running, you can now record a combined trace using the methods described in the Recording system traces guide.
When you configure your trace, you need to enable the
track_eventdata source in addition to any system data sources you want to collect (e.g.,linux.ftrace). This will ensure that your application's custom events are included in the trace.When you open the resulting trace file in the Perfetto UI, you will see your application's custom tracks alongside the system-level tracks.
Next steps
Now that you've recorded your first in-app trace, you can learn more about instrumenting your code:
- Tracing SDK: A deep dive into the SDK's features.
- Track Events: Learn more about the different types of track events and how to use them.