Instrumenting the Linux kernel with ftrace
In this guide, you'll learn how to:
- Instrument your kernel code using ftrace events.
- Record ftrace events using
tracebox. - Interpret ftrace events into tracks in
trace_processor. - View the raw events and the interpreted tracks in the Perfetto UI.
This guide is intended for kernel and systems developers who want to add custom instrumentation to the Linux kernel and integrate it with perfetto.
People tinkering with a local kernel and wanting simple track visualisations without touching perfetto code can skim Part C instead.
Introduction
Ftrace is a configurable tracing framework built into the Linux
kernel. It allows developers to instrument the kernel with tracepoints and
probes that can be dynamically enabled to record events at runtime (for example,
a context switch from one thread to another on a given cpu). The userspace
configures what to record, and reads the resulting traces via the tracefs
filesystem, typically mounted at /sys/kernel/tracing. The kernel comes
pre-instrumented with hundreds of tracepoints that can be used to understand
scheduling, memory, and other subsystems.
Perfetto can be configured to record a set of ftrace events as part of a perfetto trace. The system recording implementation (built into traced_probes or tracebox) configures the tracefs and converts the resulting event stream into perfetto's protobuf trace format.
The query engine and UI in turn have domain-specific parsing of ftrace events. For example raw context switch and wakeup events are turned into per-cpu and per-thread scheduling tracks in the UI, backed by queryable SQL tables.
TIP: if you simply want to visualise the execution of kernel functions, perfetto
has built-in visualisation for the function_graph tracer built into ftrace,
which does not require any additional instrumentation. See the
function graph data source page (or these
config options) for more details.
This page is split into three sections:
- Part A: covers creating an example kernel module with a static tracepoint, recording the events with perfetto, and viewing the basic event data in the perfetto UI.
- Part B (advanced): covers adding dedicated parsing for the tracepoint by modifying perfetto sources. This lets you take full advantage of turning your events into structured SQL tables and UI tracks.
- Part C: as an alternative to the above, describes a convention for structuring tracepoints so that perfetto can automatically turn them into slices/instants/counters without modifying perfetto sources.
Part A: Instrumenting the kernel and recording tracepoints
Create the kernel module source files
For this example we are going to create a kernel module called ticker which
contains a tracepoint called ticker_tick which is called every second with an
incrementing counter as the argument.
Create a new directory and copy the following file contents into the following directory structure:
.
├── Makefile
├── ticker.c
└── trace
    └── events
        └── ticker.h
The main source:
// ticker.c
MODULE_LICENSE("GPL");
MODULE_AUTHOR("Perfetto");
MODULE_DESCRIPTION("Ticker: A kernel module emitting example static tracepoint events.");
MODULE_VERSION("0.1");
static struct timer_list my_timer;
static unsigned int tick_count = 0;
static unsigned long timer_interval_ms = 1000;
static void my_timer_callback(struct timer_list *timer)
{
// Fire the tracepoint, incrementing the tick count every time.
// The function name is trace_<event_name> from the header file.
trace_ticker_tick(tick_count++);
// Re-arm the timer.
mod_timer(&my_timer, jiffies + msecs_to_jiffies(timer_interval_ms));
}
static int __init ticker_init(void)
{
pr_info("Ticker: Initializing...\n");
timer_setup(&my_timer, my_timer_callback, 0);
mod_timer(&my_timer, jiffies + msecs_to_jiffies(timer_interval_ms));
pr_info("Ticker: Timer started.\n");
pr_info("Ticker: View events under /sys/kernel/tracing/events/ticker/\n");
return 0;
}
static void __exit ticker_exit(void)
{
pr_info("Ticker: Exiting...\n");
timer_delete_sync(&my_timer);
del_timer_sync(&my_timer);
pr_info("Ticker: Timer stopped and module unloaded.\n");
}
module_init(ticker_init);
module_exit(ticker_exit);The header defining the tracepoints. Note that it is important for the header to
be under trace/events/ and not at the root of the directory. Otherwise the
kernel macros won't expand correctly:
// trace/events/ticker.h
TRACE_EVENT(ticker_tick,
TP_PROTO(unsigned int count),
TP_ARGS(count),
TP_STRUCT__entry(
__field(unsigned int, count)
),
TP_fast_assign(
__entry->count = count;
),
TP_printk("count=%u",
__entry->count
)
);
/* This part must be outside protection */
Finally, the makefile for building the module:
# Makefile
obj-m += ticker.o
ccflags-y += -I$(src)
KDIR ?= /lib/modules/$(shell uname -r)/build
PWD := $(shell pwd)
all:
$(MAKE) -C $(KDIR) M=$(PWD) modules
clean:
$(MAKE) -C $(KDIR) M=$(PWD) clean
Build and load the module
Make sure your kernel headers are installed and run make to build the kernel
module.
You can now install the kernel module with:
sudo insmod ticker.koNote: You can always uninstall the kernel module with:
sudo rmmod ticker.ko(optional) Manually verify the tracepoint
We can manually verify the tracepoint by using the tracefs file system to view
the textual representation of the event.
First, confirm that the event is present in tracefs:
ls /sys/kernel/tracing/events/ticker/ticker_tickEnable our ticker event and tracing in general:
echo 1 | sudo tee /sys/kernel/tracing/events/ticker/ticker_tick/enable
echo 1 | sudo tee /sys/kernel/tracing/tracing_on
Listen to the stream of ftrace events with:
sudo cat /sys/kernel/tracing/trace_pipeYou should see the ticker events being emitted roughly every second, with an
incrementing "count" field. The textual event representation is printed using
the TP_printk(...) part of the tracepoint definition above.
# cat /sys/kernel/tracing/trace_pipe
          <idle>-0       [011] ..s1. 850584.176058: ticker_tick: count=38
          <idle>-0       [011] ..s1. 850585.200042: ticker_tick: count=39
           <...>-2904431 [015] ..s1. 850586.224031: ticker_tick: count=40
          puppet-2904431 [015] ..s.. 850587.248080: ticker_tick: count=41
          <idle>-0       [011] ..s1. 850588.272137: ticker_tick: count=42
          <idle>-0       [011] ..s1. 850589.296040: ticker_tick: count=43
          <idle>-0       [011] ..s1. 850590.320049: ticker_tick: count=44
          <idle>-0       [011] ..s1. 850591.344048: ticker_tick: count=45
          <idle>-0       [011] ..s1. 850592.372038: ticker_tick: count=46
          <idle>-0       [011] ..s1. 850593.392033: ticker_tick: count=47
          <idle>-0       [003] ..s1. 850594.416049: ticker_tick: count=48
          <idle>-0       [011] ..s1. 850595.440054: ticker_tick: count=49
Record a perfetto trace with tracebox
In order to record our ticker events, we are going to record a system trace
using tracebox. First we need to create a recording config file that's
configured to do so:
buffers {
size_kb: 20480
fill_policy: DISCARD
}
data_sources {
config {
name: "linux.ftrace"
target_buffer: 0
ftrace_config {
ftrace_events: "ticker/ticker_tick"
}
}
}
duration_ms: 10000See the system tracing page in order to get set up with tracebox. For this example we are going to record a trace from the command line using the config file we just created:
./tracebox -c ticker.cfg --txt -o ticker.pftraceNote: tracebox will take care of enabling tracing and our ticker events (as we did manually in the preceding step).
This will write a perfetto protobuf trace to ticker.pftrace.
View the perfetto trace in the UI
We can now explore the recorded trace in the perfetto UI. Navigate to
https://ui.perfetto.dev and drag-n-drop your file into the window (or press
Ctrl+O to bring up the open file dialog).
Expand the "Ftrace Events" track group for a per-cpu view of events, which can
be selected to show their fields. Additionally, Ctrl+shift+P -> "Show Ftrace Tab" opens up a tab with an approximation of the textual output. However note
that because perfetto records the binary representation of events, it does not
textualise the events according to the TP_printk(..) specifier.
The events can also be queried with a query like:
SELECT * FROM ftrace_event JOIN args USING (arg_set_id)Part B: Integrating new tracepoints with perfetto
To add dedicated parsing for this new tracepoint in Perfetto, we need to:
- generate a protobuf description of the event, so that the serialising code (in traced_probes or tracebox) can write the events as that protobuf type, instead of a generic fallback encoding that was implicitly used above.
- add a decoder to trace_processor (the query engine) that creates the desired tracks out of the new events when parsing the protobuf trace.
As an example, we'll parse the ticker event into a global counter track.
(We'll be modifying perfetto sources so clone the repository if you have not already done so. The rest of the instructions assume that your current directory is the repository's root.)
Generate the protobuf event description in perfetto
First, copy the "format" file that describes the event in the tracefs filesystem to perfetto:
DEST=src/traced/probes/ftrace/test/data/synthetic/events/ticker/ticker_tick; \
mkdir -p $DEST && \
cp /sys/kernel/tracing/events/ticker/ticker_tick/format $DEST/format
Then add the event to the following list:
echo "ticker/ticker_tick" >> src/tools/ftrace_proto_gen/event_listThen run the generator scripts to create the protobuf description and other compile-time files for both the serialising and decoding code:
tools/run_ftrace_proto_gen
tools/gen_all out/YOUR_BUILD_DIRECTORY
This should create/modify at least the following files:
protos/perfetto/trace/ftrace/ftrace_event.proto,
protos/perfetto/trace/ftrace/ticker.proto,
src/traced/probes/ftrace/event_info.cc,
protos/perfetto/trace/perfetto_trace.proto.
This is sufficient for the serialising logic to start using the dedicated protobuf type for your events. Note: when recording, perfetto reads the event's format file in tracefs at runtime, and serialises only the fields that were known at perfetto's compile time.
Rebuild tracebox locally with your changes and re-record the trace.
Parse the event in trace_processor
Now we can add the decoding and parsing logic for the protobufs to the ftrace_parser.cc in the trace_processor.
As an example, to create a single global counter track for all events:
- add a case to the large
ParseFtraceEventswitch-case. - add a function that interns a track and attaches all of the timestamped values as counts.
Example additions (omitting the header change):
// ftrace_parser.cc

static constexpr auto kTickerCountBlueprint = tracks::CounterBlueprint(
      "ticker",
      tracks::UnknownUnitBlueprint(),
      tracks::DimensionBlueprints(),
      tracks::StaticNameBlueprint("Ticker"));

// ~~ snip ~~

      case FtraceEvent::kTickerEventFieldNumber: {
        ParseTickerEvent(cpu, ts, fld_bytes);
        break;
      }

// ~~ snip ~~

void FtraceParser::ParseTickerEvent(uint32_t cpu,
                                    int64_t timestamp,
                                    protozero::ConstBytes data) {
  protos::pbzero::TickerEventFtraceEvent::Decoder ticker_event(data);

  PERFETTO_LOG("Parsing ticker event: %" PRId64 ", %" PRIu32 ", %d",
               timestamp,
               cpu,
               static_cast<int>(ticker_event.count()));

  // Push the global counter.
  TrackId track = context_->track_tracker->InternTrack(kTickerCountBlueprint);
  context_->event_tracker->PushCounter(
      timestamp, static_cast<double>(ticker_event.count()), track);
}
After rebuilding the trace_processor (or the whole UI), the data can be
queried from the counter table:
SELECT *
FROM counter
JOIN counter_track ct ON ct.id = counter.track_id
WHERE ct.type = 'ticker'
Visualise the track in the UI
In order to actually see this track in the UI it needs to be added by some UI
code (organised in perfetto as plugins). We'll use the simplest option,
dev.perfetto.TraceProcessorTrack. Make the following edit to add all counter
tracks of type "ticker" to the SYSTEM top level group:
// ui/src/plugins/dev.perfetto.TraceProcessorTrack/counter_tracks.ts
~~ snip ~~
  {
    type: 'ticker',
    topLevelGroup: 'SYSTEM',
    group: undefined,
  },
~~ snip ~~
Rebuild a local UI (ui/run-dev-server). Open the re-recorded trace (with the
tracebox that had compile-time knowledge of the event). You should now see a
dedicated UI track with your event's data.
This is the most complete way of adding ftrace events to the perfetto stack. There are quite a few steps and a need for upstreaming your changes, but this gives you full power to do arbitrary parsing in the trace_processor code, and makes the results available to all users of perfetto.
Part C: Simple slice/counter visualisations without modifying perfetto code (kernel track events)
There is a simpler way for perfetto to automatically create basic slice & counter tracks from events, that is more suitable for people tinkering with a local kernel or writing a module that won't be upstreamed to the mainline kernel. This lets you focus on instrumenting your code instead of changing perfetto itself.
Consider the case of slices, usually derived from a pair of events - one signifying the start of the slice, and the other ending it. There needs to be a convention for perfetto to know that a given tracepoint is to be interpreted this way.
What perfetto does is look for specifically-named tracepoint fields
(TP_STRUCT__entry(..) part of the definition). If your tracepoint matches this
convention, trace_processor and the UI will automatically try to group the
events on tracks. With grouping (scoping) controlled by further conventions.
The following sections give an example tracepoint template for a few common cases, and their expected visualisation:
- slice tracks for synchronous code, where the operations are ended on the same thread that they're started, for example before and after a loop in a single function.
- process-scoped slice tracks for events that are best visualised when grouped at the process level.
- cpu-scoped counter tracks for events that represent per-cpu counters.
NOTE: The full reference with details on scoping and track naming options is at "Kernel track events: format and conventions".
Thread-scoped slice tracks
The simplest case if you want to visualise the duration of (potentially nested) regions of code where the beginning and the end happen on the same thread.
Perfetto can be hinted that your tracepoint should be parsed into thread-scoped
slice tracks simply by having two fields with "well known" names and types in
the layout of the tracepoint (TP_STRUCT__entry(...):
char track_event_type__string slice_name
Perfetto will interpret the events as slices or instants based on the value of
track_event_type in the actual timestamped event:
'B'opens a named slice (fromslice_name) on the active thread.'E'ends the last opened slice on the thread (slice_nameis ignored).'I'sets an instant (zero duration) event with the name taken fromslice_name.
The thread id and timestamp are implicitly part of every ftrace event already, and do not need to be specified.
Tracepoint declaration example, named trk_example/tid_track_example:
Note: on kernels older than v6.10, __assign_str requires two arguments, see this patch.
// trace/events/trk_example.h
TRACE_EVENT(tid_track_example,
TP_PROTO(
char track_event_type,
const char *slice_name
),
TP_ARGS(track_event_type, slice_name),
TP_STRUCT__entry(
__field(char, track_event_type)
__string(slice_name, slice_name)
),
TP_fast_assign(
__entry->track_event_type = track_event_type;
/* kernels before v6.10: __assign_str(slice_name, slice_name) */
__assign_str(slice_name);
),
TP_printk(
"type=%c slice_name=%s",
__entry->track_event_type,
__get_str(slice_name)
)
);
/* This part must be outside protection */
Note that only the types and names of TP_STRUCT__entry matter, there are no
constraints on extra fields, the printk specifier, or even field order.
For convenience, the tracepoint invocations can be wrapped with macros:
// Convenience macros
Example of instrumented code, demonstrating nested slices and instants:
TRACE_EX_BEGIN("outer");
udelay(500);
for (int i=0; i < 3; i++) {
    TRACE_EX_BEGIN("nested");
    udelay(1000);
    TRACE_EX_INSTANT("instant");
    TRACE_EX_END();
}
TRACE_EX_END();
We can record a trace with the following config (at the time of writing, the
denser_generic_event_encoding is necessary, but is likely to become the
default):
// trace.txtpb
duration_ms: 10000
buffers: {
size_kb: 40960
fill_policy: DISCARD
}
data_sources: {
config: {
name: "linux.ftrace"
ftrace_config: {
denser_generic_event_encoding: true
ftrace_events: "trk_example/*"
}
}
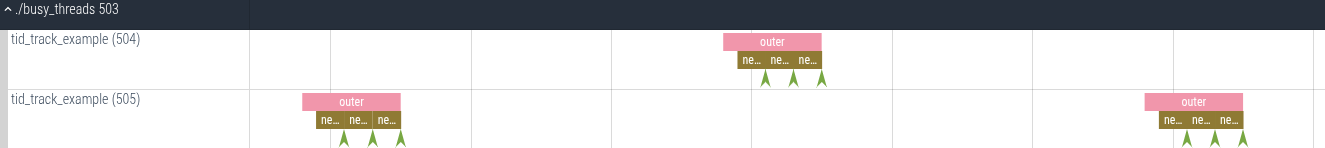
}Resulting tracks automatically derived by perfetto trace_processor and UI. Note that each thread gets its own separate track, and the tracks are automatically nested under the process track group:
Process-scoped slice tracks
Similar to the preceding example, but with slice events grouped at the process level. Note: this allows terminating slices from a different thread than which started the operation, but the grouped slices must have strict nesting - all slices must terminate before their parents (see the concept of async slices for more details).
The expected fields in TP_STRUCT__entry for this type of parsing:
char track_event_type__string slice_nameint scope_tgid
The first two fields are interpreted as in the preceding example, while the
scope_tgid has to be populated with the process id (aka TGID) under which that
particular event should be grouped. The process id should be real (don't
hardcode arbitrary constants), but the emitting thread does not have to be in
that process.
Tracepoint declaration example, named trk_example/tgid_track_example:
// trace/events/trk_example.h
TRACE_EVENT(tgid_counter_example,
TP_PROTO(
u64 counter_value,
int scope_tgid
),
TP_ARGS(counter_value, scope_tgid),
TP_STRUCT__entry(
__field(u64, counter_value)
__field(int, scope_tgid)
),
TP_fast_assign(
__entry->counter_value = counter_value;
__entry->scope_tgid = scope_tgid;
),
TP_printk(
"counter_value=%llu tgid=%d",
(unsigned long long)__entry->counter_value,
__entry->scope_tgid
)
);
/* This part must be outside protection */
Example convenience macros, using the current process context (current->tgid)
for grouping events:
// Convenience macros
Example of instrumented code, as before:
TRACE_EX_BEGIN("outer");
udelay(500);
for (int i=0; i < 3; i++) {
    TRACE_EX_BEGIN("nested");
    udelay(1000);
    TRACE_EX_INSTANT("instant");
    TRACE_EX_END();
}
TRACE_EX_END();
Resulting visualisation, when recorded using the config from the preceding example. All slice stacks are aggregated at the process level:

CPU-scoped counter tracks
Similarly to slices and instants, there is a convention for tracepoints to be automatically presented as tracks in perfetto. The counters can also be grouped by thread/process, but this example demonstrates per-cpu grouping.
The expected fields in TP_STRUCT__entry for this type of parsing:
u64 counter_value(any intergral type is accepted)int scope_cpu
Tracepoint declaration example, named trk_example/cpu_counter_example:
// trace/events/trk_example.h
TRACE_EVENT(cpu_counter_example,
TP_PROTO(
u64 counter_value,
int scope_cpu
),
TP_ARGS(counter_value, scope_cpu),
TP_STRUCT__entry(
__field(u64, counter_value)
__field(int, scope_cpu)
),
TP_fast_assign(
__entry->counter_value = counter_value;
__entry->scope_cpu = scope_cpu;
),
TP_printk(
"counter_value=%llu cpu=%d",
(unsigned long long)__entry->counter_value,
__entry->scope_cpu
)
);
/* This part must be outside protection */
Example of instrumented code:
static unsigned int n = 0
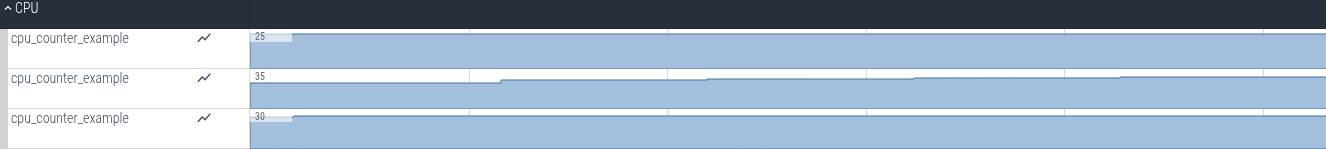
trace_cpu_counter_example(n++, smp_processor_id());Resulting visualisation, when recorded using the config from the preceding
examples. With counter increments being attributed to the cpu that executed the
tracepoint (due to the use of smp_processor_id() as the cpu index, but we
could've equally used a static index if that made more sense for the tracepoint
in question):