
Recording performance counters and CPU profiling with Perfetto
In this guide, you'll learn how to:
- Record CPU profiles and performance counters with Perfetto.
- Collect callstack profiles to identify performance bottlenecks.
- Visualize and analyze CPU profiles in the Perfetto UI.
On linux and android, perfetto can record per-cpu
perf counters, for example hardware events
such as executed instructions or cache misses. Additionally, perfetto can be
configured to sample callstacks of running processes based on these performance
counters. Both modes are analogous to the perf record command from the perf
tool, and use the same system call (perf_event_open).
If you're only interested in the profiling (i.e. flamegraphs), skip to "Collecting a callstack profile".
Collecting a trace with perf counters
The recording is defined using the usual perfetto config protobuf, and can be freely combined with other data sources such as ftrace. This allows for hybrid traces with a single timeline showing both the sampled counter values as well as other traced data, e.g. process scheduling.
The data source configuration (PerfEventConfig) defines the following:
- Timebase (or group leader): The primary event being counted. This event is counted separately on each CPU.
- Sampling period/frequency: How often the counter is sampled. This can be a
fixed
period(e.g., every 1000 events) or afrequency(e.g., 100 times per second). - Followers: Any additional counters to record. These counters are snapshotted at the same time as the timebase event.
One tracing configuration can define multiple "linux.perf" data sources for separate sampling groups. But note that you need to be careful not to exceed the PMU capacity of the platform if counting hardware events. Otherwise the kernel will multiplex (repeatedly switch in and out) the event groups, leading to undercounting (see this perfwiki page for more info).
Example config
This config defines one group of three counters per CPU. A timer event
(SW_CPU_CLOCK) is used as the leader, providing a steady rate of samples. Each
sample additionally includes the counts of cpu cycles (HW_CPU_CYCLES) and
executed instructions (HW_INSTRUCTIONS) since the beginning of tracing.
duration_ms: 10000

buffers: {
  size_kb: 40960
  fill_policy: DISCARD
}

# sample per-cpu counts of instructions and cycles
data_sources {
  config {
    name: "linux.perf"
    perf_event_config {
      timebase {
        frequency: 1000
        counter: SW_CPU_CLOCK
        timestamp_clock: PERF_CLOCK_MONOTONIC
      }
      followers { counter: HW_CPU_CYCLES }
      followers { counter: HW_INSTRUCTIONS }
    }
  }
}

# include scheduling data via ftrace
data_sources: {
  config: {
    name: "linux.ftrace"
    ftrace_config: {
      ftrace_events: "sched/sched_switch"
      ftrace_events: "sched/sched_waking"
    }
  }
}

# include process names and grouping via procfs
data_sources: {
  config: {
    name: "linux.process_stats"
    process_stats_config {
      scan_all_processes_on_start: true
    }
  }
}
Which should look similar to the following in the UI, after expanding the "Perf Counters" track groups. The counter tracks show the values as counting rates by default.
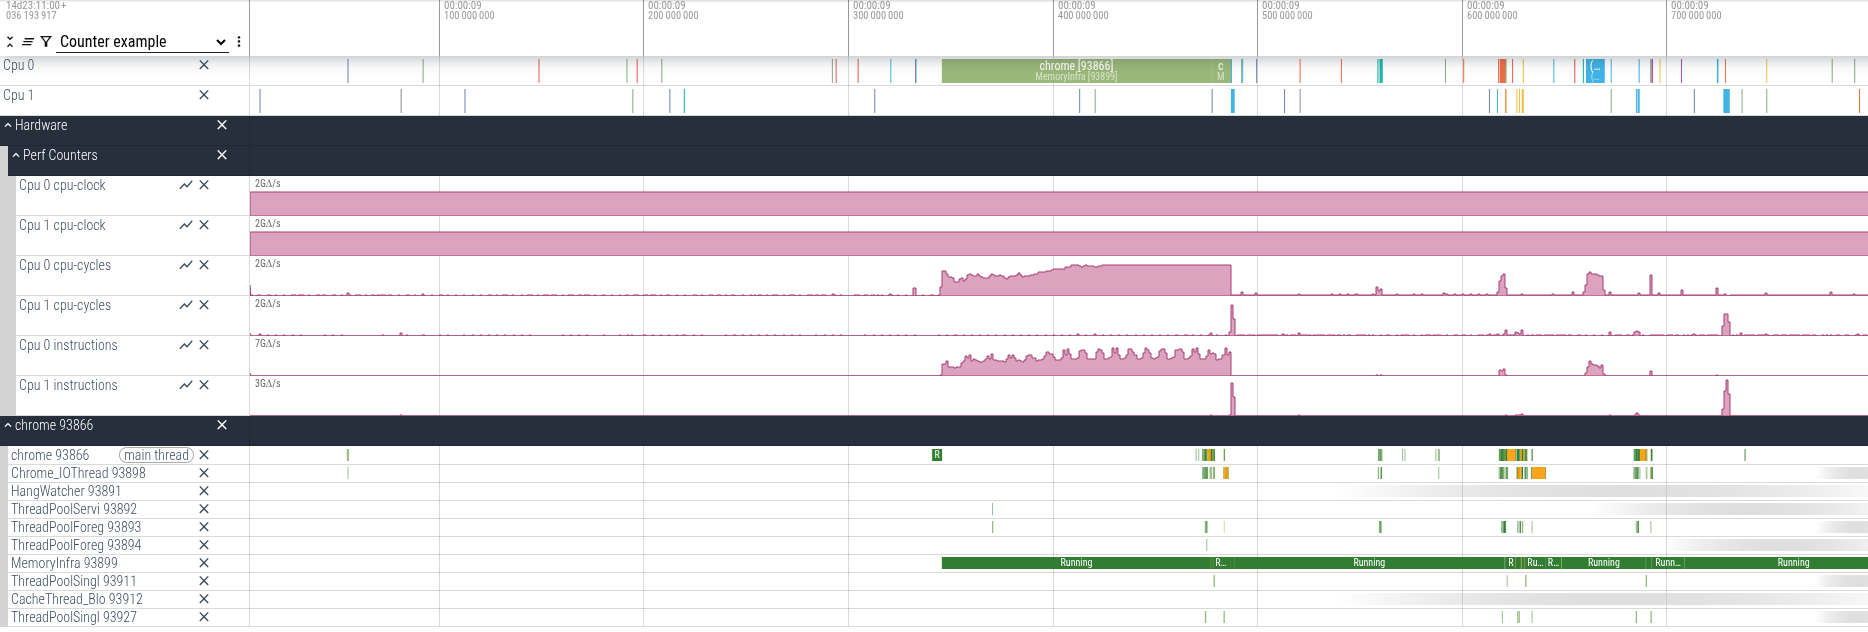
The counter data can be queried as follows:
select ts, cpu, name, value
from counter c join perf_counter_track pct on (c.track_id = pct.id)
order by 1, 2 asc
Recording instructions
Prerequisites:
- ADB installed on the host machine.
- A device running Android 15+, connected to the host machine using USB with ADB authorised.
Download the tools/record_android_trace python script from the perfetto repo.
The script automates pushing the config to the device, invoking perfetto,
pulling the written trace from the device, and opening it in the UI.
curl -LO https://raw.githubusercontent.com/google/perfetto/main/tools/record_android_traceAssuming the example config above is saved as /tmp/config.txtpb, start the
recording:
python3 record_android_trace -c /tmp/config.txtpb -o /tmp/trace.pbThe recording will stop after 10 seconds (as set by duration_ms in the config), and can be stopped early by pressing ctrl-c. After stopping, the script should auto-open the perfetto UI with the trace.
Download (or build from sources) the tracebox binary, which packages together
the recording implementation of most perfetto data sources.
curl -LO https://get.perfetto.dev/tracebox
chmod +x tracebox
Change the Linux permissions for ftrace and perf event recording. The following may be sufficient depending on your particular distribution:
sudo chown -R $USER /sys/kernel/tracing
echo -1 | sudo tee /proc/sys/kernel/perf_event_paranoidAlternatively, run tracebox as root (using sudo) in the subsequent step.
Assuming the example config above is saved as /tmp/config.txtpb, start the
recording.
./tracebox -c /tmp/config.txtpb --txt -o /tmp/trace.pbOpen the /tmp/trace.pb file in the Perfetto UI.
Collecting a callstack profile
The counter recording can also be configured to include a callstack (list of function frames that called each other) of the process that was interrupted at the time of the counter sampling. This is achieved by asking the kernel to record additional state (userspace register state, top of the stack memory) in each sample, and unwinding + symbolising the callstack in the profiler. The unwinding happens outside of the process, without any need for instrumentation or injected libraries in the processes being profiled.
To enable callstack profiling, set the
callstack_sampling
field in the data source config. Note that the sampling will still be performed
per-cpu, but you can set the
scope
field to have the profiler unwind callstacks only for matching processes (which
in turn can help prevent the profiler from being overloaded by unwinding runtime
costs).
Example config
The following is an example of a config for periodic sampling based on time (i.e. a per-cpu timer leader), unwinding callstacks only if they happen when a process with the given name is running.
By changing the timebase, you can instead capture callstacks on other events,
for example you could see the callstacks of when the process wakes other threads
up by setting "sched/sched_waking" as a tracepoint timebase.
Android note: the example uses "com.android.settings" as an example, but for successful callstack sampling the app has to be declared as either profileable or debuggable in the manifest (or you must be on a debuggable build of the android OS).
duration_ms: 10000

buffers: {
  size_kb: 40960
  fill_policy: DISCARD
}

# periodic sampling per cpu, unwinding callstacks if
# "com.android.settings" is running.
data_sources {
  config {
    name: "linux.perf"
    perf_event_config {
      timebase {
        counter: SW_CPU_CLOCK
        frequency: 100
        timestamp_clock: PERF_CLOCK_MONOTONIC
      }
      callstack_sampling {
        scope {
          target_cmdline: "com.android.settings"
        }
        kernel_frames: true
      }
    }
  }
}

# include scheduling data via ftrace
data_sources: {
  config: {
    name: "linux.ftrace"
    ftrace_config: {
      ftrace_events: "sched/sched_switch"
      ftrace_events: "sched/sched_waking"
    }
  }
}

# include process names and grouping via procfs
data_sources: {
  config: {
    name: "linux.process_stats"
    process_stats_config {
      scan_all_processes_on_start: true
    }
  }
}
Recording instructions
Prerequisites:
- ADB installed on the host machine.
- A device running Android 15+, connected to the host machine using USB with ADB authorised.
- A Profileable or Debuggable app. If you are running on a "user" build of Android (as opposed to "userdebug" or "eng"), your app needs to be marked as profileable or debuggable in its manifest.
For android, the tools/cpu_profile helper python script simplifies
construction of the trace config, and has additional options for
post-symbolisation of the profile (in case of libraries without symbol info)
and conversion to the pprof format that is
better suited for pure flamegraph visualisations. It can be downloaded as
follows:
curl -LO https://raw.githubusercontent.com/google/perfetto/main/tools/cpu_profileStart the recording using periodic sampling based on time (i.e. a per-cpu timer leader), unwinding callstacks only if they happen when a process with the given name is running. Note that non-native callstacks can be expensive to unwind, so we recommend keeping the sampling frequency below 200 Hz per cpu.
python3 cpu_profile -n com.android.example -f 100The recording can be stopped by pressing ctrl-c. The script will then print a
path under /tmp/ where it placed the outputs, the raw-trace file in that
directory can be opened in the Perfetto UI, while
the profile.*.pb are the per-process aggregate profiles in the "pprof" file
format.
See cpu_profile --help for more flags, notably -c lets you supply your own
textproto config, while taking advantage of the scripted recording and
output conversion.
Missing symbols and deobfuscation
If your profiles are missing native libraries' function names, but you have
access to the debug version of the libraries (with symbol data), you can
symbolise the profile on the host by following the
symbolization and deobfuscation guide.
traceconv bundle is the recommended entry point.
Download (or build from sources) the tracebox binary, which packages together
the recording implementation of most perfetto data sources.
curl -LO https://get.perfetto.dev/tracebox
chmod +x tracebox
Change the Linux permissions for ftrace and perf event recording. The following may or may not be enough depending on your particular distribution (note the added kptr_restrict override if you want to see kernel function names).
sudo chown -R $USER /sys/kernel/tracing
echo -1 | sudo tee /proc/sys/kernel/perf_event_paranoid
echo 0 | sudo tee /proc/sys/kernel/kptr_restrictAlternatively, run tracebox as root (using sudo) in the subsequent step.
Assuming the example config above is saved as /tmp/config.txtpb (with the
target_cmdline option changed to a process on your machine), start the
recording.
./tracebox -c /tmp/config.txtpb --txt -o /tmp/trace.pbOnce the recording stops, open the /tmp/trace.pb file in the Perfetto
UI.
To convert the trace into per-process profiles in the "pprof" format, you can
use the traceconv script as follows:
python3 traceconv profile --perf /tmp/trace.pbMissing symbols and deobfuscation
If your profiles are missing native libraries' function names, but you have
access to the debug version of the libraries (with symbol data), you can
symbolise the profile after the fact by following the
symbolization and deobfuscation guide.
traceconv bundle is the recommended entry point.
Visualising the profiles in the Perfetto UI
In the UI, the callstack samples will be shown as instant events on the timeline, within the process track group of the sampled process. There is a track per sampled thread, as well as a single track combining all samples from that process. By selecting time regions with perf samples, the bottom pane will show dynamic flamegraph views of the selected callstacks.
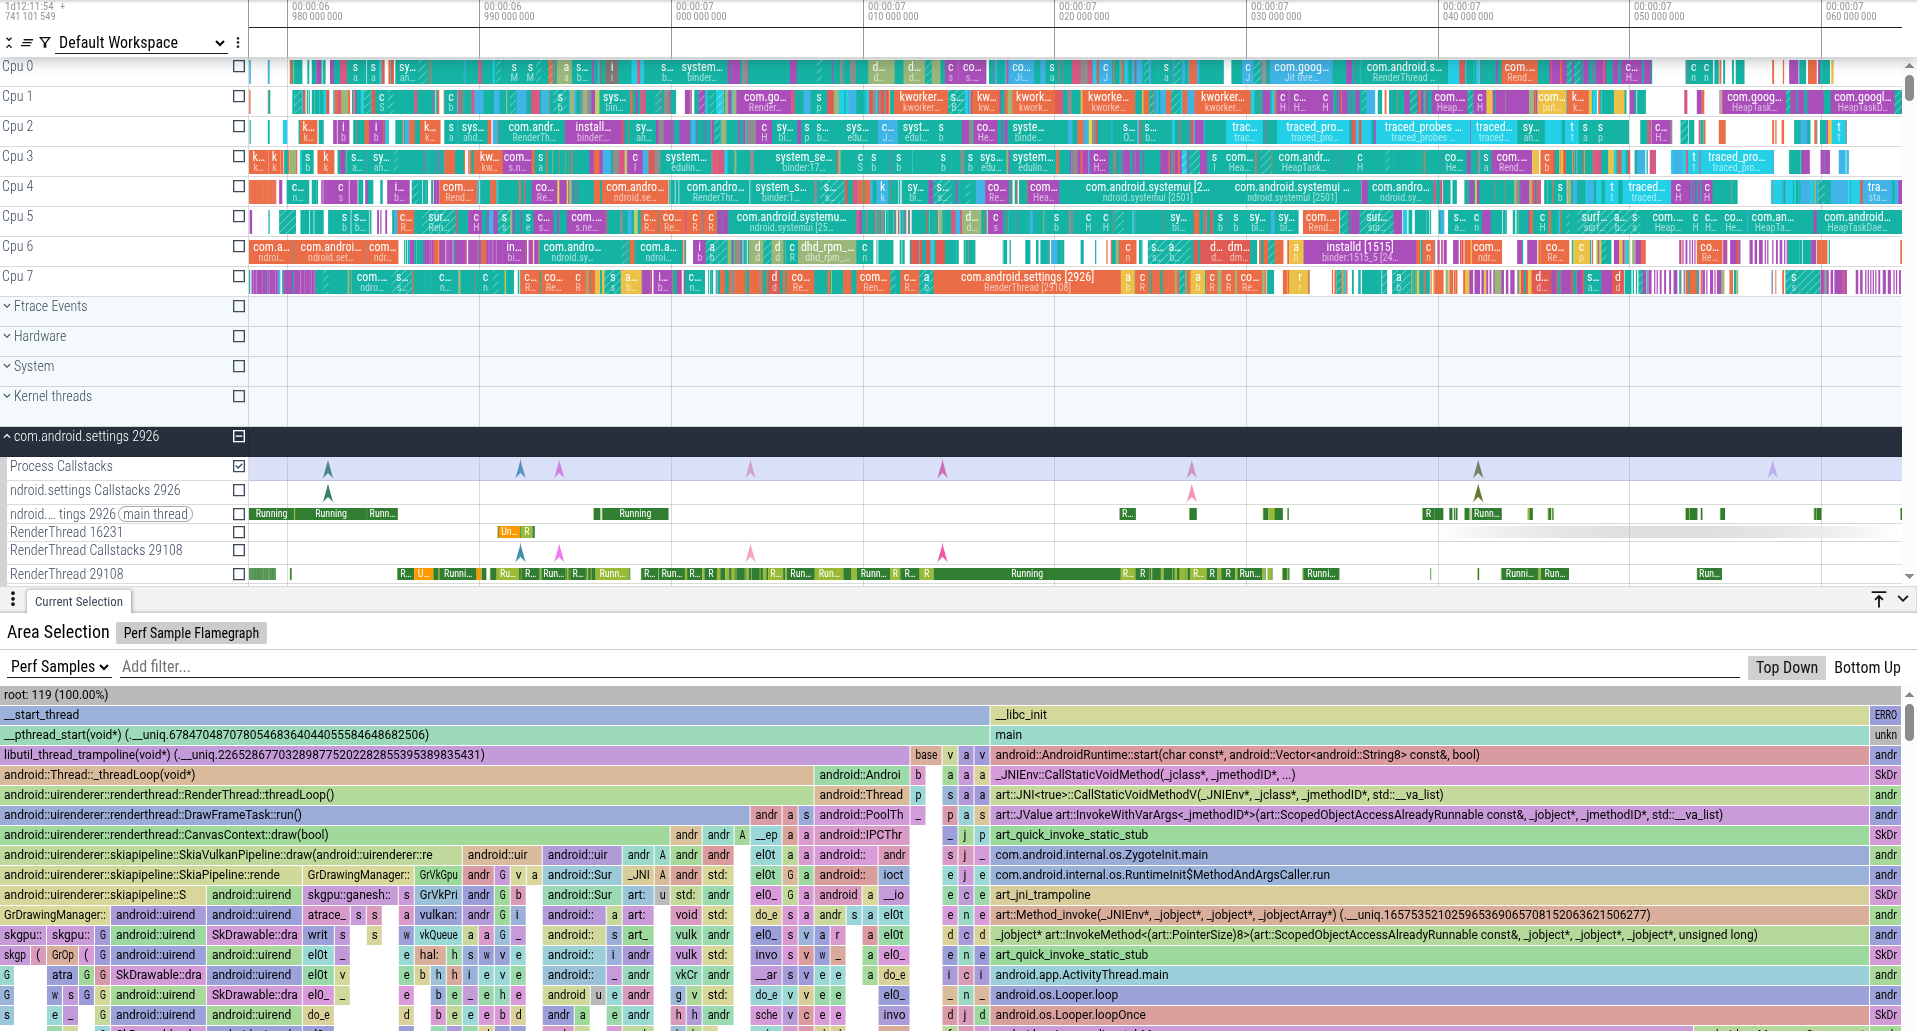
The sample data can also be queried from the
perf_sample table via SQL.
Querying traces
As well as visualizing traces on a timeline, Perfetto has support for querying traces using SQL. The easiest way to do this is using the query engine available directly in the UI.
In the Perfetto UI, click on the "Query (SQL)" tab in the left-hand menu.
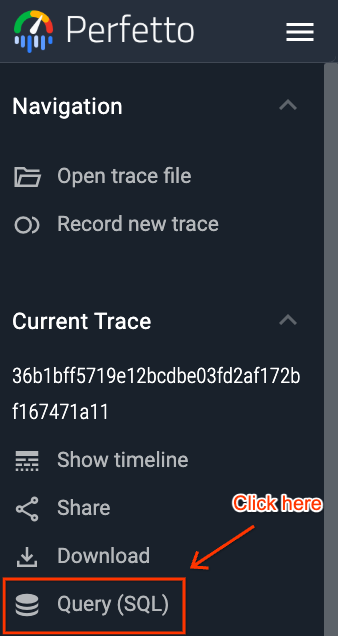
This will open a two-part window. You can write your PerfettoSQL query in the top section and view the results in the bottom section.
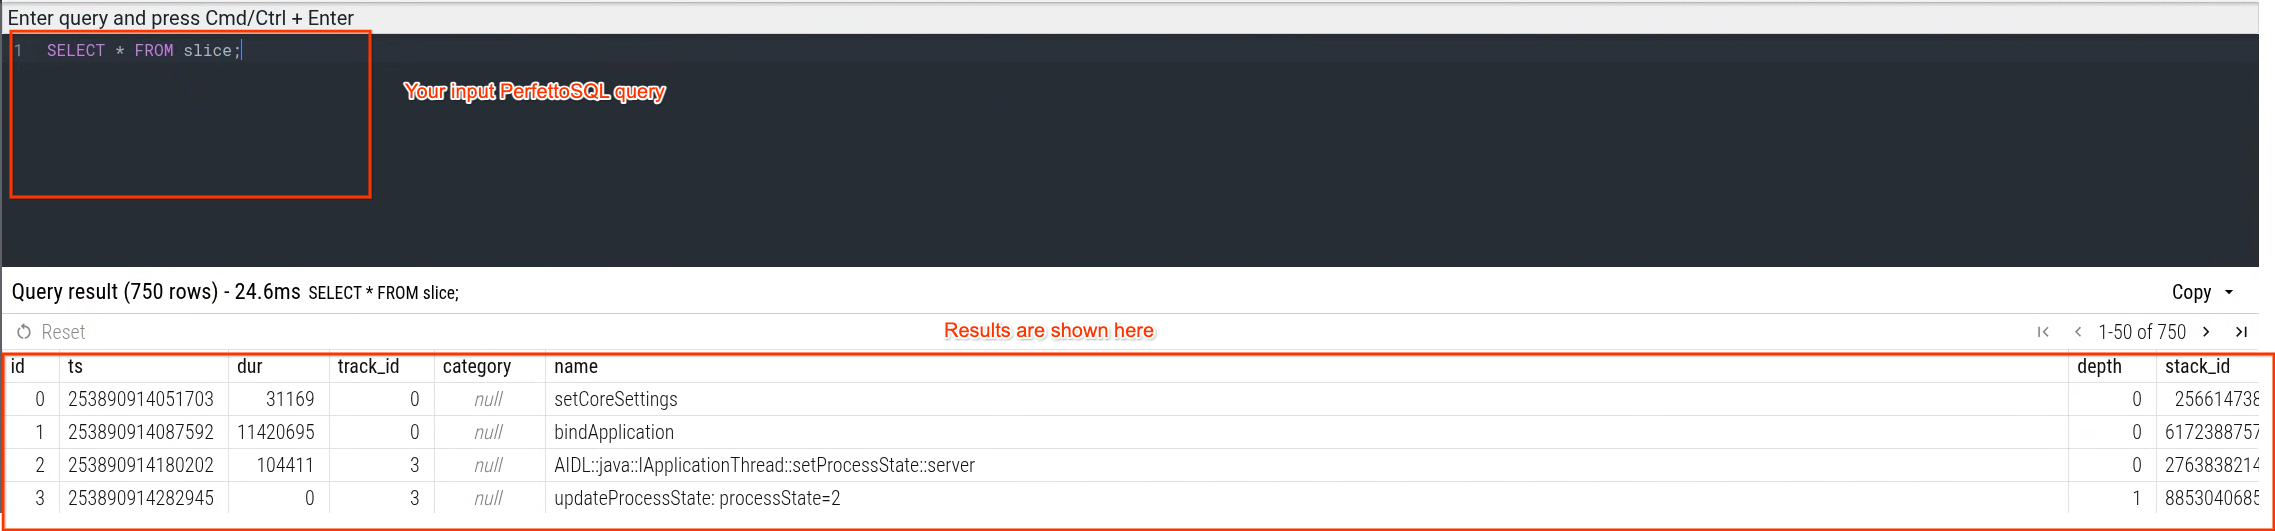
You can then execute queries Ctrl/Cmd + Enter:
For example, by running:
INCLUDE PERFETTO MODULE linux.perf.samples;

SELECT
  -- The id of the callstack. A callstack in this context
  -- is a unique set of frames up to the root.
  id,
  -- The id of the parent callstack for this callstack.
  parent_id,
  -- The function name of the frame for this callstack.
  name,
  -- The name of the mapping containing the frame. This
  -- can be a native binary, library, JAR or APK.
  mapping_name,
  -- The name of the file containing the function.
  source_file,
  -- The line number in the file the function is located at.
  line_number,
  -- The number of samples with this function as the leaf
  -- frame.
  self_count,
  -- The number of samples with this function appearing
  -- anywhere on the callstack.
  cumulative_count
FROM linux_perf_samples_summary_tree;
you can see the summary tree of all the callstacks captured in the trace.
Alternatives
The perfetto profiling implementation is built for continuous (streaming)
collection, and is therefore less optimised for short, high-frequency profiling.
If all you need are aggregated flamegraphs, consider simpleperf on Android and
perf on Linux. These tools are more mature and have a simpler user interface
for this use case.
Next steps
Now that you've recorded your first CPU profile, you can explore more advanced topics:
More about trace analysis
- Perfetto UI: Learn about all the features of the trace viewer.
- Trace Analysis with SQL: Learn how to analyze traces using the Trace Processor and PerfettoSQL.
Combining with other data sources
You can also include other data sources on the same timeline as CPU sampling to get a more complete picture of your system's performance.
- Scheduling events: Get detailed information about which threads are running on which CPUs.
- CPU Frequency: See how the CPU frequency changes over time.
- System Calls: Trace the entry and exit of system calls.