
Visualizing external trace formats with Perfetto
In this guide, you'll learn about:
- The different external trace formats that Perfetto supports.
- How to generate and visualize these formats in the Perfetto UI.
- The limitations of each format and when to use them.
Perfetto is capable of opening and analyzing trace files generated by a variety of external tools and systems, not just its own native protobuf format. You might have existing traces in these formats if:
- You're already using other tracing tools and have accumulated data.
- Perfetto's recording capabilities aren't the primary fit for your data collection needs, but you wish to use its analysis tools.
- You have custom timestamped data which you can convert this into one of the
external formats Perfetto understands (detailed below).
- Alternatively, you might consider converting your data directly into Perfetto's native TrackEvent protobuf format, which can offer more power and flexibility.
The main advantages of using Perfetto to examine these external traces are its powerful analysis and visualization capabilities:
- The Perfetto UI: A versatile, web-based trace viewer designed to handle large and complex timeline data, offering rich interactive analysis.
- Trace Processor: A powerful SQL-based engine that allows for programmatic querying and in-depth analysis of timestamped data from these diverse formats.
Below, we detail the supported formats, provide context on their typical use cases, and outline what to expect when loading them into Perfetto.
Chrome JSON format
Description: The Chrome JSON trace format consists of a JSON array of event
objects. Each object represents a single trace event and typically includes
fields like pid (process ID), tid (thread ID), ts (timestamp in
microseconds), ph (phase, indicating event type like begin, end, instant,
counter, etc.), name (event name), cat (category), and args
(event-specific arguments). This format was originally developed for Chrome's
about:tracing (now chrome://tracing) tool.
Common Scenarios: While Chromium browser developers now primarily use Perfetto's native protobuf format for trace collection, the Chrome JSON format is still encountered in several situations:
- Third-party Tools & Libraries: Due to its longevity and relatively simple structure, many external tools, custom C++ instrumentation libraries, and libraries in other languages (e.g., Node.js, Python, Java) adopted the Chrome JSON format for emitting trace data. It's often chosen for its ease of generation and established "stability" as a known format.
- Export from Chrome DevTools: The "Performance" panel in modern Chrome DevTools can still export profiles in this JSON format.
- Legacy Traces: You might have older traces from Chrome that are in this format.
Perfetto Support:
- Perfetto UI: Chrome JSON files can be opened directly in the Perfetto UI.
The UI visualizes common event types, including:
B(begin) andE(end) events as slices.X(complete) events as slices.I(instant) events as single points on the timeline.C(counter) events as counter tracks.M(metadata) events for process and thread names, etc.s,t,f(flow) events as connecting arrows between slices.
- Trace Processor: These events are parsed into Perfetto's standard SQL
tables (e.g.,
slice,track,process,thread,counter,args). This allows you to analyze Chrome JSON traces using SQL queries. - Important Notes:
- Perfetto aims to adhere to the
Trace Event Format specification.
It does not attempt to replicate specific rendering quirks or undocumented
behaviors of the legacy
chrome://tracingtool unless they are critical for basic trace understanding. - Perfetto's data model requires duration events (
B/Epairs andXevents) to nest, as mandated by the spec. Overlapping, non-nested events are out of spec and inherently ambiguous; Perfetto keeps them visible by laying them out on a separate overflow track, but the result might not match what you intended. For details and the recommended fix (async events), see issue #4280. - Support for some less common or highly specific features of the JSON format might be limited. Refer to the FAQ on obscure JSON features.
- Perfetto aims to adhere to the
Trace Event Format specification.
It does not attempt to replicate specific rendering quirks or undocumented
behaviors of the legacy
How to Generate:
- Programmatically by External Tools & Libraries: This is the most common way this format is generated today. Due to its established nature and simple structure, various libraries and tools across different languages (e.g., for Node.js, Python, Java, C++) can produce trace files in the Chrome JSON format.
- Export from Chrome DevTools: The "Performance" panel in Chromium-based browsers allows you to record activity and then use the "Save profile..." (download) option to get a JSON file.
- Historically from
chrome://tracing: Older versions of Chrome used this interface for saving traces.
External Resources:
- Format Specification: Trace Event Format (Google Docs)
- Original
about:tracingtool context: The Trace Event Profiling Tool (Chromium Docs)
Firefox Profiler JSON format
Description: The Firefox Profiler JSON format is primarily known for its use by the Firefox Profiler, a web-based tool for performance analysis. The format can describe sampled CPU call stacks as well as "markers" — timeline events similar to slices and instants — and Perfetto imports both.
Common Scenarios: The most common reason Perfetto users encounter this format is for:
- Visualizing Linux
perf(or Androidsimpleperf) CPU profiles: Developers often collect CPU samples usingperf recordon Linux orsimpleperfon Android. These native profiles can then be converted into the Firefox Profiler JSON format to leverage the interactive and user-friendly visualizations offered by tools likeprofiler.firefox.comor, as relevant here, for import into Perfetto. - Using cross-platform profiling tools: Several tools emit Firefox
Profiler JSON natively, including:
- samply, a sampling CPU profiler
for Linux, macOS, and Windows that records native binaries and can save the
profile as a JSON file with
samply record --save-only -o profile.json. - The Python standard library's
profiling.samplingmodule (added in Python 3.15), which has a--geckoflag that writes Firefox Profiler JSON.
- samply, a sampling CPU profiler
for Linux, macOS, and Windows that records native binaries and can save the
profile as a JSON file with
- Analyzing profiles from Firefox: Profiles captured directly within the Firefox browser typically include both CPU samples and rich marker data (DOM events, IPC, GC, etc.); Perfetto can ingest both.
Perfetto Support:
- CPU samples: Call stacks, sample timestamps, and thread/process
information are imported into the standard
cpu_profile_stack_sample,stack_profile_callsite,stack_profile_frame, andstack_profile_mappingtables, enabling flamegraph visualization in the Perfetto UI. - Markers: Each Firefox marker becomes a Perfetto slice. The track layout
mirrors the Firefox Profiler's marker chart: one track per
(thread, marker name)so e.g. everyAwakemarker appears on the thread'sAwaketrack, everyBINARY_OPopcode marker on the thread'sBINARY_OPtrack, and so on.Instantmarkers (phase 0) become zero-duration slices.Intervalmarkers (phase 1) become slices withdur = endTime - startTime.IntervalStart/IntervalEndpairs (phases 2 and 3) are matched LIFO by name on the same thread and produce a single slice spanning their times.- Two same-name markers partially overlapping on a thread is not
supported: the format has no per-marker ID, so the importer cannot
disambiguate them. The second slice is dropped and counted in the
slice_drop_overlapping_complete_eventstat. Strictly nested same-name markers are kept and rendered at successive depths. - The marker name and resolved
meta.categories[i].namepopulate the slicenameandcategorycolumns. - The marker
datapayload is flattened into args under thedata.prefix. For example, aDOMEventmarker with{"type":"DOMEvent","eventType":"mousedown","latency":2.96}produces argsdata.type,data.eventType, anddata.latency. Nested objects are flattened recursively (data.cause.tid, etc.).
- Supported Format Variants: Perfetto supports two variants of the Firefox
Profiler JSON format:
- Legacy format: Uses
stringTableand tables withschema+dataarrays (e.g.,frameTable.schemaandframeTable.data). This is the format historically generated by tools likeperf script report gecko. Markers are not present in this variant. - Preprocessed format: Uses
stringArrayand tables with separate column arrays (e.g.,frameTable.func,funcTable.name). This is the format used by Firefox Profiler's preprocessed output and indicated by themeta.preprocessedProfileVersionfield. Markers, if present, are imported. - The newer top-level
sharedblock (used by recent Firefox builds to deduplicate strings, frames, and stacks across threads) is also handled.
- Legacy format: Uses
- Limitations:
- Marker
markerSchemadefinitions and other UI hints (custom track colors, chart/tooltip label templates) are not used. - Profile-level metadata such as
pages,counters, andprofilerOverheadis not imported.
- Marker
How to Generate: A few common paths produce Firefox Profiler JSON that
Perfetto can ingest — converting native CPU profiles from Linux perf or
Android simpleperf, recording with samply, or sampling Python with the
standard library's profiling.sampling module.
Record a profile with
perf record: Capture CPU samples for a specific command/process or system-wide, generating aperf.datafile.# Example: Profile at 99Hz for 1 seconds with DWARF call graphs sudo perf record -F 99 -g --call-graph dwarf --output perf.data -- find ~ -name 'foo'Refer to
man perf-recordfor detailed command options. Ensure debug symbols for your binaries are accessible for proper symbolization.If you plan to merge this profile with a Perfetto trace, record it with
-k monoor-k bootso the profile uses a clock compatible with the merged timeline. See the Perf textual section for more details.sudo perf record -k mono -F 99 -g --call-graph dwarf --output perf.data -- find ~ -name 'foo'Convert
perf.datato Firefox Profiler JSON: Use thegeckoreport script withperf script.sudo perf script report gecko --save-only my_linux_profile.jsonThis command processes the
perf.datafile and outputsmy_linux_profile.jsonin a format compatible with the Firefox Profiler. Ifreport geckois not available in yourperfversion, consult your distribution's documentation for alternatives or additionalperfscripting packages.Open this trace in ui.perfetto.dev
Navigate to ui.perfetto.dev and upload the
my_linux_profile.jsonfile into the UI. Once the trace opens, you should be able select either individual CPU samples or ranges of time containing CPU samples to get a flamegraph of all the samples in that region.Here's an example of what that looks like
On Android, simpleperf is used for CPU profiling. The necessary Python scripts
(app_profiler.py, gecko_profile_generator.py) can be obtained by downloading
them directly from the Android Open Source Project (AOSP) using git. You will also
need the NDK.
Download the
simpleperfscripts:git clone https://android.googlesource.com/platform/system/extras --depth=1After cloning, the scripts will be located in the
extras/simpleperf/scriptssubdirectory. Note: this method provides the post-processing scripts, but you will also need a compatiblesimpleperfbinary to record the profile. This binary is typically available on your Android device andapp_profiler.pywill find it automatically.Record a profile using
app_profiler.py: This script invokes the recording on-device and puls the profile to the host machine over ADB.# Replace <your.app.package.name> python extras/simpleperf/scripts/app_profiler.py \ --app <your.app.package.name> \ -r "-g --duration 10" \ -o perf.data- This command profiles the specified app for 10 seconds with DWARF call graphs (
-g). - It writes
perf.dataand abinary_cache/(for symbols). - For more details, see the simpleperf documentation).
- This command profiles the specified app for 10 seconds with DWARF call graphs (
Convert
simpleperfdata to Firefox Profiler JSON: Use thegecko_profile_generator.pyscript from the same AOSP checkout.python extras/simpleperf/scripts/gecko_profile_generator.py \ --symfs binary_cache \ -i perf.data \ > gecko_profile.json- This converts the
simpleperfdata, using symbols from thebinary_cache, into the Firefox Profiler JSON format.
- This converts the
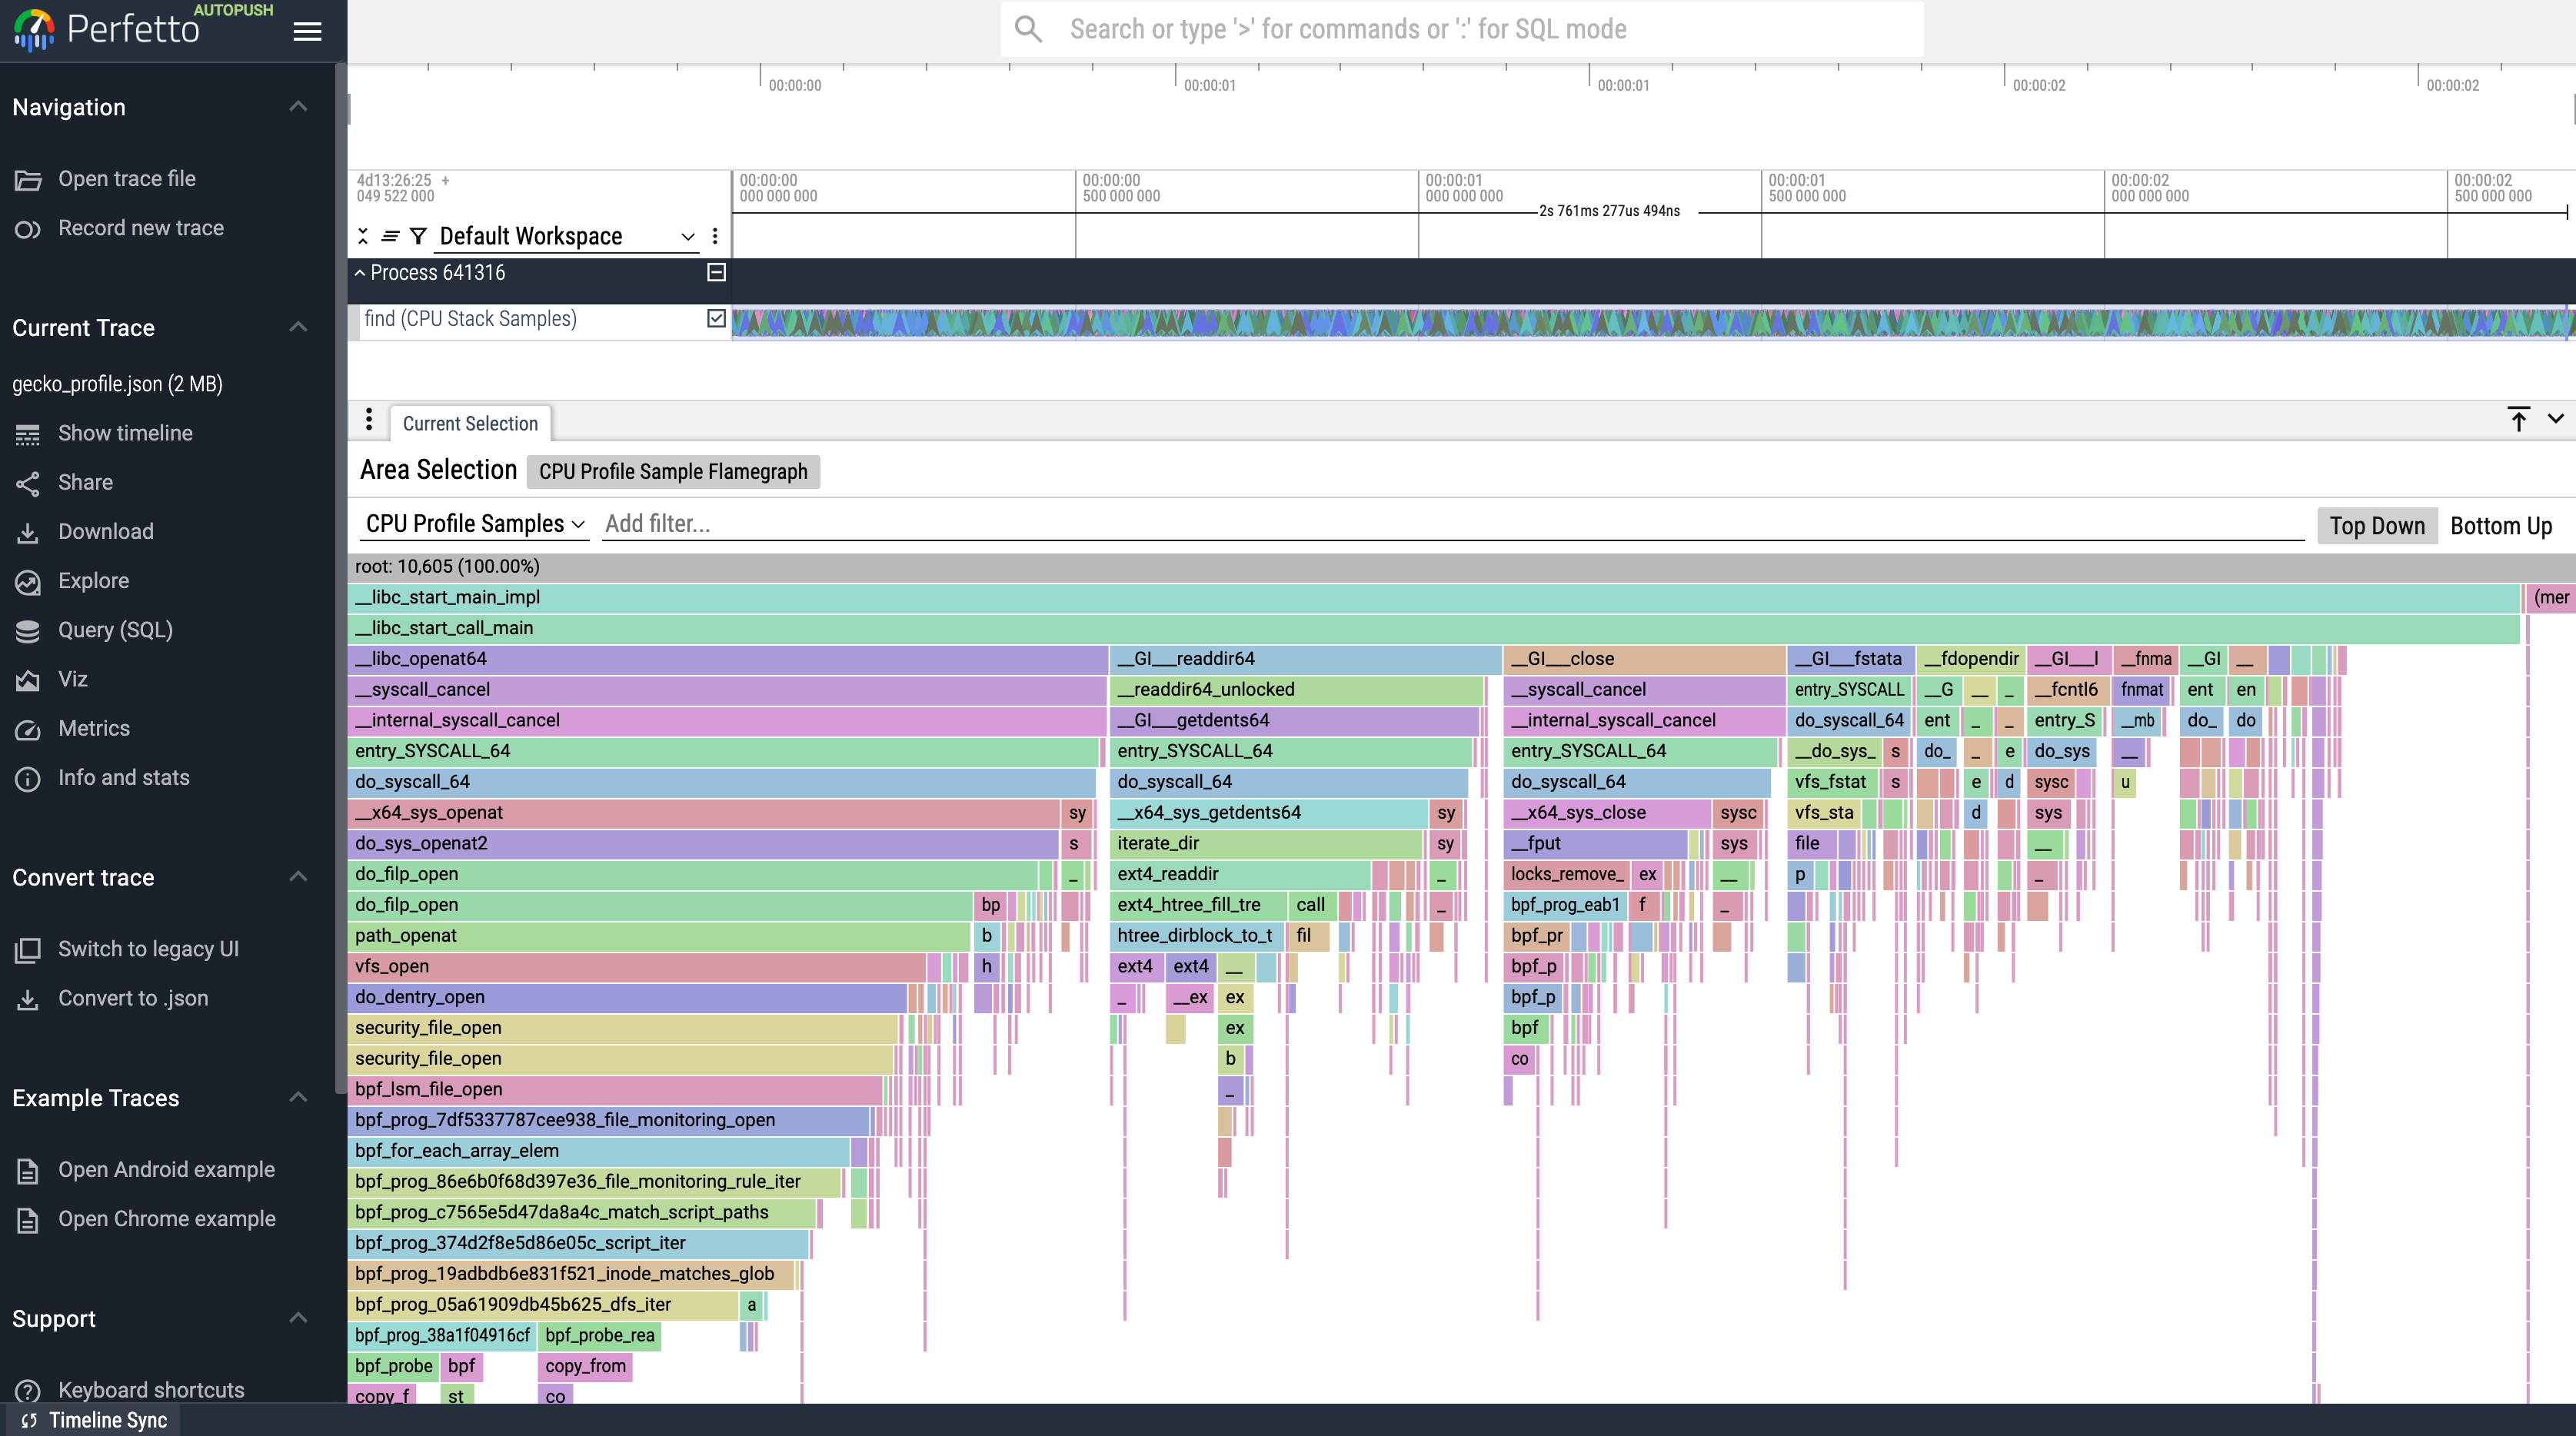
Open this trace in ui.perfetto.dev Navigate to ui.perfetto.dev and upload the
gecko_profile.jsonfile into the UI. Once the trace opens, you should be able select either individual CPU samples or ranges of time containing CPU samples to get a flamegraph of all the samples in that region.Here's an example of what that looks like
samply is a cross-platform sampling CPU profiler that natively records in the Firefox Profiler format.
Install samply via
cargo install --locked samplyor one of the prebuilt binaries linked from the project README.Record a profile and save it to a file with
--save-onlyso samply skips opening the browser and just writes the profile:samply record --save-only -o profile.json -- ./your-binary your-argsWithout
-o, samply writes toprofile.json.gzby default; both extensions are accepted by Perfetto.Open the file in ui.perfetto.dev to inspect samples and any markers samply recorded.
The Python standard library ships a sampling profiler in the
profiling.sampling
module. With the --gecko flag it writes Firefox Profiler JSON, including
markers for the GIL, GC, and (with --opcodes) bytecode-level events.
Run a script under the sampler (Python 3.15 or newer):
python -m profiling.sampling run --gecko -o profile.json script.pyOr attach to a running interpreter:
python -m profiling.sampling attach --gecko -o profile.json <pid>Open the file in ui.perfetto.dev. Stack samples appear in flamegraphs and the GIL/GC/code-type markers populate the slice tracks on each Python thread.
Other methods (less common for Perfetto import scenarios):
- From Firefox Browser: Using the built-in profiler (e.g., via
about:profilingor developer tools) and saving the profile.
External Resources:
- Firefox Profiler Tool: profiler.firefox.com
- Documentation on the format (can be technical):
- Linux
perftool: perf Wiki, man page - Android
simpleperftool: Simpleperf usage - samply (cross-platform sampling profiler): github.com/mstange/samply
- Python sampling profiler (3.15+):
profiling.sampling
Android systrace format
Description: Android Systrace was the legacy system-wide tracing tool
for Android, used primarily before the introduction of Perfetto with Android 9
(Pie). It captures kernel activity via ftrace (e.g., CPU scheduling, I/O) and
userspace annotations via ATrace (e.g., android.os.Trace). Systrace typically
produces an interactive HTML file embedding trace data in a text-based format.
Common Scenarios (Primarily Legacy): You will typically only encounter the Android Systrace format when dealing with older data or legacy workflows, such as:
- Analyzing traces generated on Android systems prior to Android 9 (Pie).
- Working with historical traces recorded using the
systrace.pycommand-line tool. - Examining traces from very old versions of Android Studio's profiler.
For any current or new tracing on Android (version 9 Pie and newer), Perfetto is the standard and strongly recommended tool.
Perfetto Support:
- Perfetto UI: Perfetto can directly open Android Systrace HTML files, parsing the embedded ftrace and ATrace data for visualization. This is primarily for compatibility with historical traces.
- Trace Processor: The Trace Processor also supports parsing the raw textual
ftrace data found within Systrace reports. This data is imported into standard
Perfetto SQL tables (e.g.,
slice,sched_slice,ftrace_event), making it queryable via SQL. - Important Note: Perfetto's support for Systrace is for backward compatibility. Systrace is a deprecated tool for trace collection on modern Android (Android 9 Pie and newer). Perfetto has superseded it, offering significantly more data sources, lower overhead, and more advanced analysis capabilities. New tracing efforts should exclusively use Perfetto.
How to Generate (Legacy Methods): The methods below describe how Systrace files were historically created and are provided for context when dealing with older traces. These methods are deprecated and should not be used for new trace collection on Android 9 (Pie) or newer.
- Using
systrace.py(Deprecated): Historically, these traces were generated using thesystrace.pyscript from the Android SDK Platform Tools. An example command might look like:# python <sdk>/platform-tools/systrace/systrace.py -a <your.app.package.name> -o mytrace.html sched freq idle am wm - Android Studio (Older Versions - Deprecated): Earlier versions of Android Studio's profiler used Systrace. Modern Android Studio now uses Perfetto.
External Resources:
- Systrace Command-Line Reference (Legacy): developer.android.com/topic/performance/tracing/command-line (This page also highlights that Perfetto replaces Systrace for Android 9+)
- Understanding ATrace (Userspace Annotations - relevant for data in Systrace): ATrace: Android system and app trace events
Perf textual format (from perf script)
Description: The "Perf textual format" typically refers to the
human-readable textual output generated by the perf script command on Linux.
This command processes a perf.data file (created by perf record) and prints
a chronological log of the recorded events. The output is highly configurable
via perf script options but commonly includes CPU samples with their call
stacks, timestamps, process/thread identifiers, CPU number, and event names.
Common Scenarios: This format is often used for:
- Manually inspecting the contents of a
perf.datafile for quick analysis or debugging. - As an intermediate input for various third-party scripts and tools, such as
Brendan Gregg's FlameGraph
scripts, which parse
perf scriptoutput to generate flame graphs. - Working with existing
perf scriptoutputs from older profiling sessions or automated systems.
Perfetto Support:
- Perfetto UI & Trace Processor: Perfetto's Trace Processor can parse
textual output generated by
perf script.- The primary focus of this importer is on CPU samples and their associated call stacks.
- When such data is parsed, it populates Perfetto's standard profiling tables
(e.g.,
cpu_profile_stack_sample_tablefor the samples, andstack_profile_callsite,stack_profile_frame,stack_profile_mappingfor the call stack information). - This allows the CPU profile data from the
perf scriptoutput to be visualized as a flamegraph in the Perfetto UI and queried using SQL.
- Limitations:
- The output format of
perf scriptis very flexible depending on the arguments passed to it (e.g., using the-Fflag). Perfetto's parser likely expects a common or default-like output structure for samples. Highly customized or unusualperf scripttextual outputs might not parse correctly or completely. - Support for other types of events (beyond CPU samples with callstacks) that
perf scriptmight output (e.g., raw tracepoints if-Dis used, or other event types) may be limited when importing directly as "Perf textual format." - For robust visualization of CPU profiles from
perf.datawith a feature-rich intermediate format, consider convertingperf.datato the Firefox Profiler JSON format, which Perfetto also supports for sample data.
- The output format of
How to Generate:
Record a profile with
perf record: First, capture profiling data usingperf record. This creates aperf.datafile.# Example: Profile at 99Hz for 1 seconds with DWARF call graphs sudo perf record -F 99 -g --call-graph dwarf --output perf.data -- find ~ -name 'foo'Refer to
man perf-recordfor detailed command options. Ensure debug symbols for your binaries are accessible for proper symbolization byperf script.If you plan to merge this
perf scriptoutput with a Perfetto trace, record it with a merge-friendly clock. The default perf clock can cause the samples to appear offset from the Perfetto trace when the files are merged. Add-k monoforCLOCK_MONOTONICor-k bootforCLOCK_BOOTTIME, choosing the clock that matches the Perfetto trace you plan to merge with:sudo perf record -k mono -F 99 -g --call-graph dwarf --output perf.data -- find ~ -name 'foo'Generate textual output with
perf script: Process theperf.datafile to produce the textual output.# Default output sudo perf script -i perf.data > my_perf_output.txtFor more detailed output that is often useful for other tools (and potentially for Perfetto's parser if it looks for specific fields), you might specify the fields:
perf script -i perf.data -F comm,pid,tid,cpu,time,event,ip,sym,dso,trace > my_perf_output_detailed.txtRefer to
man perf-scriptfor its extensive formatting options.Open this trace in ui.perfetto.dev
Navigate to ui.perfetto.dev and upload the
my_perf_output.txtfile into the UI. Once the trace opens, you should be able select either individual CPU samples or ranges of time containing CPU samples to get a flamegraph of all the samples in that region.Here's an example of what that looks like
External Resources:
perf-scriptman page:man perf-script(or search online, e.g., perf-script Linux man page)perftool general information: perf Wiki (kernel.org)- Brendan Gregg's
perfexamples: Brendan Gregg's perf page (Contains many examples ofperf scriptusage, especially for flame graphs)
Simpleperf proto format
Description: Simpleperf is Android's profiling tool built on top of the
Linux perf framework. The "Simpleperf proto format" refers to the binary
protobuf format generated by the simpleperf report-sample --protobuf command.
This format contains CPU samples with call stacks, process/thread information,
file mappings, and symbol tables in a compact binary representation. Android
Studio's CPU profiler uses this format internally when displaying simpleperf
profiles.
Common Scenarios: This format is used for:
- Profiling Android applications and system services using simpleperf
- Analyzing CPU performance on Android devices
- Capturing stack samples with symbol information for both native and managed code
- Working with profiles collected by Android Studio's CPU profiler (which converts simpleperf data to this proto format)
Perfetto Support:
- Perfetto UI & Trace Processor: Perfetto's Trace Processor can directly
parse simpleperf's protobuf format.
- The importer processes CPU samples with call stacks, file mappings, and symbol tables
- Samples are imported into
cpu_profile_stack_sampletable with full call stack information - Call stacks are stored in standard profiling tables
(
stack_profile_callsite,stack_profile_frame,stack_profile_mapping) - Thread and process information is extracted and stored in the process/thread tables
- This allows simpleperf profiles to be visualized as flamegraphs in the Perfetto UI and queried using SQL
- Limitations:
- Context switch records in simpleperf format are not yet imported
- Event type metadata is stored but not yet used for filtering or categorization
How to Generate:
Record a profile with simpleperf: First, capture profiling data using
simpleperf record.# Example: Profile an Android app with call graphs adb shell simpleperf record -p <pid> -g --duration 10 adb pull /data/local/tmp/perf.data simpleperf.dataRefer to
simpleperf record --helpfor detailed command options.Convert to proto format: Use
simpleperf report-sampleto convert the raw recording to protobuf format:# Convert to proto format with call chains simpleperf report-sample --protobuf --show-callchain \ -i simpleperf.data -o simpleperf.proto # Optionally provide symbol directories for better symbolization simpleperf report-sample --protobuf --show-callchain \ -i simpleperf.data -o simpleperf.proto \ --symdir /path/to/symbolsThe
--show-callchainflag is required to include call stack information in the output.Open in ui.perfetto.dev
Navigate to ui.perfetto.dev and upload the
simpleperf.protofile. The trace will be imported and you can view flamegraphs of the CPU samples by selecting time ranges in the UI.
Linux ftrace textual format
Description: The Linux ftrace textual format is the raw, human-readable
output generated by the Linux kernel's ftrace tracing infrastructure. Each
line in this text-based format typically represents a single trace event and
follows a common structure:
TASK-PID CPU# [MARKERS] TIMESTAMP FUNCTION --- ARGS. For example, a
sched_switch event might look like:
bash-1234 [002] ...1 5075.958079: sched_switch: prev_comm=bash prev_pid=1234 prev_prio=120 prev_state=R ==> next_comm=trace-cmd next_pid=5678 next_prio=120.
This format can be quite verbose but is fundamental to how ftrace operates and
is exposed via the tracefs filesystem (usually mounted at
/sys/kernel/tracing).
Common Scenarios: You are likely to encounter or use this format when:
- Analyzing ftrace data captured using the
trace-cmdutility, specifically with commands liketrace-cmd reportortrace-cmd stream. - Directly reading from ftrace buffer files in
tracefs, such as/sys/kernel/tracing/trace. - Working with older Linux kernel debugging workflows or custom scripts that produce this textual output.
- Inspecting the raw data embedded within Android Systrace HTML files, as they use this underlying format.
Perfetto Support: Perfetto's support for the ftrace textual format is primarily for legacy compatibility and is maintained on a best-effort basis.
- Perfetto UI: The Perfetto UI can directly open ftrace textual log files
(often with
.txtor.ftraceextensions). It visualizes known event types by parsing the text lines. For instance:sched_switchevents are displayed as scheduling slices on CPU tracks.printevents that match the ATrace format are shown as userspace slices.- Other ftrace events present in the text file might not be visualized if they don't map to recognized Perfetto UI elements.
- Trace Processor: When parsing ftrace textual logs, Perfetto's Trace
Processor will:
- Parse recognized events (e.g.,
sched_switch,sched_waking,cpu_frequency, atrace-compatibleprintevents) into their corresponding structured SQL tables (e.g.,sched_slice,slice,counter). - Unlike Perfetto's native ftrace protobuf ingestion, unrecognized or
generic ftrace events from a textual ftrace file are generally not populated
into a broad
ftrace_eventcatch-all table. Support is typically limited to events that have specific parsers for creating structured tables.
- Parse recognized events (e.g.,
- Recommendation: For new tracing activities on systems where Perfetto is
available (especially Android 9+ or Linux systems with Perfetto installed),
using Perfetto's native ftrace data source is strongly recommended.
Perfetto's direct collection records ftrace data into its own efficient binary
protobuf format, offering better performance, richer features (including
parsing of generic ftrace events into the protobuf
GenericFtraceEventtype), and more robust support. Importing the textual format should be reserved for analyzing pre-existing logs.
How to Generate (for context on existing logs): These methods describe how
ftrace textual logs are typically created using tracefs (usually mounted at
/sys/kernel/tracing). For new tracing, prefer using Perfetto's ftrace data
source directly.
Using
trace-cmd:trace-cmdis a user-space frontend for ftrace.# Example: Record scheduling and syscall events sudo trace-cmd record -e sched -e syscalls # After stopping (Ctrl-C or by duration), generate the textual report: trace-cmd report > my_ftrace_log.txtOr for a live stream:
sudo trace-cmd stream -e sched:sched_waking -e irq:irq_handler_entry > my_ftrace_log.txt(Stop with Ctrl-C). Refer to
man trace-cmdfor more options.Directly from
tracefs(more manual): You can interact with ftrace via the/sys/kernel/tracing/interface.# Example: Enable sched_switch and printk events sudo sh -c 'echo sched:sched_switch print > /sys/kernel/tracing/set_event' # Enable tracing sudo sh -c 'echo 1 > /sys/kernel/tracing/tracing_on' # ... allow the system to run or perform actions you want to trace ... # Capture the trace buffer sudo cat /sys/kernel/tracing/trace > my_ftrace_log.txt # Disable tracing and clear events sudo sh -c 'echo 0 > /sys/kernel/tracing/tracing_on' sudo sh -c 'echo > /sys/kernel/tracing/set_event' # Clear events
External Resources:
- Official Ftrace Documentation:
Ftrace - Function Tracing (kernel.org)
(Primary source:
Documentation/trace/ftrace.txtorftrace.rstin the Linux kernel source) trace-cmdMan Page:man trace-cmd(or find it online, e.g., on Arch Linux man pages)- Tracefs Documentation: The Tracefs Pseudo Filesystem (kernel.org)
ART method tracing format
Description: The Android Runtime (ART) method tracing format (commonly found
in .trace files) is a binary format specific to Android. It captures detailed
information about the execution of Java and Kotlin methods within an Android
application, essentially logging the entry and exit points of each called
method. This allows for a fine-grained analysis of an app's runtime behavior at
the method level.
Common Scenarios: This format is typically used when:
- Needing to deeply profile the performance of specific Java or Kotlin code paths in an Android app to identify performance bottlenecks or understand complex call sequences.
- Analyzing traces generated by Android Studio's CPU Profiler, specifically when using the "Trace Java Methods" recording configuration.
- Working with traces created programmatically from within an application using
the
android.os.Debug.startMethodTracing()API.
Perfetto Support:
- Perfetto UI:
.tracefiles can be opened directly in the Perfetto UI. The method calls are typically visualized as a flamegraph, providing an intuitive way to see where time is spent. They are also be displayed as nested slices on the timeline for each thread. - Trace Processor: Perfetto's Trace Processor has built-in support for
parsing ART method trace files (
.trace).- Each method invocation (entry and exit) is imported as a distinct slice into
the
slicetable. These slices are associated with their respective threads and processes. - This enables detailed SQL-based analysis of method execution times, call counts, stack depth, and relationships between different methods.
- Each method invocation (entry and exit) is imported as a distinct slice into
the
- Important Note on Overhead: ART method tracing, by its nature of instrumenting every method call, can introduce significant performance overhead to the application being profiled. This overhead might alter the very behavior you are trying to measure. For less intrusive CPU profiling of Java/Kotlin code, consider using Android Studio's "Sample Java Methods" option or Perfetto's system-wide callstack sampling capabilities, though these provide statistical data rather than an exact log of all method calls.
How to Generate:
Android Studio CPU Profiler:
- Open the Android Studio Profiler (View > Tool Windows > Profiler).
- Select your device and the application process you want to profile.
- In the CPU profiler section, choose the "Trace Java Methods" recording configuration from the dropdown menu.
- Click "Record," perform the actions in your app that you want to profile, and then click "Stop."
- The collected
.tracefile can then be exported from the Android Studio profiler interface for use in Perfetto.
Programmatically within an app: You can instrument your app's Java/Kotlin code to start and stop method tracing using the
android.os.Debugclass:import android.os.Debug; // ... // In your application code: // To start tracing: // Debug.startMethodTracing("myAppTraceName"); // The .trace file will typically be saved to a location like: // /sdcard/Android/data/<your_app_package_name>/files/myAppTraceName.trace // or /data/data/<your_app_package_name>/files/myAppTraceName.trace depending on Android version and permissions. // ... execute the code you want to profile ... // To stop tracing: // Debug.stopMethodTracing();After stopping, you'll need to pull the generated
.tracefile from the device using ADB (e.g.,adb pull /sdcard/Android/data/<your_app_package_name>/files/myAppTraceName.trace .). The exact path can vary, so check your app's specific file storage location.
External Resources:
- Android Developer -
Debugclass documentation: developer.android.com/reference/android/os/Debug (SeestartMethodTracing()andstopMethodTracing()) - Android Developer - Inspect CPU activity with CPU Profiler: developer.android.com/studio/profile/cpu-profiler (Provides details on "Trace Java Methods")
macOS Instruments format (XML export)
Description: Apple's Instruments tool, part of Xcode, is used for
performance analysis on macOS and iOS. While Instruments saves its full data in
a proprietary .trace package format, Perfetto's support focuses on an XML
format that can be exported from these Instruments traces. This XML export is
primarily useful for extracting CPU profiling data (stack samples).
Common Scenarios: This import path is relevant when:
- You have CPU performance data (e.g., from the Time Profiler instrument) collected using Apple's Instruments.
- You wish to visualize this CPU stack sample data as a flamegraph or analyze it using Perfetto's tools.
Perfetto Support:
- Perfetto UI & Trace Processor: Perfetto can parse the XML file exported
from a macOS Instruments trace.
- The primary focus of this import is on CPU stack samples.
- Data such as call stacks, sample timestamps, and thread information is
extracted and loaded into Perfetto's profiling tables, specifically
cpu_profile_stack_samplefor the samples themselves, andstack_profile_callsite,stack_profile_frame,stack_profile_mappingfor the call stack information. - This enables the visualization of the CPU profile as a flamegraph within the Perfetto UI and allows for SQL-based querying of the sample data.
- Limitations:
- Support is mainly targeted at CPU stack sample data from the XML export.
- Other rich data types or specific features from the diverse set of tools within Instruments (e.g., detailed memory allocations, custom os_signpost data if not in a compatible part of the XML) may not be supported or fully represented through this XML import path.
How to Generate: Traces are originally collected using the Instruments
application in Xcode or the xctrace command-line utility, which produce a
.trace package. The XML file that Perfetto ingests is an export from such a
trace. (The specific steps for exporting to this XML format from Instruments
would need to be followed within the Instruments tool itself; Perfetto then
consumes the resulting XML file).
External Resources:
- Apple Developer - Instruments: For general information on what Instruments can do, refer to the official Instruments User Guide or search for current Instruments documentation on developer.apple.com.
Ninja logs format (.ninja_log)
Description: The Ninja build system, known for its speed and use in projects
like Chromium and Android, generates a log file typically named .ninja_log.
This file is a tab-separated text file that records metadata about each command
(build step) executed during the build process. Key information for each entry
includes the start time (in milliseconds), end time (in milliseconds), the
restat mtime (in milliseconds), the primary output file path of the build step,
and a hash of the command itself. The format is versioned, with new versions
occasionally adding fields.
Common Scenarios: This format is used when:
- Analyzing the performance of software builds that utilize the Ninja build system.
- Identifying which build steps are taking the longest, understanding the degree of parallelism in the build, and diagnosing potential bottlenecks that slow down compilation or linking.
- Visualizing the build process over time.
Perfetto Support:
- Perfetto UI & Trace Processor: Perfetto's Trace Processor can parse
.ninja_logfiles.- Each build step recorded in the
.ninja_logis typically imported as a distinct slice into theslicetable. - To visualize these build steps on a timeline, Perfetto often synthesizes process and thread information. For instance, all build steps might be grouped under a single "Ninja Build" process, with individual tracks potentially created for each unique output file path or based on other heuristics to represent concurrency.
- The timestamps (start and end times) are converted from milliseconds to nanoseconds for consistency within Perfetto.
- This allows the build process to be visualized in the Perfetto UI, showing the duration and concurrency of various compilation, linking, and other build tasks, which can be very helpful for understanding the build's critical path.
- Each build step recorded in the
- Limitations: The
.ninja_logonly records completed commands. It doesn't provide information about dependencies directly in its per-step log format, though this can sometimes be inferred by analyzing the sequence and timing of output files.
How to Generate:
- Automatically by Ninja: The Ninja build system automatically creates and
incrementally updates the
.ninja_logfile in the root of your build output directory (e.g.,out/Default/,build/, etc.) every time it runs a build. - No special flags are typically needed to enable the generation of
.ninja_logas it is a standard feature for build auditing andninja -t recompactusage.
External Resources:
- Ninja Build System Manual - Log File: ninja-build.org/manual.html#_log_file
- Ninja Build System Home: ninja-build.org
Android logcat textual format
Description: Android logcat is the command-line tool used to access messages
from Android's system-wide logging service, logd. The textual output from
adb logcat is what Perfetto can import. This output can vary significantly
based on the formatting options specified (e.g., via adb logcat -v <format>),
but typically includes a timestamp, log priority (Verbose, Debug, Info, Warn,
Error, Fatal/Assert), a tag identifying the source of the log, the Process ID
(PID), often the Thread ID (TID), and the log message itself.
Common Scenarios: You might work with textual logcat files when:
- Performing traditional debugging of Android applications or system services using their textual log output.
- Analyzing log files previously saved from
adb logcatsessions. - Extracting logcat information from Android bug reports (where logcat data is
embedded within
bugreport.txtor as separate files).
Perfetto Support:
- Perfetto UI & Trace Processor: Perfetto's Trace Processor can parse
textual logcat files.
- Imported log messages are populated into the
android_logsSQL table. This is the same table used when Perfetto collects logcat data natively via its Android Log data source. - In the Perfetto UI, these logs appear in the "Android Logs" panel, where they are displayed chronologically and can be filtered. This allows correlation of log messages with other trace events on the main timeline.
- Imported log messages are populated into the
- Supported Formats: Perfetto's parser is designed to handle common
adb logcatoutput formats, with good support forlogcat -v longandlogcat -v threadtime. Other, more esoteric or heavily customized logcat formats might not be fully parsed.
How to Generate Textual Logcat Files:
- Using
adb logcat: The primary method is via theadb logcatcommand, redirecting its output to a file.- To dump the current contents of the log buffers and then exit (useful for a
snapshot):
# Dumps logs in 'long' format adb logcat -d -v long > logcat_dump_long.txt # Dumps logs in 'threadtime' format (timestamp, PID, TID, priority, tag, message) adb logcat -d -v threadtime > logcat_dump_threadtime.txt - To stream live logs to a file (press Ctrl-C to stop):
adb logcat -v long > logcat_stream_long.txt
# Or, for a more parse-friendly streaming format:
adb logcat -v threadtime > logcat_stream_threadtime.txt
- To dump the current contents of the log buffers and then exit (useful for a
snapshot):
- From Android Bug Reports: Logcat data is a standard component of bug
reports generated by
adb bugreport. You can often find the logcat output within the mainbugreport.txtfile or as separate log files within the bug report archive.
External Resources:
logcatCommand-Line Tool (Official Android Documentation): developer.android.com/studio/command-line/logcat- Reading and Writing Logs (General Overview): developer.android.com/studio/debug/am-logcat
Android bugreport zip format (.zip)
Description: An Android bugreport is a .zip archive generated by Android
devices, containing a comprehensive snapshot of diagnostic information from an
Android device at a particular point in time. This archive bundles various logs
(like logcat), system properties, process information, stack traces for ANRs and
crashes, and importantly, a system trace (typically a Perfetto trace on modern
Android versions). It also contains detailed dumpstate output, which includes
board-level information and specific service dumps like batterystats.
Common Scenarios: Bugreport zip files are primarily used for:
- Capturing extensive diagnostic data when reporting bugs or analyzing complex issues on Android devices, whether for app development or platform-level debugging.
- Providing detailed system state information to Google, device manufacturers (OEMs), or other developers to help diagnose problems.
Perfetto Support:
- Perfetto UI & Trace Processor: Perfetto can directly open and process
Android bugreport
.zipfiles.- When a bugreport zip is loaded, Perfetto automatically:
- Scans the archive for Perfetto trace files (
.pftrace,.perfetto-trace) in known locations (e.g.,FS/data/misc/perfetto-traces/,proto/perfetto-trace.gz). The primary Perfetto trace found is loaded for visualization and SQL querying. - Parses the main
dumpstateboard-level information (often found in files likebugreport-*.txtordumpstate_board.txt) into thedumpstateSQL table. This table includes system properties, kernel version, build fingerprints, and other hardware/software details. - Extracts detailed battery statistics from the
batterystatssection of the dumpstate into thebattery_statsSQL table. This provides information on battery levels, charging status, and power events over time.
- Scans the archive for Perfetto trace files (
- This integrated approach allows users to analyze not only the system trace
but also key system state (from
dumpstate) and battery information (frombattery_stats) from the bugreport within a unified Perfetto environment, without needing to manually extract these components. - Note: Perfetto's focus when processing bugreports is on its own native
trace format and specific, structured parts of the
dumpstatelikebatterystats. It generally does not attempt to import or parse legacy Systrace files (systrace.htmlorsystrace.txt) that might be present in older bugreports. For analyzing those, you'd typically extract them manually and open them as per the Android systrace format section.
- When a bugreport zip is loaded, Perfetto automatically:
How to Generate:
Using
adb bugreport(from a computer connected to the device): This is the most common method for developers.adb bugreport ./my_bugreport_filename.zipThis command instructs the connected Android device to generate a bug report and saves it as a
.zipfile to the specified path on your computer.From Developer Options on the Android device:
- Enable Developer Options on your Android device (usually by going to Settings > About phone and tapping "Build number" seven times).
- Navigate to Settings > System > Developer options.
- Find and tap the "Bug report" or "Take bug report" option. The exact wording and sub-menu might vary slightly depending on the Android version and device manufacturer.
- You might be prompted to choose the type of bug report (e.g., "Interactive report" for more details during capture, or "Full report" for the most comprehensive data).
- After the bug report is generated (which can take a few minutes), a
notification will appear. Tapping this notification typically allows you
to share the
.zipfile (e.g., via email, a file sharing app, or by saving it to cloud storage).
External Resources:
- Capture and read bug reports (Official Android Documentation): developer.android.com/studio/debug/bug-report
Trace archives (.zip, .tar)
Description: A ZIP or TAR archive containing several trace files, in any mix of the formats on this page.
Perfetto Support: Both the UI and Trace Processor open archives directly and merge the traces inside onto a single timeline. An optional trace manifest file inside the archive controls how the traces are merged: which machine each file belongs to and how their clocks relate. See Merging traces with Trace Processor for how to build such archives and Merging traces in the Perfetto UI for the interactive equivalent, which can also export the archive it builds.
When merging traces produced from Linux perf, choose a merge-friendly clock
at recording time; see the notes in the
Firefox Profiler JSON and
Perf textual sections above.
Fuchsia tracing format (.fxt)
Description: The Fuchsia trace format (typically found in .fxt files) is a
binary format used by the Fuchsia operating system. It's designed for
high-performance, low-overhead recording of diagnostic information from both
userspace components and the Zircon kernel. The format features compact,
memory-aligned records and is extensible, with trace data often written directly
into Zircon Virtual Memory Objects (VMOs) for efficiency.
Common Scenarios: This format is primarily encountered when:
- Working with traces recorded on a Fuchsia OS device or emulator for debugging system behavior or analyzing performance.
- In some niche, non-Fuchsia use cases where a binary, compact, and streamable
format with similarities to Chrome JSON's event structure is desired.
- However, for such custom tracing needs outside of the Fuchsia ecosystem, generating Perfetto's native TrackEvent protobuf format is generally recommended as it is more feature-rich and better supported by Perfetto tools.
Perfetto Support:
- Perfetto UI:
.fxtfiles can be opened directly in the Perfetto UI for visualization. The UI can display various Fuchsia-specific events and system activities. - Trace Processor: Perfetto's Trace Processor supports parsing the Fuchsia binary format. This allows the trace data, including events, scheduling records, and logs, to be imported into standard Perfetto SQL tables, making it available for query-based analysis.
How to Generate:
- On Fuchsia OS:
- Using
ffx(Fuchsia's developer tool): The primary way to record traces on a Fuchsia system from a development host is using theffx trace startcommand. - On-target
traceutility: Fuchsia devices also include atraceutility that can control tracing and save trace data. - Kernel-specific tracing with
ktrace: For Zircon kernel-level tracing, thektracecommand-line utility can be used.
- Using
- Programmatically by custom tools: Some projects might also generate this format programmatically for specific non-Fuchsia use cases, particularly if a binary, compact, and streamable trace format is needed.
External Resources:
- Official Fuchsia Tracing Documentation: Fuchsia Tracing Guides
- Fuchsia Trace Format Specification: Fuchsia trace format
- Tutorial on recording and visualizing: Record and visualize a trace (Fuchsia Docs)
pprof format
Description: The pprof format is a protocol buffer-based format used for
storing CPU profile data. pprof is a tool for visualization and analysis of
profiling data. It reads a collection of profiling samples in profile.proto
format and generates reports to visualize and help analyze the data. It was
developed for and is used by the Go programming language's pprof profiler,
but has since been adopted by a wide range of other profilers for other
languages (e.g. Python, C++, Rust, etc.).
Common Scenarios: The most common reason Perfetto users encounter this format is for:
- Visualizing Go CPU profiles: Developers often collect CPU samples using the Go pprof profiler and need a way to visualize them.
- Using cross-platform profiling tools: Some profiling tools and libraries are designed to output or convert their data into this format, facilitating analysis with pprof-compatible tools.
- Analyzing Linux
perfprofiles:pprofcan readperf.datafiles generated by the Linux perf tool by using theperf_to_profileprogram from the perf_data_converter package.
Perfetto Support:
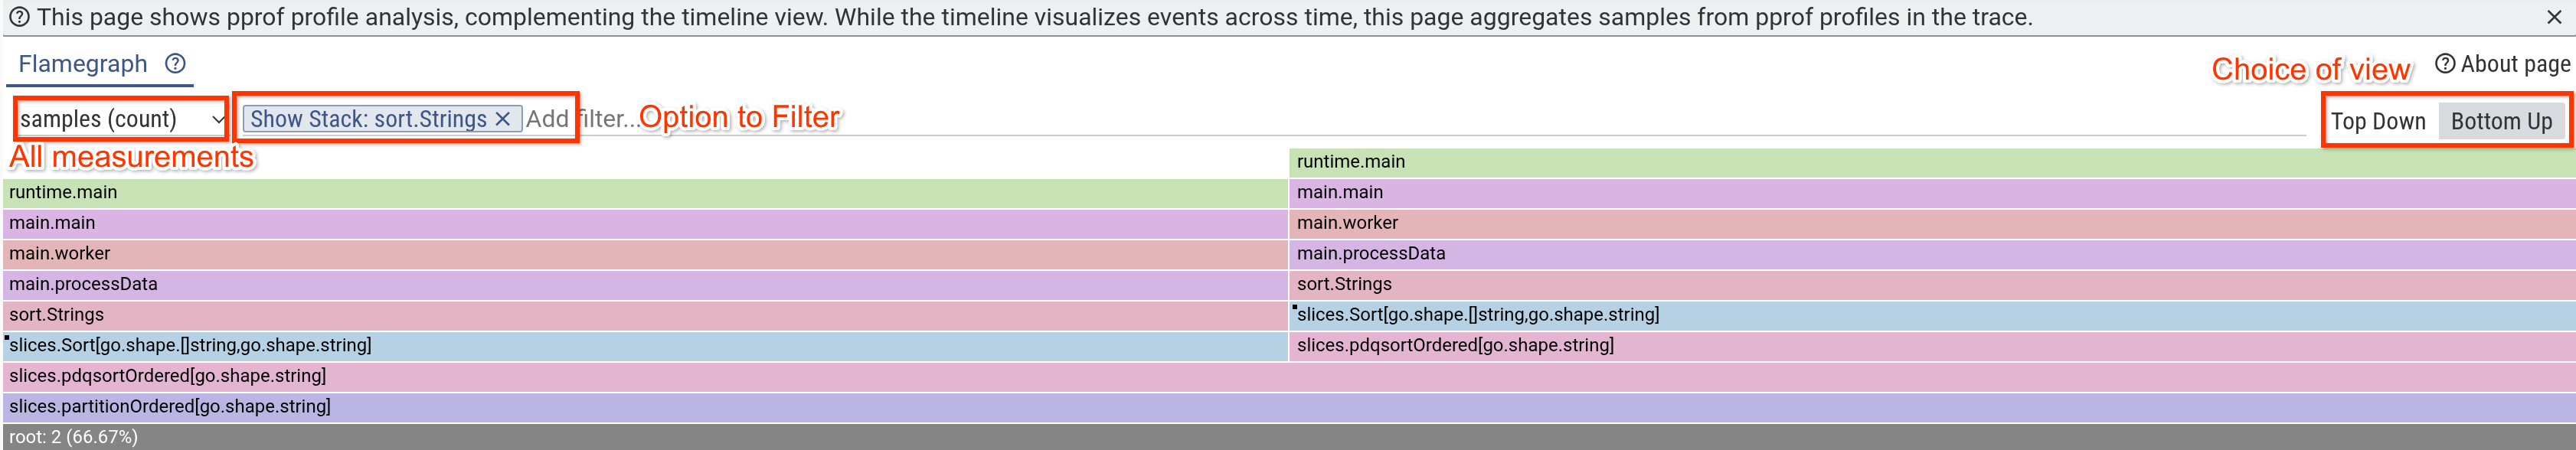
Perfetto UI: When a
pproffile is opened, Perfetto visualizes the profiling data as an interactive flamegraph. If thepproffile contains multiple metrics (e.g., CPU time and memory allocations), the UI allows you to switch between them, displaying a separate flamegraph for each metric. This enables intuitive analysis of call stacks and helps identify performance hotspots across different dimensions.Here's an example of what that looks like
How to Generate: The most relevant generation path for Perfetto users
involves collecting CPU profiles from Go programs or converting perf.data files.
Collect a CPU profile from a Go program: You can either use the
runtime/pprofpackage to programmatically collect a profile or use thenet/http/pprofpackage to expose a profiling endpoint on a running server.To collect a profile from a running server, you can use the
go tool pprofcommand:go tool pprof http://localhost:6060/debug/pprof/profile?seconds=30This will collect a 30-second CPU profile and open it in the pprof tool. You can then save the profile to a file using the
savecommand in the pprof tool.Convert Linux
perf.datato pprof format: Use theperf_to_profiletool from theperf_data_converterpackage.perf_to_profile -i perf.data -o perf.pprof
External Resources:
- pprof GitHub Repository: https://github.com/google/pprof
- Go pprof documentation: https://pkg.go.dev/runtime/pprof
- pprof format specification: https://github.com/google/pprof/blob/main/proto/profile.proto
- Linux
perftool: perf Wiki perf_data_converterGitHub Repository: https://github.com/google/perf_data_converter
Collapsed Stack format
Description: The Collapsed Stack format is a simple text-based format for representing profiling data, commonly used with Brendan Gregg's FlameGraph tools. Each line contains a semicolon-separated stack trace (from root to leaf) followed by a space and a sample count. This format is popular for its simplicity and is often used as an intermediate format when generating flame graphs from various profiling sources.
Format Specification:
frame1;frame2;frame3 count
# Lines starting with # are comments- Each line represents a unique stack trace with its sample count
- Frames are separated by semicolons (
;) - The root frame comes first, the leaf frame comes last
- The count is a positive integer separated from the stack by a space
- Lines starting with
#are treated as comments - Empty lines and leading/trailing whitespace are ignored
Common Scenarios: This format is typically used when:
- Working with output from
perf scriptthat has been processed throughstackcollapse-perf.plor similar tools. - Using Brendan Gregg's FlameGraph toolchain for generating SVG flame graphs.
- Converting profiles from various sources into a universal, simple format.
- Analyzing profiles that have been aggregated or pre-processed.
Perfetto Support:
- Perfetto UI: When a collapsed stack file is opened, Perfetto visualizes the profiling data as an interactive flamegraph, similar to pprof files.
How to Generate:
The most common generation paths involve processing perf output:
# Record a profile
sudo perf record -F 99 -g -- ./my_program

# Convert to collapsed stack format
perf script | stackcollapse-perf.pl > profile.collapsed

# Open in Perfetto
# Navigate to ui.perfetto.dev and upload profile.collapsed
External Resources:
- FlameGraph GitHub Repository: https://github.com/brendangregg/FlameGraph
- Brendan Gregg's Flame Graphs page: https://www.brendangregg.com/flamegraphs.html