
Converting arbitrary timestamped data to Perfetto
In this guide, you'll learn how to:
- Convert your own timestamped data into the Perfetto trace format.
- Create custom tracks, slices, and counters.
- Visualize your custom data in the Perfetto UI.
If you have existing logs or timestamped data from your own systems, you don't need to miss out on Perfetto's powerful visualization and analysis capabilities. By converting your data into Perfetto's native protobuf-based trace format, you can create synthetic traces that can be opened in the Perfetto UI and queried with Trace Processor.
This page provides a guide on how to programmatically generate these synthetic traces.
The Basics: Perfetto's Trace Format
A Perfetto trace file (.pftrace or .perfetto-trace) is a sequence of
TracePacket messages, wrapped in a
root Trace message. Each TracePacket can
contain various types of data.
For generating traces from custom data, the most common and flexible payload to
use within a TracePacket is the
TrackEvent. TrackEvent
allows you to define:
- Tracks: A single sequence of events (slices or counter) over time. Corresponds to a single "swim-lane" in the Perfetto UI.
- Slices: Events with a name, start timestamp, and duration (e.g., function calls, tasks).
- Counters: Numeric values that change over time (e.g., memory usage, custom metrics).
- Flows: Arrows connecting related slices across different tracks.
Generating Traces Programmatically
The examples in this guide use Python and a helper class from the perfetto
Python library to demonstrate how to construct these protobuf messages. However,
the underlying principles and protobuf definitions are language-agnostic. You
can generate Perfetto traces in any programming language that has Protocol
Buffer support.
- Official Protobuf Libraries: Google provides official protobuf compilers and runtime libraries for languages like Java, C++, Python, Go, and more.
- Third-Party Libraries: Numerous third-party libraries also provide protobuf support for a wide range of languages.
Regardless of the language, the core task is to construct TracePacket messages
according to the Perfetto
protobuf schemas
and serialize them into a binary file.
Python Script Template
For the Python examples in the following sections, we'll use a script template.
This script handles the basics of creating a trace file and serializing
TracePacket messages. You'll fill in the populate_packets function with the
specific logic for the type of trace data you want to create.
First, ensure you have the perfetto library installed, which provides the
necessary protobuf classes and potentially a builder utility (like the
TraceProtoBuilder class you've designed, or an equivalent from the library).
pip install perfettoHere is the Python script template. Save this as trace_converter_template.py
or a similar name. Each subsequent example will show you what code to place
inside the populate_packets function.
Click to expand/collapse Python code
#!/usr/bin/env python3
import uuid

from perfetto.trace_builder.proto_builder import TraceProtoBuilder
from perfetto.protos.perfetto.trace.perfetto_trace_pb2 import TrackEvent, TrackDescriptor, ProcessDescriptor, ThreadDescriptor

# Define a unique ID for this sequence of packets (generate once per trace producer)
TRUSTED_PACKET_SEQUENCE_ID = 1001 # Choose any unique integer

def get_uuid() -> int:
    return uuid.uuid4().int & ((1 << 63) - 1)

def populate_packets(builder: TraceProtoBuilder):
    """
    This function is where you will define and add your TracePackets
    to the trace. The examples in the following sections will provide
    the specific code to insert here.

    Args:
        builder: An instance of TraceProtoBuilder to add packets to.
    """
    # ======== BEGIN YOUR PACKET CREATION CODE HERE ========
    # Example (will be replaced by specific examples later):
    #
    # packet = builder.add_packet()
    # packet.timestamp = 1000
    # packet.track_event.type = TrackEvent.TYPE_SLICE_BEGIN
    # packet.track_event.name = "My Example Event"
    # packet.track_event.track_uuid = 12345
    #
    # packet2 = builder.add_packet()
    # packet2.timestamp = 2000
    # packet2.track_event.type = TrackEvent.TYPE_SLICE_END
    # packet2.track_event.track_uuid = 12345
    #
    # ========  END YOUR PACKET CREATION CODE HERE  ========

    # Remove this 'pass' when you add your code
    pass


def main():
    """
    Initializes the TraceProtoBuilder, calls populate_packets to fill it,
    and then writes the resulting trace to a file.
    """
    builder = TraceProtoBuilder()
    populate_packets(builder)

    output_filename = "my_custom_trace.pftrace"
    with open(output_filename, 'wb') as f:
      f.write(builder.serialize())

    print(f"Trace written to {output_filename}")
    print("Open with [https://ui.perfetto.dev](https://ui.perfetto.dev).")

if __name__ == "__main__":
    main()
To use this template:
- Save the code above as a Python file (e.g.
trace_converter_template.py). - For each example in the sections that follow (e.g., "Thread-scoped slices,"
"Counters"), copy the Python code provided in that section and paste it into
the
populate_packetsfunction in yourtrace_converter_template.pyfile, replacing the example placeholder content. - Run the script:
python trace_converter_template.py. This will generatemy_custom_trace.pftrace.
The TraceProtoBuilder class (which is imported from perfetto pip package)
helps manage the list of TracePacket messages that form the Trace. The
populate_packets function is where you'll define the content of these packets
based on your specific data.
Creating Basic Timeline Slices
The most fundamental way to represent an activity in Perfetto is as a "slice." A slice is simply a named event that has a start time and a duration. Slices live on "tracks," which are visual timelines in the Perfetto UI. Essentially, slices are used in any situation where you want to say "a named activity was happening during this specific interval of time."
Common examples of what slices can represent include:
- The interval of time during which a particular function was executing.
- The interval of time spent waiting for a server to respond to a network request.
- The time it takes for a resource (like an image, a script, or a data file) to load.
- The duration of a specific phase in an application's lifecycle, like "parsing data" or "rendering frame."
To create slices from your custom data, you'll typically:
- Define a track where your slices will appear. This is done using a
TrackDescriptorpacket. For basic custom data, you can create a generic track that isn't tied to a specific process or thread. - For each event in your data, emit
TrackEventpackets to mark the beginning and end of the slice.
Python Example
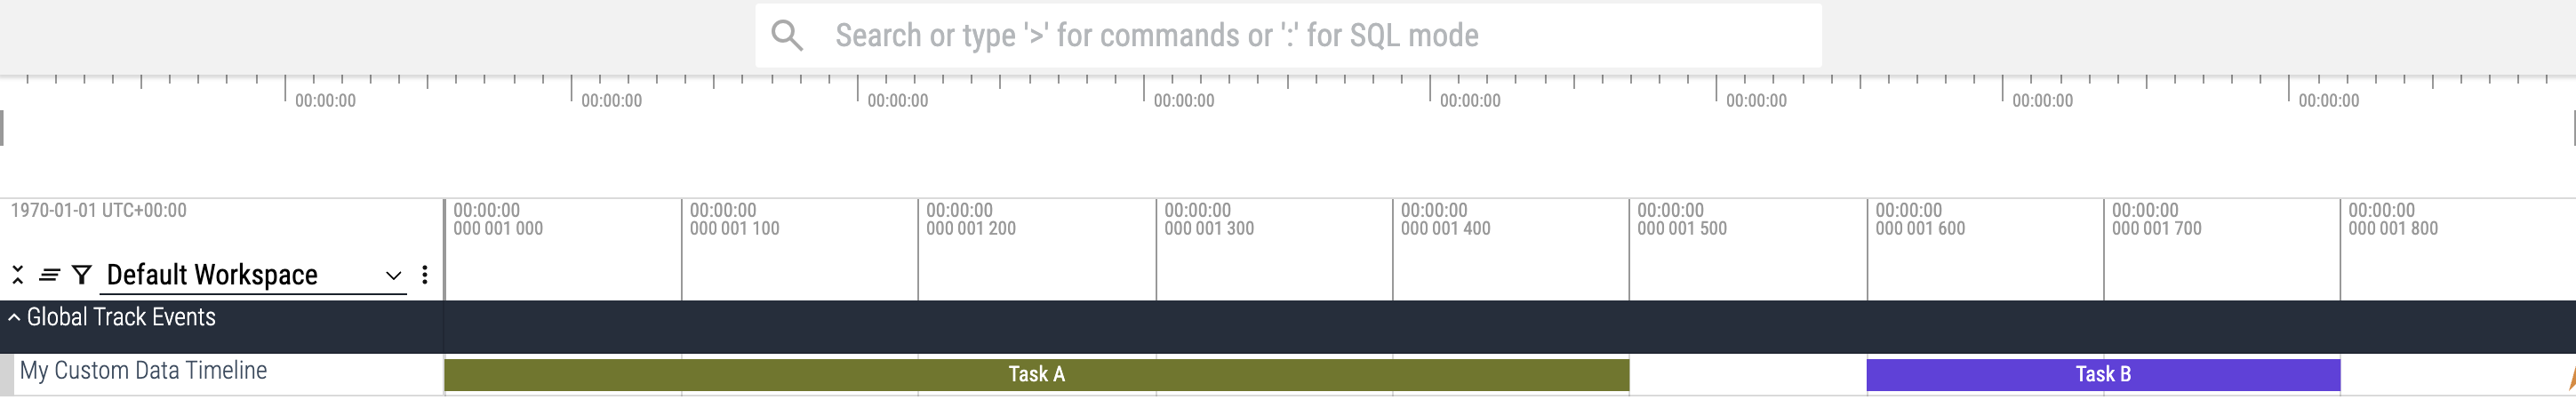
Let's say you have data representing tasks with a name, start time, and end time. Here's how you could convert them into Perfetto slices on a custom track. This first example will show distinct, non-nested slices and a single instant event.
Copy the following Python code into the populate_packets(builder) function in
your trace_converter_template.py script.
Click to expand/collapse Python code
    # Define a unique UUID for your custom track (generate a 64-bit random number)
    CUSTOM_TRACK_UUID = 12345678 # Example UUID

    # 1. Define the Custom Track
    # This packet describes the track on which your events will be displayed.
    # Emit this once at the beginning of your trace.
    packet = builder.add_packet()
    packet.track_descriptor.uuid = CUSTOM_TRACK_UUID
    packet.track_descriptor.name = "My Custom Data Timeline"

    # 2. Emit events for this custom track
    # Example Event 1: "Task A"
    packet = builder.add_packet()
    packet.timestamp = 1000  # Start time in nanoseconds
    packet.track_event.type = TrackEvent.TYPE_SLICE_BEGIN
    packet.track_event.track_uuid = CUSTOM_TRACK_UUID # Associates with the track
    packet.track_event.name = "Task A"
    packet.trusted_packet_sequence_id = TRUSTED_PACKET_SEQUENCE_ID

    packet = builder.add_packet()
    packet.timestamp = 1500  # End time in nanoseconds
    packet.track_event.type = TrackEvent.TYPE_SLICE_END
    packet.track_event.track_uuid = CUSTOM_TRACK_UUID
    packet.trusted_packet_sequence_id = TRUSTED_PACKET_SEQUENCE_ID

    # Example Event 2: "Task B" - a separate, non-nested task occurring later
    packet = builder.add_packet()
    packet.timestamp = 1600  # Start time in nanoseconds
    packet.track_event.type = TrackEvent.TYPE_SLICE_BEGIN
    packet.track_event.track_uuid = CUSTOM_TRACK_UUID
    packet.track_event.name = "Task B"
    packet.trusted_packet_sequence_id = TRUSTED_PACKET_SEQUENCE_ID

    packet = builder.add_packet()
    packet.timestamp = 1800  # End time in nanoseconds
    packet.track_event.type = TrackEvent.TYPE_SLICE_END
    packet.track_event.track_uuid = CUSTOM_TRACK_UUID
    packet.trusted_packet_sequence_id = TRUSTED_PACKET_SEQUENCE_ID

    # Example Event 3: An instantaneous event
    packet = builder.add_packet()
    packet.timestamp = 1900 # Timestamp in nanoseconds
    packet.track_event.type = TrackEvent.TYPE_INSTANT
    packet.track_event.track_uuid = CUSTOM_TRACK_UUID
    packet.track_event.name = "Milestone Y"
    packet.trusted_packet_sequence_id = TRUSTED_PACKET_SEQUENCE_ID
After running the script, opening the generated my_custom_trace.pftrace in the
Perfetto UI will display the following output:
You can query these slices using SQL in the Perfetto UI's Query tab or with Trace Processor:
SELECT ts, dur, name FROM slice
JOIN track ON slice.track_id = track.id
WHERE track.name = 'My Custom Data Timeline';
Nested Slices (Hierarchical Activities)
Often, an activity or operation is made up of several sub-activities that must complete before the main activity can finish. Nested slices are perfect for representing these hierarchical relationships. The key rule is that child slices must start after their parent slice begins and finish before their parent slice ends.
This is very common for:
- Function execution: A function call (parent slice) contains calls to other functions (child slices).
- Structured concurrency: Operations like Kotlin Coroutines, where child coroutines are launched within the scope of a parent coroutine and must complete before the parent.
- Phases of a larger operation: A complex task like "Compiling Module" (parent) might have distinct phases like "Lexical Analysis," "Parsing," "Optimization," and "Code Generation" as nested child slices.
- UI rendering pipelines: A "RenderFrame" slice might encompass "Measure Pass," "Layout Pass," and "Draw Pass" as child slices.
- Request handling with sub-operations: A web server handling a "ProcessHTTPRequest" (parent) might have nested slices for "ParseHeaders," "AuthenticateUser," "FetchDataFromDB," and "RenderResponse."
The Perfetto UI will visually nest these slices, making the hierarchy clear.
Python Example
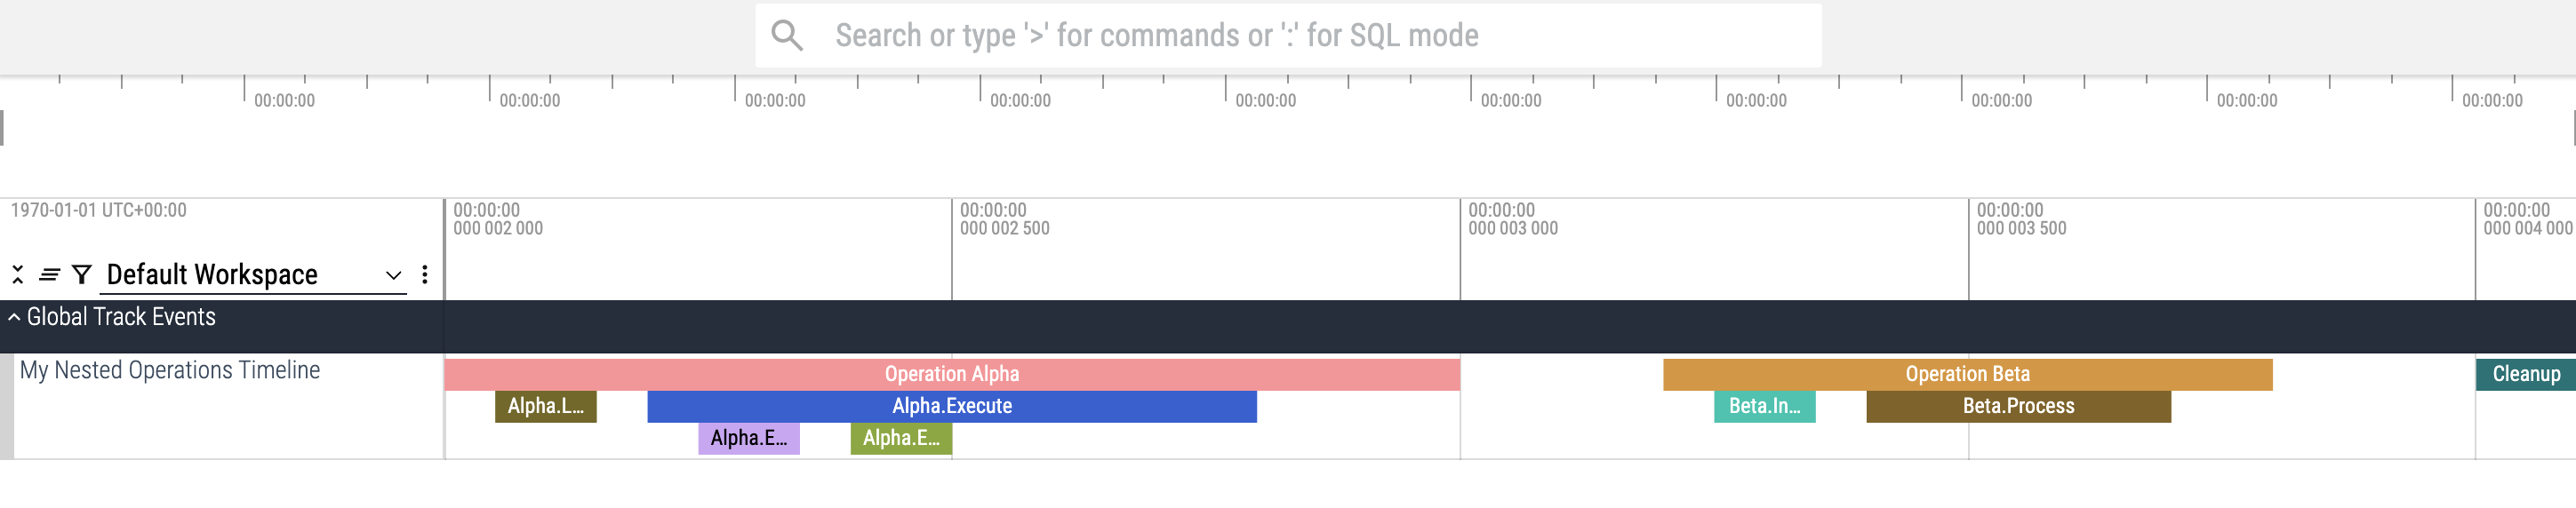
This example demonstrates creating multiple stacks of nested slices on a custom
track. The packets are emitted in timestamp order to correctly represent the
nesting. We'll define a small helper function add_event inside
populate_packets to reduce boilerplate.
Copy the following Python code into the populate_packets(builder) function in
your trace_converter_template.py script.
Click to expand/collapse Python code
    # Define a unique UUID for this example's custom track
    NESTED_SLICE_TRACK_UUID = 987654321 # Example UUID

    # 1. Define the Custom Track for Nested Slices
    # Emit this once at the beginning.
    packet = builder.add_packet()
    packet.track_descriptor.uuid = NESTED_SLICE_TRACK_UUID
    packet.track_descriptor.name = "My Nested Operations Timeline"

    # Helper function to add a TrackEvent packet
    def add_event(ts, event_type, name=None):
        packet = builder.add_packet()
        packet.timestamp = ts
        packet.track_event.type = event_type
        packet.track_event.track_uuid = NESTED_SLICE_TRACK_UUID
        if name:
            packet.track_event.name = name
        packet.trusted_packet_sequence_id = TRUSTED_PACKET_SEQUENCE_ID

    # --- Stack 1: Operation Alpha ---
    add_event(ts=2000, event_type=TrackEvent.TYPE_SLICE_BEGIN, name="Operation Alpha")
    add_event(ts=2050, event_type=TrackEvent.TYPE_SLICE_BEGIN, name="Alpha.LoadConfig")
    add_event(ts=2150, event_type=TrackEvent.TYPE_SLICE_END) # Closes Alpha.LoadConfig
    add_event(ts=2200, event_type=TrackEvent.TYPE_SLICE_BEGIN, name="Alpha.Execute")
    add_event(ts=2250, event_type=TrackEvent.TYPE_SLICE_BEGIN, name="Alpha.Execute.SubX")
    add_event(ts=2350, event_type=TrackEvent.TYPE_SLICE_END) # Closes Alpha.Execute.SubX
    add_event(ts=2400, event_type=TrackEvent.TYPE_SLICE_BEGIN, name="Alpha.Execute.SubY")
    add_event(ts=2500, event_type=TrackEvent.TYPE_SLICE_END) # Closes Alpha.Execute.SubY
    add_event(ts=2800, event_type=TrackEvent.TYPE_SLICE_END) # Closes Alpha.Execute
    add_event(ts=3000, event_type=TrackEvent.TYPE_SLICE_END) # Closes Operation Alpha

    # --- Stack 2: Operation Beta (on the same track) ---
    add_event(ts=3200, event_type=TrackEvent.TYPE_SLICE_BEGIN, name="Operation Beta")
    add_event(ts=3250, event_type=TrackEvent.TYPE_SLICE_BEGIN, name="Beta.Initialize")
    add_event(ts=3350, event_type=TrackEvent.TYPE_SLICE_END) # Closes Beta.Initialize
    add_event(ts=3400, event_type=TrackEvent.TYPE_SLICE_BEGIN, name="Beta.Process")
    add_event(ts=3700, event_type=TrackEvent.TYPE_SLICE_END) # Closes Beta.Process
    add_event(ts=3800, event_type=TrackEvent.TYPE_SLICE_END) # Closes Operation Beta

    # --- An independent slice after all stacks ---
    add_event(ts=4000, event_type=TrackEvent.TYPE_SLICE_BEGIN, name="Cleanup")
    add_event(ts=4100, event_type=TrackEvent.TYPE_SLICE_END) # Closes Cleanup
After running the script, opening the generated my_custom_trace.pftrace in the
Perfetto UI will display the following output:
You can query these nested slices and see their hierarchy using SQL in the Perfetto UI's Query tab or with Trace Processor:
SELECT ts, dur, name, depth FROM slice
JOIN track ON slice.track_id = track.id
WHERE track.name = 'My Nested Operations Timeline'
ORDER BY ts;
Asynchronous Slices and Overlapping Events
Many systems deal with asynchronous operations where multiple activities can be in progress simultaneously and their lifetimes can overlap without strict nesting. Examples include:
- Network Requests: A process might issue multiple network requests concurrently.
- Broadcast Receivers (Android): An application can receive multiple broadcast intents. The handling of each can overlap.
- Wakelocks (Android/Linux): Multiple components can hold wakelocks simultaneously.
- File I/O Operations: A program might initiate several asynchronous read or write operations to different files.
In these scenarios, you cannot represent all these overlapping events on a
single track if you are using begin/end slice semantics, because
TYPE_SLICE_END always closes the most recently opened slice on that specific
track.
The Perfetto way to model this is to assign each concurrent, potentially
overlapping operation to its own unique track (with a unique UUID). To
achieve visual grouping in the Perfetto UI for these related asynchronous
operations, you can give the TrackDescriptor of each of these individual
operation tracks the same name (e.g., "Network Connections" or "File
I/O"). The slices themselves on these tracks can have distinct names (e.g., "GET
/api/data", "Read /config.txt").
The Perfetto UI will group or visually merge tracks that have the same name. This is a convention and can be controlled by the user. For more details, see the section on controlling merging in the synthetic track event reference docs.
Python Example
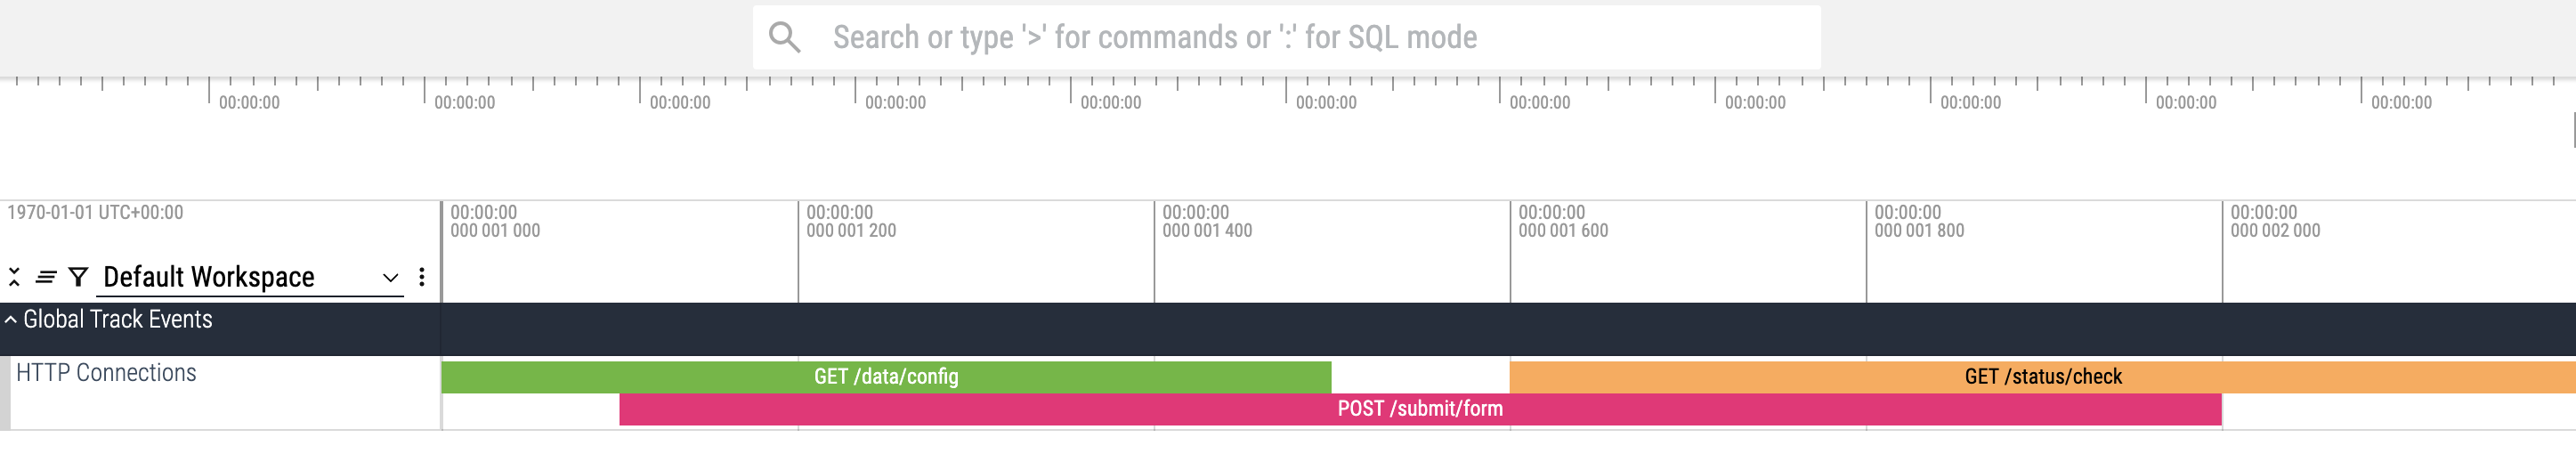
Imagine we are tracking active network connections. Each connection is an independent asynchronous event. We'll give all connection tracks the same name to encourage the UI to group them. We'll use helper functions to define tracks and add events.
Copy the following Python code into the populate_packets(builder) function in
your trace_converter_template.py script:
Click to expand/collapse Python code
    # Common name for all individual connection tracks for UI grouping
    ASYNC_TRACK_GROUP_NAME = "HTTP Connections"

    # Helper to define a new track with a unique UUID
    def define_track(group_name):
        track_uuid = get_uuid()
        packet = builder.add_packet()
        packet.track_descriptor.uuid = track_uuid
        packet.track_descriptor.name = group_name
        return track_uuid

    # Helper to add a begin or end slice event to a specific track
    def add_slice_event(ts, event_type, event_track_uuid, name=None):
        packet = builder.add_packet()
        packet.timestamp = ts
        packet.track_event.type = event_type
        packet.track_event.track_uuid = event_track_uuid
        if name:
            packet.track_event.name = name
        packet.trusted_packet_sequence_id = TRUSTED_PACKET_SEQUENCE_ID

    # --- Network Connection 1 ---
    conn1_track_uuid = define_track(ASYNC_TRACK_GROUP_NAME)
    add_slice_event(ts=1000, event_type=TrackEvent.TYPE_SLICE_BEGIN, event_track_uuid=conn1_track_uuid, name="GET /data/config")
    add_slice_event(ts=1500, event_type=TrackEvent.TYPE_SLICE_END, event_track_uuid=conn1_track_uuid)

    # --- Network Connection 2 (Overlapping with Connection 1) ---
    conn2_track_uuid = define_track(ASYNC_TRACK_GROUP_NAME)
    add_slice_event(ts=1100, event_type=TrackEvent.TYPE_SLICE_BEGIN, event_track_uuid=conn2_track_uuid, name="POST /submit/form")
    add_slice_event(ts=2000, event_type=TrackEvent.TYPE_SLICE_END, event_track_uuid=conn2_track_uuid)

    # --- Network Connection 3 (Starts after 1 ends, overlaps with 2) ---
    conn3_track_uuid = define_track(ASYNC_TRACK_GROUP_NAME)
    add_slice_event(ts=1600, event_type=TrackEvent.TYPE_SLICE_BEGIN, event_track_uuid=conn3_track_uuid, name="GET /status/check")
    add_slice_event(ts=2200, event_type=TrackEvent.TYPE_SLICE_END, event_track_uuid=conn3_track_uuid)
After running the script, opening the generated my_custom_trace.pftrace in the
Perfetto UI will display the following output:
You can query these overlapping slices across all HTTP connection tracks using SQL in the Perfetto UI's Query tab or with Trace Processor:
SELECT ts, dur, name FROM slice
JOIN track ON slice.track_id = track.id
WHERE track.name = 'HTTP Connections'
ORDER BY ts;
Counters (Values Changing Over Time)
Counters are used to represent a numerical value that changes over time. They are excellent for tracking metrics or states that are not event-based but rather reflect a continuous or sampled quantity.
Common examples of what counters can represent include:
- Memory usage: Total memory consumed by a process, or specific memory pools.
- CPU frequency: The current operating frequency of a CPU core.
- Queue sizes: The number of outstanding requests in a network queue or tasks in a work queue.
- Battery percentage: The remaining battery charge.
- Resource limits: The current value of a resource like file descriptors or network bandwidth being utilized.
To create a counter track, you'll:
- Define a
TrackDescriptorfor your counter. This track needs auuid, aname, and importantly, itscounterfield should be populated. This tells Perfetto to treat this track as a counter. - Emit
TrackEventpackets withtype: TYPE_COUNTER. Each such packet should have atimestampand acounter_value(which can be an integer or a double).
Python Example
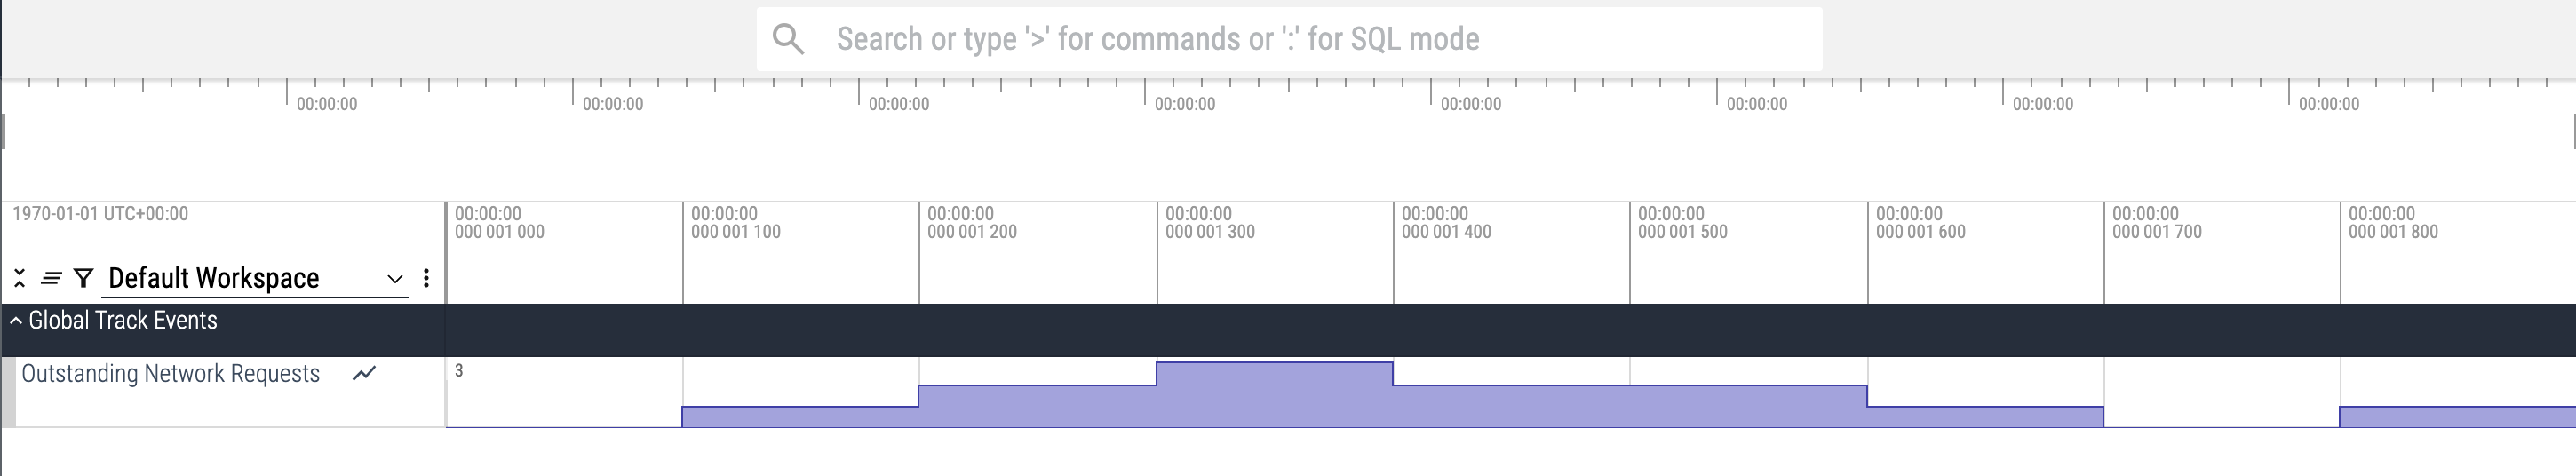
Let's say we want to track the number of outstanding network requests over time.
Copy the following Python code into the populate_packets(builder) function in
your trace_converter_template.py script.
Click to expand/collapse Python code
    # UUID for the counter track
    OUTSTANDING_REQUESTS_TRACK_UUID = get_uuid()

    # 1. Define the Counter Track
    packet = builder.add_packet()
    track_desc = packet.track_descriptor
    track_desc.uuid = OUTSTANDING_REQUESTS_TRACK_UUID
    track_desc.name = "Outstanding Network Requests"
    # To mark this as a counter track, set the 'counter' field as existing.
    track_desc.counter.SetInParent()

    # Helper to add a counter event
    def add_counter_event(ts, value):
        packet = builder.add_packet()
        packet.timestamp = ts
        packet.track_event.type = TrackEvent.TYPE_COUNTER
        packet.track_event.track_uuid = OUTSTANDING_REQUESTS_TRACK_UUID
        packet.track_event.counter_value = value
        packet.trusted_packet_sequence_id = TRUSTED_PACKET_SEQUENCE_ID

    # 2. Emit counter values over time
    add_counter_event(ts=1000, value=0)
    add_counter_event(ts=1100, value=1) # One request starts
    add_counter_event(ts=1200, value=2) # Second request starts
    add_counter_event(ts=1300, value=3) # Third request starts
    add_counter_event(ts=1400, value=2) # First request finishes
    add_counter_event(ts=1500, value=2) # No change
    add_counter_event(ts=1600, value=1) # Second request finishes
    add_counter_event(ts=1700, value=0) # Third request finishes
    add_counter_event(ts=1800, value=1) # New request starts
    add_counter_event(ts=1900, value=0) # Last request finishes
After running the script, opening the generated my_custom_trace.pftrace in the
Perfetto UI will display the following output:
You can query the counter values using SQL in the Perfetto UI's Query tab or with Trace Processor:
SELECT ts, value FROM counter
JOIN track ON counter.track_id = track.id
WHERE track.name = 'Outstanding Network Requests';
Flows (Connecting Causally Related Events)
Flows are used to visually connect slices that have an explicit causal or dependency relationship, especially when these slices occur on different tracks (like different threads or even different processes). They are crucial for understanding how an action in one part of a system triggers or enables an action in another.
Think of flows as drawing an arrow from a "cause" or "dispatch" event to an "effect" or "handling" event. Common scenarios include:
- A UI thread dispatches a task to a worker thread: a flow connects the dispatch slice to the execution slice on the worker.
- A service makes an RPC/IPC call to another service: a flow can link the client-side call initiation to the server-side request handling.
- An event is posted to a message queue and later processed: a flow can show the link from posting to processing.
In Perfetto's TrackEvent model, you establish a flow by:
- Assigning one or more unique 64-bit
flow_ids to theTrackEvents that are part of the flow. This ID acts as the link. - Typically, a
flow_idis added to aTYPE_SLICE_BEGINorTYPE_SLICE_ENDevent to mark the origin or termination of a causal link from/to that slice. - The same
flow_idis then added to anotherTrackEvent(often aTYPE_SLICE_BEGINon a different track) to show the continuation or handling of that causally linked operation.
The Perfetto UI will draw arrows connecting the slices that share a common
flow_id, making the dependency chain explicit.
Alternative: Correlation IDs For events that are part of the same logical operation but not causally connected, consider using correlation IDs instead of or in addition to flows. Correlation IDs group related events visually (e.g., with consistent colors) without implying causality. See the Linking Related Events with Correlation IDs section in the Advanced Guide for details.
Python Example
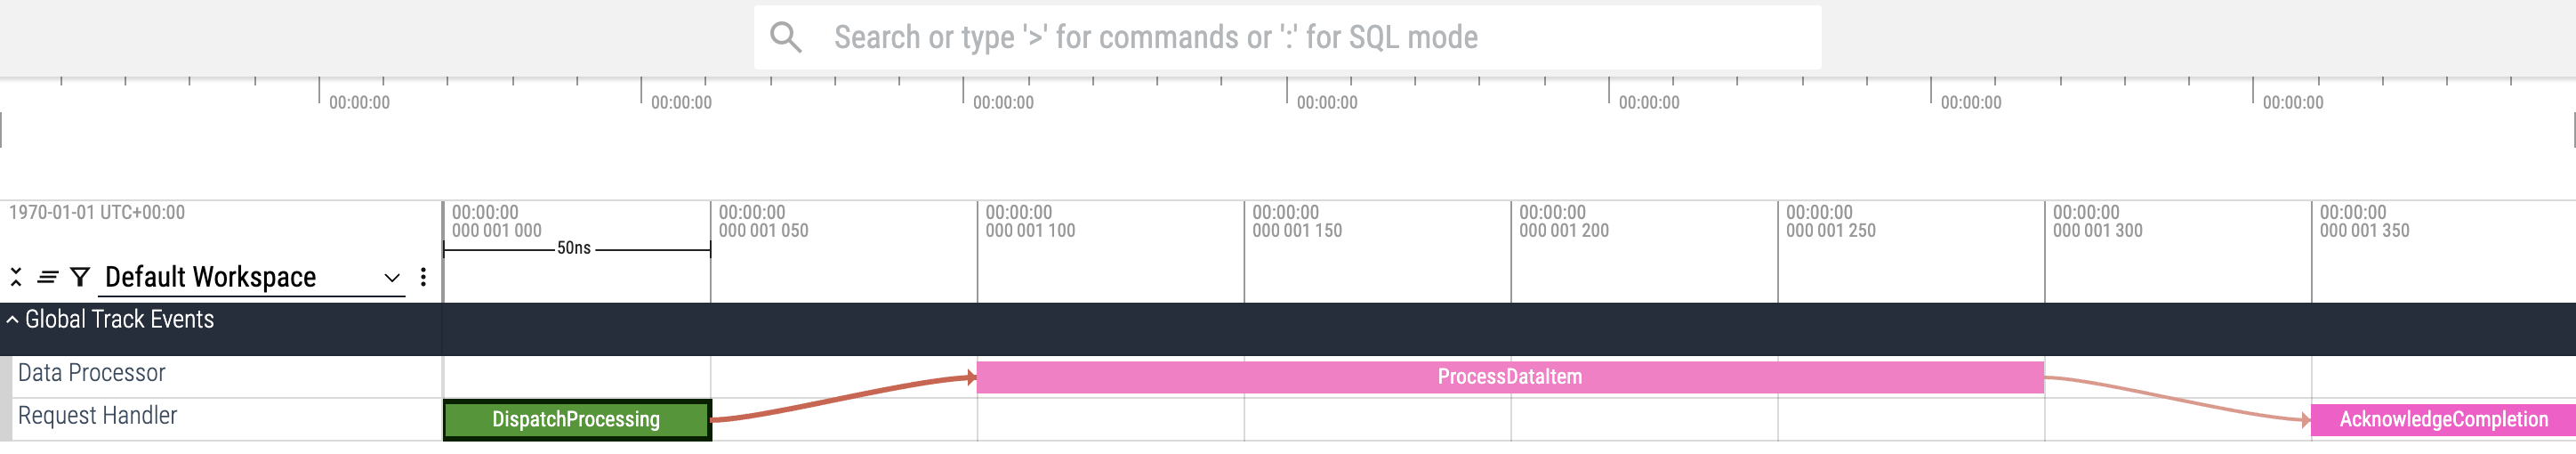
Let's model a simple system where a "Request Handler" track dispatches work to a "Data Processor" track. We'll use flows to link the request dispatch to its processing, and then link the processing completion back to the handler acknowledging completion.
Copy the following Python code into the populate_packets(builder) function in
your trace_converter_template.py script.
Click to expand/collapse Python code
    # --- Define Custom Tracks ---
    REQUEST_HANDLER_TRACK_UUID = get_uuid()
    DATA_PROCESSOR_TRACK_UUID = get_uuid()

    # Request Handler Track
    packet = builder.add_packet()
    packet.track_descriptor.uuid = REQUEST_HANDLER_TRACK_UUID
    packet.track_descriptor.name = "Request Handler"

    # Data Processor Track
    packet = builder.add_packet()
    packet.track_descriptor.uuid = DATA_PROCESSOR_TRACK_UUID
    packet.track_descriptor.name = "Data Processor"

    # Helper to add a slice event (BEGIN or END)
    def add_slice_event(ts, event_type, event_track_uuid, name=None, flow_ids=None):
        packet = builder.add_packet()
        packet.timestamp = ts
        packet.track_event.type = event_type
        packet.track_event.track_uuid = event_track_uuid
        if name:
            packet.track_event.name = name
        if flow_ids:
            for flow_id in flow_ids:
                packet.track_event.flow_ids.append(flow_id)
        packet.trusted_packet_sequence_id = TRUSTED_PACKET_SEQUENCE_ID

    # --- Define unique flow IDs for the causal links ---
    DISPATCH_TO_PROCESS_FLOW_ID = get_uuid()
    PROCESS_COMPLETION_FLOW_ID = get_uuid()

    # 1. Request Handler: Dispatch data processing (origin of the first flow)
    add_slice_event(ts=1000, event_type=TrackEvent.TYPE_SLICE_BEGIN,
                    event_track_uuid=REQUEST_HANDLER_TRACK_UUID, name="DispatchProcessing",
                    flow_ids=[DISPATCH_TO_PROCESS_FLOW_ID])
    add_slice_event(ts=1050, event_type=TrackEvent.TYPE_SLICE_END,
                    event_track_uuid=REQUEST_HANDLER_TRACK_UUID)

    # 2. Data Processor: Process the data (flow from handler's dispatch)
    # This slice's BEGIN event includes DISPATCH_TO_PROCESS_FLOW_ID, linking it.
    # It also starts the PROCESS_COMPLETION_FLOW_ID from its BEGIN event.
    add_slice_event(ts=1100, event_type=TrackEvent.TYPE_SLICE_BEGIN,
                    event_track_uuid=DATA_PROCESSOR_TRACK_UUID, name="ProcessDataItem",
                    flow_ids=[DISPATCH_TO_PROCESS_FLOW_ID, PROCESS_COMPLETION_FLOW_ID])
    add_slice_event(ts=1300, event_type=TrackEvent.TYPE_SLICE_END,
                    event_track_uuid=DATA_PROCESSOR_TRACK_UUID)

    # 3. Request Handler: Acknowledge completion (PROCESS_COMPLETION_FLOW_ID terminates here)
    add_slice_event(ts=1350, event_type=TrackEvent.TYPE_SLICE_BEGIN,
                    event_track_uuid=REQUEST_HANDLER_TRACK_UUID, name="AcknowledgeCompletion",
                    flow_ids=[PROCESS_COMPLETION_FLOW_ID])
    add_slice_event(ts=1400, event_type=TrackEvent.TYPE_SLICE_END,
                    event_track_uuid=REQUEST_HANDLER_TRACK_UUID)
After running the script, opening the generated my_custom_trace.pftrace in the
Perfetto UI will display the following output:
You can query flow connections between slices using SQL in the Perfetto UI's Query tab or with Trace Processor:
SELECT slice_out.name AS source_slice, slice_in.name AS dest_slice
FROM flow
JOIN slice AS slice_out ON flow.slice_out = slice_out.id
JOIN slice AS slice_in ON flow.slice_in = slice_in.id;
Grouping Tracks with Hierarchies
As traces become more complex, you might want to group related tracks together
to create a more organized and understandable visualization. Perfetto allows you
to define a parent-child relationship between tracks using the parent_uuid
field in the TrackDescriptor.
This is useful when:
- You have a high-level component (parent track) that comprises several sub-components (child tracks), and you want to see them grouped in the UI.
- You want to create logical groupings for different types of asynchronous events or different sets of counters.
- You are representing a system with inherent hierarchical structures (e.g., a machine with multiple GPUs, each GPU having multiple engines).
A parent track can serve two main purposes:
- Pure Grouping: The parent track itself might not have any direct events (slices or counters) but acts solely as a container to group its child tracks in the UI.
- Summary Track: The parent track can also have its own slices or counters. These could represent an overview or a summary of the activity detailed in its child tracks, or an independent set of events related to the parent itself.
The Perfetto UI will typically render these as an expandable tree.
Python Example
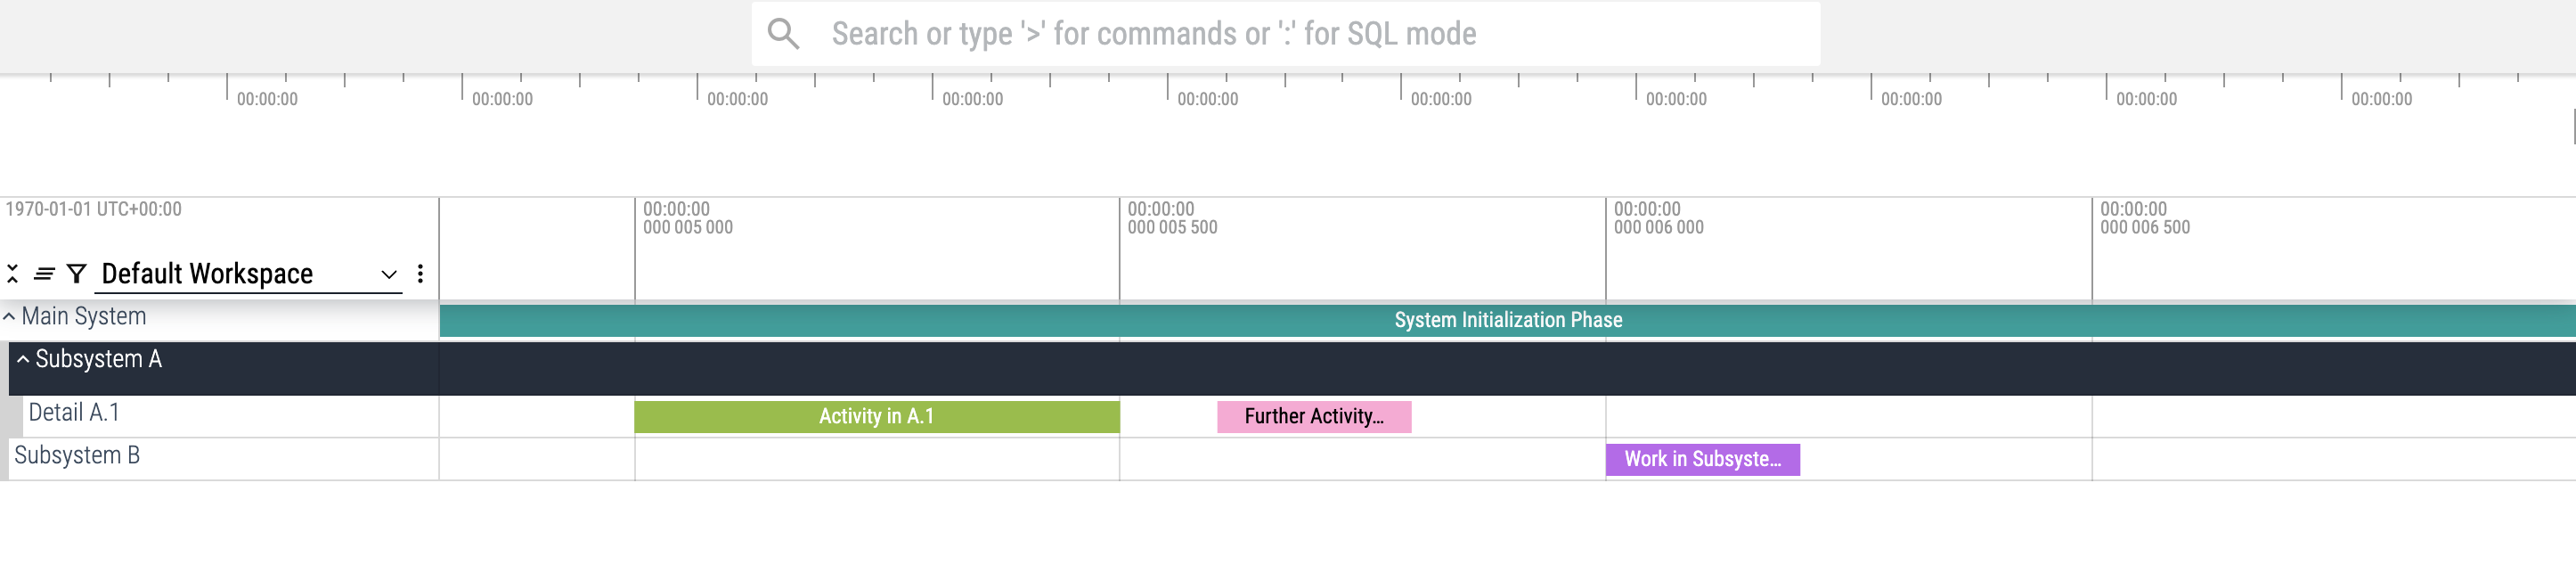
Let's create a hierarchy:
- A "Main System" track, which will also have its own summary slice.
- Two child tracks of "Main System": "Subsystem A" and "Subsystem B".
- "Subsystem A" will further have its own child track, "Detail A.1".
- We'll then place slices on the parent "Main System" track, "Subsystem B", and on the deepest child track "Detail A.1".
Copy the following Python code into the populate_packets(builder) function in
your trace_converter_template.py script.
Click to expand/collapse Python code
    # --- Define Track UUIDs ---
    main_system_track_uuid = get_uuid()
    subsystem_a_track_uuid = get_uuid()
    subsystem_b_track_uuid = get_uuid()
    detail_a1_track_uuid = get_uuid()

    # Helper to define a TrackDescriptor
    def define_custom_track(track_uuid, name, parent_track_uuid=None):
        packet = builder.add_packet()
        desc = packet.track_descriptor
        desc.uuid = track_uuid
        desc.name = name
        if parent_track_uuid:
            desc.parent_uuid = parent_track_uuid

    # Helper to add a slice event
    def add_slice_event(ts, event_type, event_track_uuid, name=None):
        packet = builder.add_packet()
        packet.timestamp = ts
        packet.track_event.type = event_type
        packet.track_event.track_uuid = event_track_uuid
        if name:
            packet.track_event.name = name
        packet.trusted_packet_sequence_id = TRUSTED_PACKET_SEQUENCE_ID

    # 1. Define the Track Hierarchy
    define_custom_track(main_system_track_uuid, "Main System")
    define_custom_track(subsystem_a_track_uuid, "Subsystem A", parent_track_uuid=main_system_track_uuid)
    define_custom_track(subsystem_b_track_uuid, "Subsystem B", parent_track_uuid=main_system_track_uuid)
    define_custom_track(detail_a1_track_uuid, "Detail A.1", parent_track_uuid=subsystem_a_track_uuid)

    # 2. Emit slices on various tracks in the hierarchy

    # Slice on the parent "Main System" track (summary/overall activity)
    add_slice_event(ts=4800, event_type=TrackEvent.TYPE_SLICE_BEGIN,
                    event_track_uuid=main_system_track_uuid, name="System Initialization Phase")
    add_slice_event(ts=7000, event_type=TrackEvent.TYPE_SLICE_END,
                    event_track_uuid=main_system_track_uuid)

    # Slice on "Detail A.1" (child of "Subsystem A")
    add_slice_event(ts=5000, event_type=TrackEvent.TYPE_SLICE_BEGIN,
                    event_track_uuid=detail_a1_track_uuid, name="Activity in A.1")
    add_slice_event(ts=5500, event_type=TrackEvent.TYPE_SLICE_END,
                    event_track_uuid=detail_a1_track_uuid)

    # Slice on "Subsystem B"
    add_slice_event(ts=6000, event_type=TrackEvent.TYPE_SLICE_BEGIN,
                    event_track_uuid=subsystem_b_track_uuid, name="Work in Subsystem B")
    add_slice_event(ts=6200, event_type=TrackEvent.TYPE_SLICE_END,
                    event_track_uuid=subsystem_b_track_uuid)

    # Another slice on "Detail A.1"
    add_slice_event(ts=5600, event_type=TrackEvent.TYPE_SLICE_BEGIN,
                    event_track_uuid=detail_a1_track_uuid, name="Further Activity in A.1")
    add_slice_event(ts=5800, event_type=TrackEvent.TYPE_SLICE_END,
                    event_track_uuid=detail_a1_track_uuid)
After running the script, opening the generated my_custom_trace.pftrace in the
Perfetto UI will display the following output:
You can query slices across the track hierarchy using SQL in the Perfetto UI's Query tab or with Trace Processor:
SELECT slice.ts, slice.dur, slice.name, track.name AS track_name
FROM slice
JOIN track ON slice.track_id = track.id
WHERE track.name IN ('Main System', 'Subsystem A', 'Subsystem B', 'Detail A.1')
ORDER BY slice.ts;
Track Hierarchies for Waterfall / Trace Views
Another powerful use of track hierarchies is to visualize the breakdown of a complex operation or request, similar to how "trace views" or "span views" are displayed in distributed tracing systems. This is useful when an operation involves sequential or parallel steps, potentially across different logical components, and you want to see the timing and relationship of these steps in a waterfall or Gantt-like chart.
In this model:
- A root track represents the entire end-to-end request or operation.
- Each major step, function call, or RPC call within that operation is represented as a child track parented under the root track (or under another step if it's a sub-sub-step).
- A slice on each child track shows the duration of that specific step.
- The
parent_uuidfield creates the hierarchy. The UI will then typically render these as an expandable tree, and the start/end times of the slices on these hierarchically arranged tracks create the "waterfall" effect.
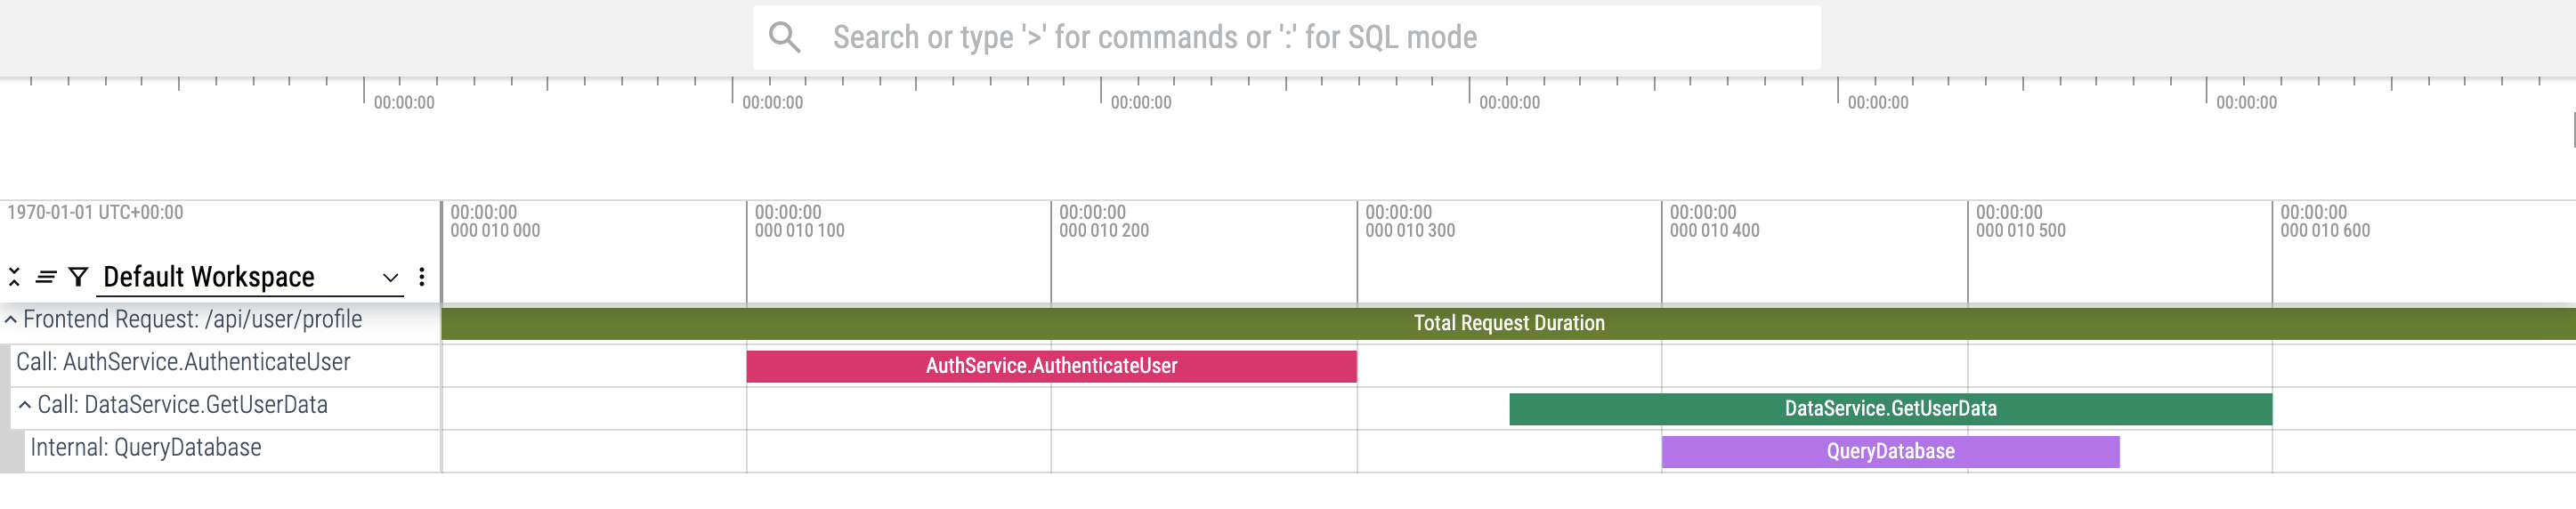
Python Example: Service Request Breakdown
Let's imagine a frontend service makes a request that involves calls to two backend services: an Authentication Service and a Data Service. The Data Service call can only happen after the Authentication Service call completes.
Copy the following Python code into the populate_packets(builder) function in
your trace_converter_template.py script.
Click to expand/collapse Python code
    # --- Define Track UUIDs ---
    root_request_track_uuid = get_uuid()
    auth_service_call_track_uuid = get_uuid()
    data_service_call_track_uuid = get_uuid()
    # UUID for an internal step within data_service_call
    data_service_internal_step_track_uuid = get_uuid()

    # Helper to define a TrackDescriptor
    def define_custom_track(track_uuid, name, parent_track_uuid=None):
        packet = builder.add_packet()
        desc = packet.track_descriptor
        desc.uuid = track_uuid
        desc.name = name
        if parent_track_uuid:
            desc.parent_uuid = parent_track_uuid

    # Helper to add a slice event
    def add_slice_event(ts, event_type, event_track_uuid, name=None):
        packet = builder.add_packet()
        packet.timestamp = ts
        packet.track_event.type = event_type
        packet.track_event.track_uuid = event_track_uuid
        if name:
            packet.track_event.name = name
        packet.trusted_packet_sequence_id = TRUSTED_PACKET_SEQUENCE_ID

    # 1. Define the Root Track for the overall request
    define_custom_track(root_request_track_uuid, "Frontend Request: /api/user/profile")

    # Add a slice for the total duration of the frontend request on its own track
    add_slice_event(ts=10000, event_type=TrackEvent.TYPE_SLICE_BEGIN,
                    event_track_uuid=root_request_track_uuid, name="Total Request Duration")

    # 2. Define child tracks for each service call (span) as children of the root request
    define_custom_track(auth_service_call_track_uuid, "Call: AuthService.AuthenticateUser",
                        parent_track_uuid=root_request_track_uuid)
    define_custom_track(data_service_call_track_uuid, "Call: DataService.GetUserData",
                        parent_track_uuid=root_request_track_uuid)

    # 3. Emit slices on these service call tracks
    # Auth Service Call
    add_slice_event(ts=10100, event_type=TrackEvent.TYPE_SLICE_BEGIN,
                    event_track_uuid=auth_service_call_track_uuid, name="AuthService.AuthenticateUser")
    add_slice_event(ts=10300, event_type=TrackEvent.TYPE_SLICE_END,
                    event_track_uuid=auth_service_call_track_uuid)

    # Data Service Call (starts after Auth completes)
    add_slice_event(ts=10350, event_type=TrackEvent.TYPE_SLICE_BEGIN,
                    event_track_uuid=data_service_call_track_uuid, name="DataService.GetUserData")

    # Simulate an internal step within DataService.GetUserData, shown on its own sub-track
    # This track will be a child of the "Call: DataService.GetUserData" track.
    define_custom_track(data_service_internal_step_track_uuid, "Internal: QueryDatabase",
                        parent_track_uuid=data_service_call_track_uuid)

    add_slice_event(ts=10400, event_type=TrackEvent.TYPE_SLICE_BEGIN,
                    event_track_uuid=data_service_internal_step_track_uuid, name="QueryDatabase")
    add_slice_event(ts=10550, event_type=TrackEvent.TYPE_SLICE_END,
                    event_track_uuid=data_service_internal_step_track_uuid)

    add_slice_event(ts=10600, event_type=TrackEvent.TYPE_SLICE_END, # End of DataService.GetUserData
                    event_track_uuid=data_service_call_track_uuid)

    # End of the total frontend request
    add_slice_event(ts=10700, event_type=TrackEvent.TYPE_SLICE_END,
                    event_track_uuid=root_request_track_uuid)
After running the script, opening the generated my_custom_trace.pftrace in the
Perfetto UI will display the following output:
You can query this request breakdown to analyze timing using SQL in the Perfetto UI's Query tab or with Trace Processor:
SELECT slice.ts, slice.dur, slice.name, track.name AS service
FROM slice
JOIN track ON slice.track_id = track.id
WHERE track.name LIKE '%Request%' OR track.name LIKE '%Service%'
ORDER BY slice.ts;
Adding Debug Annotations to Events
Debug annotations allow you to attach arbitrary key-value data to any
TrackEvent. They appear in the Perfetto UI when you inspect individual
events, making them useful for providing additional context about what was
happening during specific slices or instants.
Debug annotations are useful for:
- Adding object IDs, request IDs, or other identifiers
- Including configuration values or state information
- Attaching error messages or status codes
- Providing structured data like arrays or nested objects
- Any contextual data that enriches your trace events
Debug annotations support various data types including basic values (strings,
integers, booleans, doubles), nested dictionaries, and arrays. They use the
DebugAnnotation protobuf message, which can represent complex nested
structures.
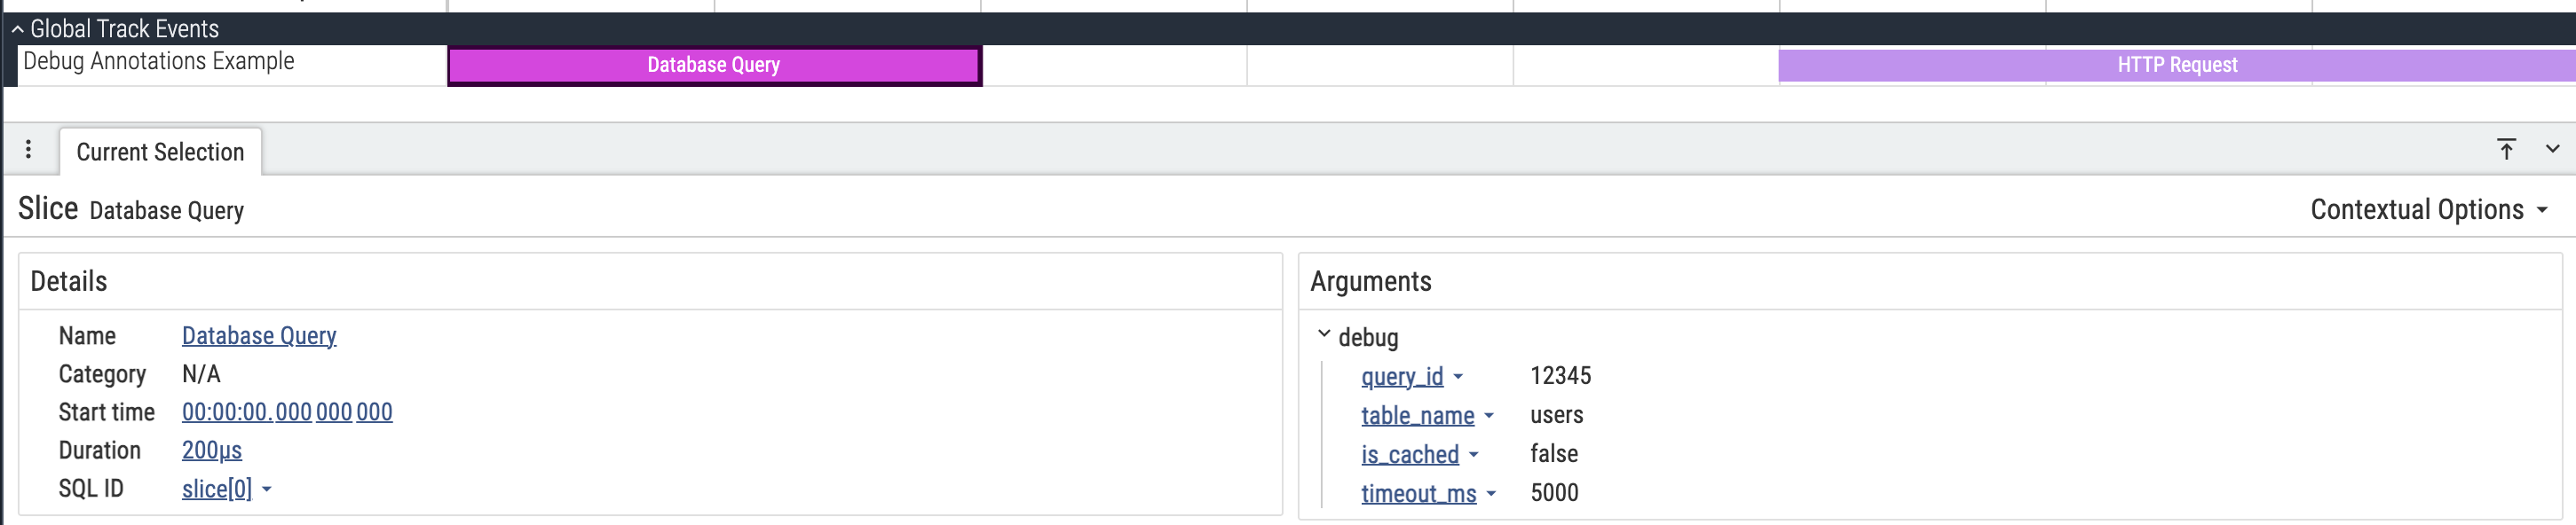
Python Example: Basic Debug Annotations
This example shows how to add simple key-value debug annotations to track events. This is useful for attaching additional information like object IDs, state values, or other contextual data.
Copy the following Python code into the populate_packets(builder) function in
your trace_converter_template.py script.
Click to expand/collapse Python code
    # Define a unique UUID for your custom track
    DEBUG_TRACK_UUID = 87654321

    # 1. Define the Custom Track
    packet = builder.add_packet()
    packet.track_descriptor.uuid = DEBUG_TRACK_UUID
    packet.track_descriptor.name = "Debug Annotations Example"

    # Helper to add a slice event with debug annotations
    def add_slice_with_debug_annotations(ts, event_type, name=None, debug_annotations=None):
        packet = builder.add_packet()
        packet.timestamp = ts
        packet.track_event.type = event_type
        packet.track_event.track_uuid = DEBUG_TRACK_UUID
        if name:
            packet.track_event.name = name

        # Add debug annotations
        if debug_annotations:
            for key, value in debug_annotations.items():
                annotation = packet.track_event.debug_annotations.add()
                annotation.name = key

                # Set the appropriate value field based on type
                if isinstance(value, bool):
                    annotation.bool_value = value
                elif isinstance(value, int):
                    annotation.int_value = value
                elif isinstance(value, float):
                    annotation.double_value = value
                elif isinstance(value, str):
                    annotation.string_value = value

        packet.trusted_packet_sequence_id = TRUSTED_PACKET_SEQUENCE_ID

    # 2. Create slices with various debug annotations
    add_slice_with_debug_annotations(
        ts=1000,
        event_type=TrackEvent.TYPE_SLICE_BEGIN,
        name="Database Query",
        debug_annotations={
            "query_id": 12345,
            "table_name": "users",
            "is_cached": False,
            "timeout_ms": 5000.0
        }
    )

    add_slice_with_debug_annotations(
        ts=1200,
        event_type=TrackEvent.TYPE_SLICE_END
    )

    # Another example with different annotation types
    add_slice_with_debug_annotations(
        ts=1500,
        event_type=TrackEvent.TYPE_SLICE_BEGIN,
        name="HTTP Request",
        debug_annotations={
            "method": "POST",
            "url": "/api/users/create",
            "content_length": 2048,
            "keep_alive": True
        }
    )

    add_slice_with_debug_annotations(
        ts=1800,
        event_type=TrackEvent.TYPE_SLICE_END
    )
After running the script, opening the generated my_custom_trace.pftrace in the
Perfetto UI will display the following output:
You can query debug annotations using SQL in the Perfetto UI's Query tab or with Trace Processor:
SELECT slice.name, EXTRACT_ARG(slice.arg_set_id, 'debug.query_id') AS query_id
FROM slice
JOIN track ON slice.track_id = track.id
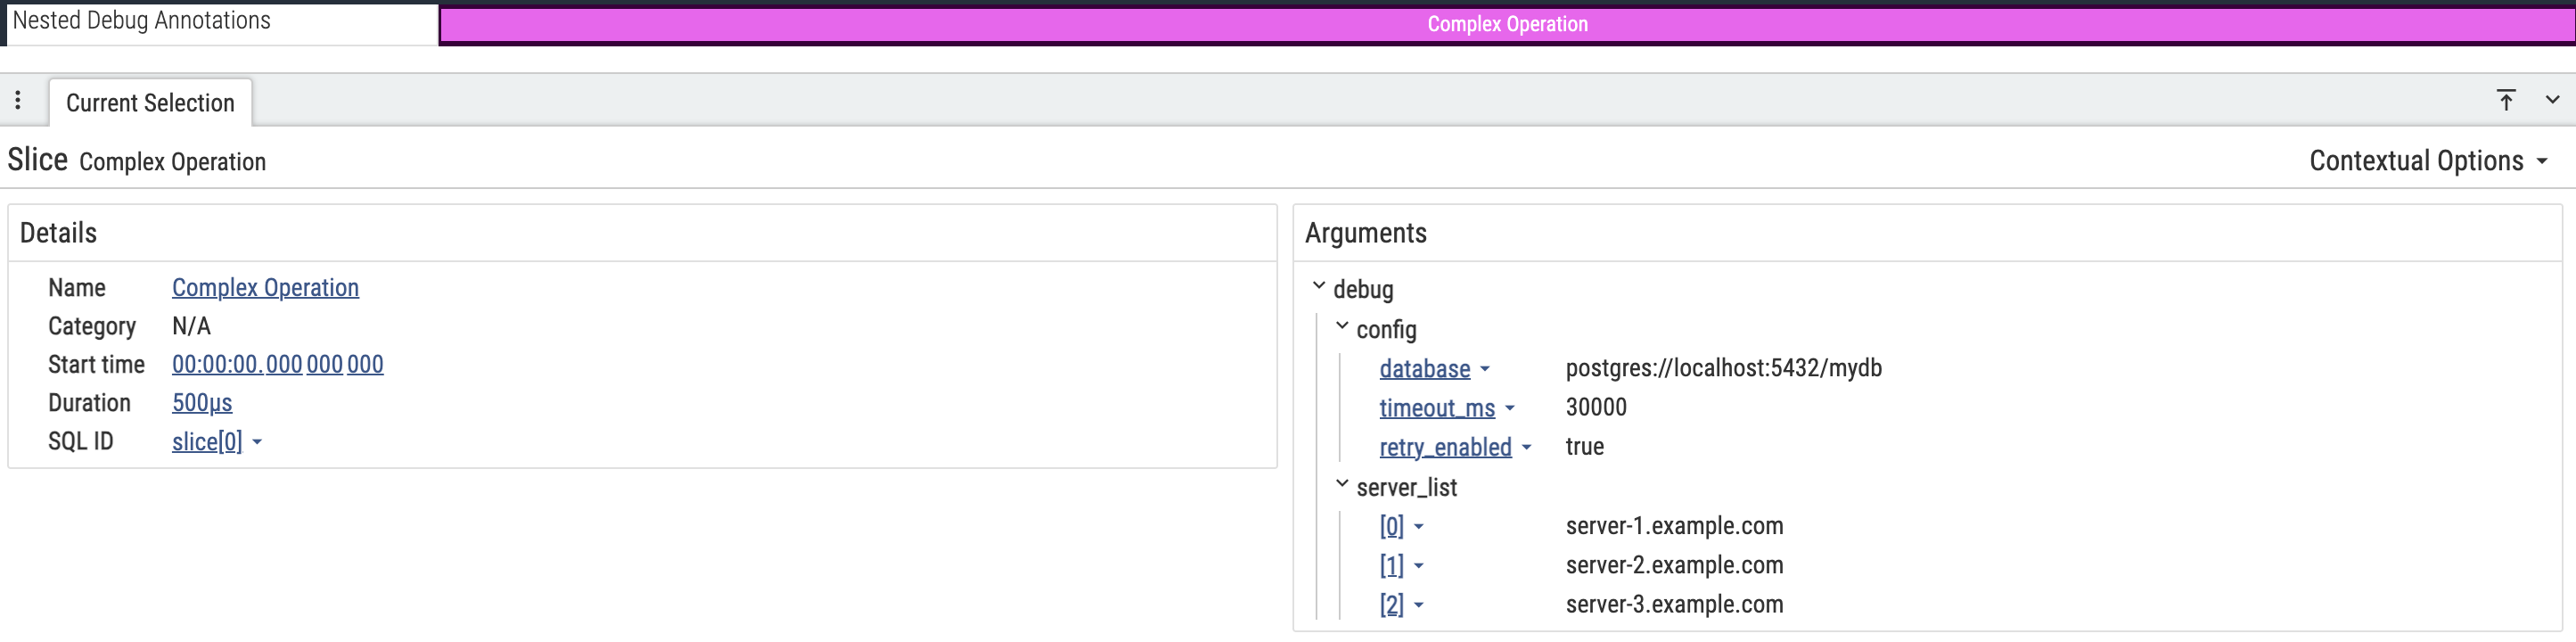
WHERE track.name = 'Debug Annotations Example';Python Example: Nested Debug Annotations
Debug annotations can represent complex nested data structures including dictionaries and arrays. This is useful when you need to attach structured information like configuration objects, arrays of values, or hierarchical data.
Copy the following Python code into the populate_packets(builder) function in
your trace_converter_template.py script.
Click to expand/collapse Python code
    # Define a unique UUID for your custom track
    NESTED_DEBUG_TRACK_UUID = 87654322

    # 1. Define the Custom Track
    packet = builder.add_packet()
    packet.track_descriptor.uuid = NESTED_DEBUG_TRACK_UUID
    packet.track_descriptor.name = "Nested Debug Annotations"

    # 2. Create a slice with nested debug annotations
    packet = builder.add_packet()
    packet.timestamp = 2000
    packet.track_event.type = TrackEvent.TYPE_SLICE_BEGIN
    packet.track_event.track_uuid = NESTED_DEBUG_TRACK_UUID
    packet.track_event.name = "Complex Operation"

    # Add a dictionary annotation with nested structure
    config_annotation = packet.track_event.debug_annotations.add()
    config_annotation.name = "config"

    # Add dictionary entries
    db_entry = config_annotation.dict_entries.add()
    db_entry.name = "database"
    db_entry.string_value = "postgres://localhost:5432/mydb"

    timeout_entry = config_annotation.dict_entries.add()
    timeout_entry.name = "timeout_ms"
    timeout_entry.int_value = 30000

    retry_entry = config_annotation.dict_entries.add()
    retry_entry.name = "retry_enabled"
    retry_entry.bool_value = True

    # Add an array annotation
    servers_annotation = packet.track_event.debug_annotations.add()
    servers_annotation.name = "server_list"

    # Add array values
    server1 = servers_annotation.array_values.add()
    server1.string_value = "server-1.example.com"

    server2 = servers_annotation.array_values.add()
    server2.string_value = "server-2.example.com"

    server3 = servers_annotation.array_values.add()
    server3.string_value = "server-3.example.com"

    packet.trusted_packet_sequence_id = TRUSTED_PACKET_SEQUENCE_ID

    # End the slice
    packet = builder.add_packet()
    packet.timestamp = 2500
    packet.track_event.type = TrackEvent.TYPE_SLICE_END
    packet.track_event.track_uuid = NESTED_DEBUG_TRACK_UUID
    packet.trusted_packet_sequence_id = TRUSTED_PACKET_SEQUENCE_ID
After running the script, opening the generated my_custom_trace.pftrace in the
Perfetto UI will display the following output:
You can query nested debug annotations using SQL in the Perfetto UI's Query tab or with Trace Processor:
SELECT slice.name,
EXTRACT_ARG(slice.arg_set_id, 'debug.config.database') AS database,
EXTRACT_ARG(slice.arg_set_id, 'debug.server_list[0]') AS first_server
FROM slice
JOIN track ON slice.track_id = track.id
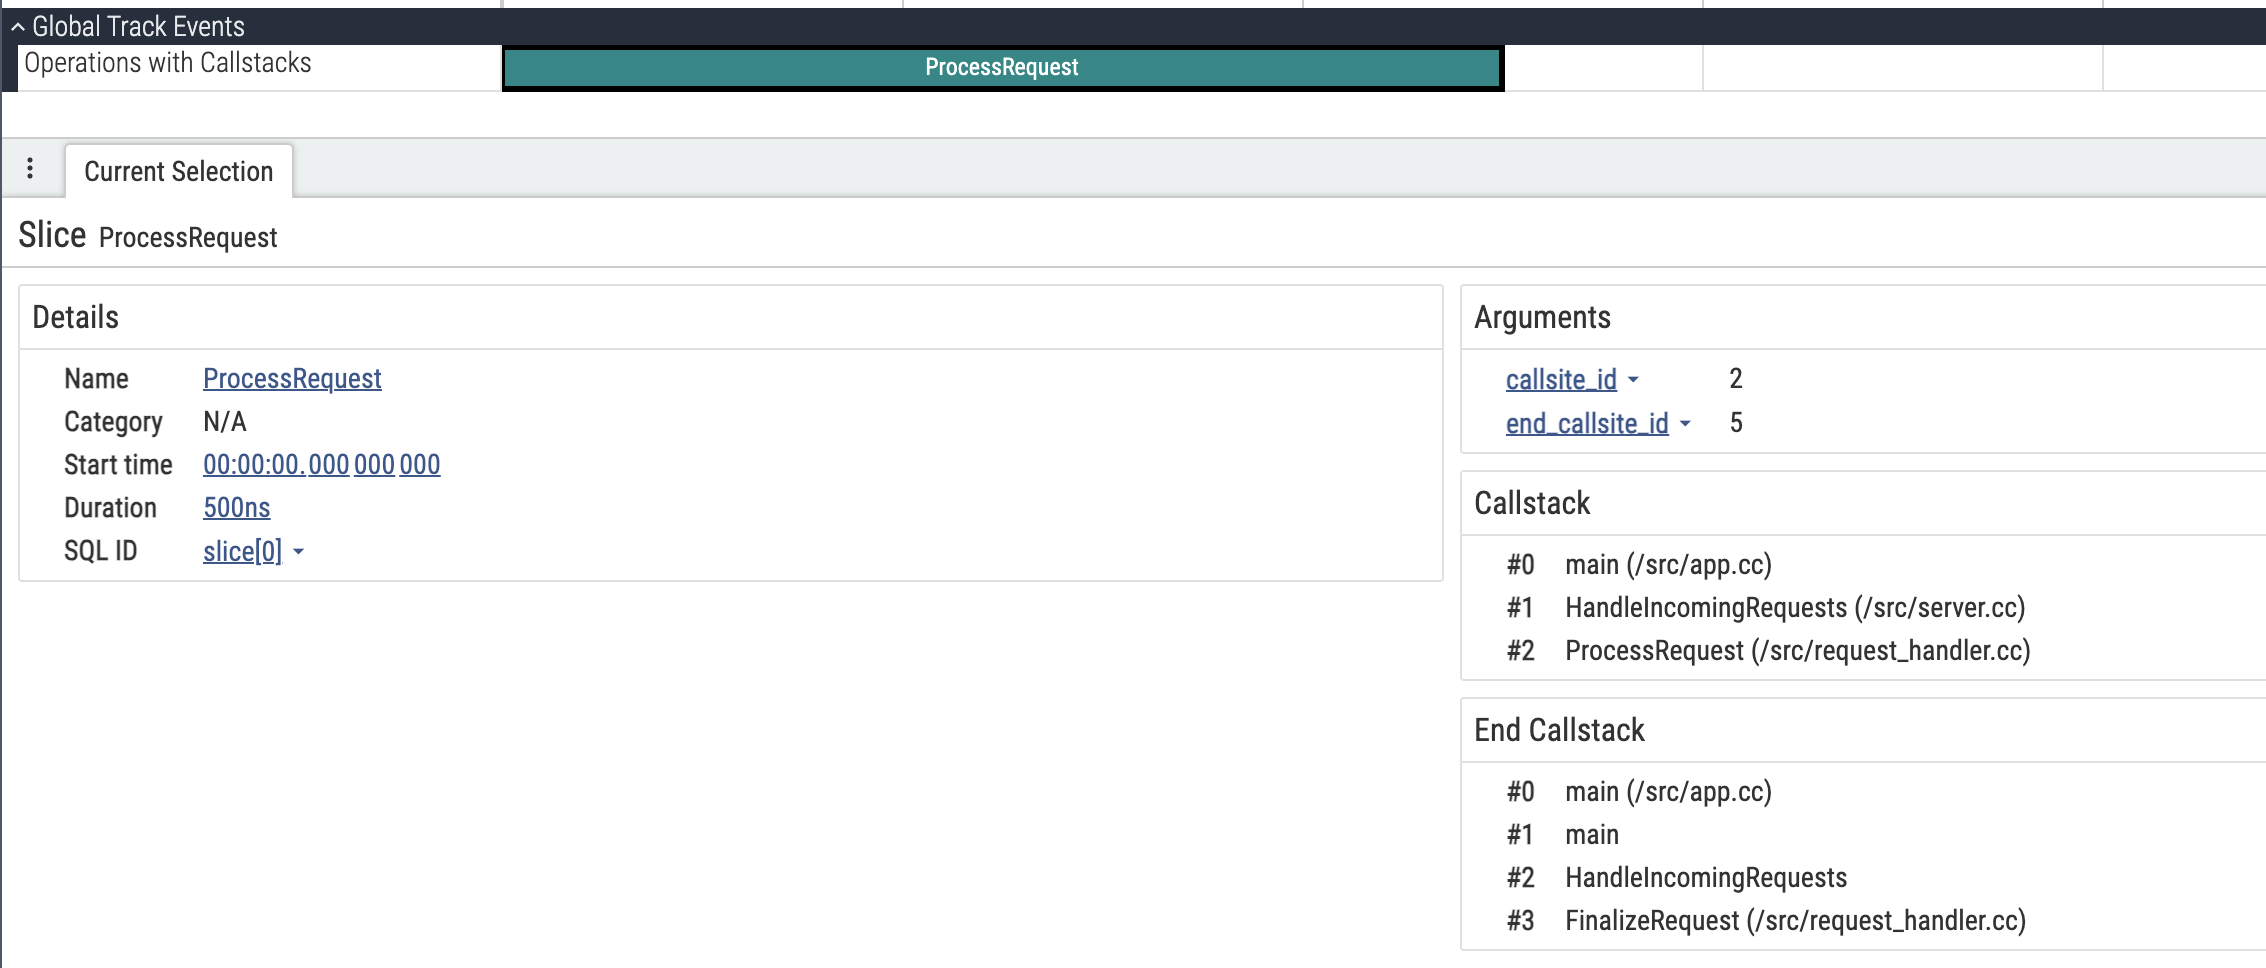
WHERE track.name = 'Nested Debug Annotations';Attaching Callstacks to Events
Callstacks (also known as stack traces or backtraces) show the sequence of function calls that led to a particular event. Adding callstacks to your trace events can be invaluable for understanding the code paths that triggered specific operations.
There are two different ways to associate a callstack to an event:
- Inline callstacks: Embed stack frames directly in each event with function names and optional source locations. This is simple and requires no setup, making it ideal when trace size is not a concern or callstacks are unique.
- Interned callstacks: Define the callstack structure once and reference it by ID from multiple events. This is much more efficient when callstacks repeat frequently or when you need binary/mapping information for symbolization.
This guide covers inline callstacks, which are perfect for getting started. For repeated callstacks or when you need binary mapping information, use interned callstacks instead.
Python Example
Each frame includes a function name, and optionally a source file and line number.
Copy the following Python code into the populate_packets(builder) function in
your trace_converter_template.py script.
Click to expand/collapse Python code
    # Define a unique UUID for your custom track
    CALLSTACK_TRACK_UUID = 98765432

    def emit_track_event(
        ts,
        event_type,
        name=None,
        frames=None,
    ):
        """Helper to write a TrackEvent with an optional inline callstack."""
        packet = builder.add_packet()
        packet.timestamp = ts
        packet.track_event.type = event_type
        packet.track_event.track_uuid = CALLSTACK_TRACK_UUID
        if name is not None:
            packet.track_event.name = name
        if frames:
            for function, source, line in frames:
                frame = packet.track_event.callstack.frames.add()
                frame.function_name = function
                if source:
                    frame.source_file = source
                if line is not None:
                    frame.line_number = line
        packet.trusted_packet_sequence_id = TRUSTED_PACKET_SEQUENCE_ID

    # 1. Define the Custom Track
    packet = builder.add_packet()
    packet.track_descriptor.uuid = CALLSTACK_TRACK_UUID
    packet.track_descriptor.name = "Operations with Callstacks"

    # 2. Create a slice with an inline callstack
    emit_track_event(
        ts=3000,
        event_type=TrackEvent.TYPE_SLICE_BEGIN,
        name="ProcessRequest",
        frames=[
            ("main", "/src/app.cc", 42),
            ("HandleIncomingRequests", "/src/server.cc", 128),
            ("ProcessRequest", "/src/request_handler.cc", 256),
        ],
    )

    # End the slice with a callstack captured at slice completion
    emit_track_event(
        ts=3500,
        event_type=TrackEvent.TYPE_SLICE_END,
        frames=[
            ("main", None, None),
            ("HandleIncomingRequests", None, None),
            ("FinalizeRequest", "/src/request_handler.cc", 512),
        ],
    )

    # 3. Another slice with a minimal callstack (just function names)
    emit_track_event(
        ts=4000,
        event_type=TrackEvent.TYPE_SLICE_BEGIN,
        name="AllocateMemory",
        frames=[
            ("main", None, None),
            ("HandleIncomingRequests", None, None),
            ("AllocateMemory", None, None),
        ],
    )

    # End the slice
    emit_track_event(
        ts=4200,
        event_type=TrackEvent.TYPE_SLICE_END,
    )
NOTE: Frames are ordered from outermost (bottom of stack, e.g.,
main()) to innermost (top of stack, where the event occurred).
When you provide a callstack on the slice end event, Trace Processor stores it
separately from the begin callstack (under the end_callsite_id argument in the
slice table). This is handy for quickly comparing entry/exit stacks.
After running the script, opening the generated my_custom_trace.pftrace in the
Perfetto UI will display the following output:
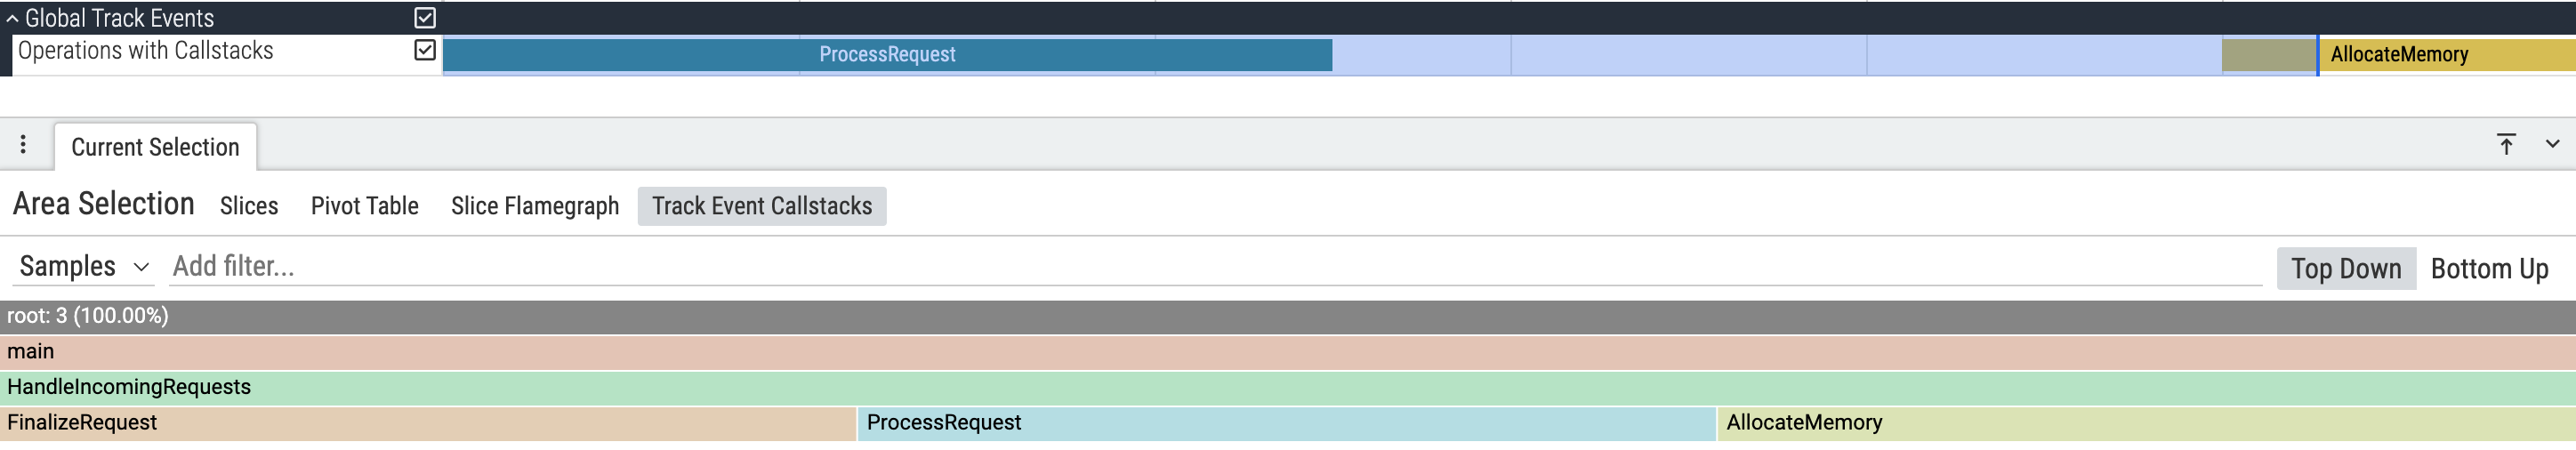
Note that you can also do an "area selection" (AKA box selection) to get a flamegraph of the callstacks:
Adding Trace-Level Metadata
Sometimes the data you want to attach isn't tied to any specific event, slice,
or track, but describes the trace as a whole, things like a build ID, the
version of the tool that produced the trace, or the hostname of the machine
that captured it. Perfetto's
TraceAttributes message lets
you attach this kind of trace-level metadata directly to a TracePacket, with
no track or timestamp required.
Trace-level metadata is useful for:
- Recording the version of the tool, library, or pipeline that produced the trace.
- Attaching a build ID or commit hash so a trace can be correlated with the code that generated it.
- Recording the hostname, device, or environment where the trace was captured.
- Any other producer-specific fact about the trace that doesn't belong on a particular slice, counter, or track.
To attach trace-level metadata:
- For each piece of metadata, add an
Attributeto thetrace_attributes.attributefield of aTracePacket, setting itskeyalong with eitherstring_valueorlong_value. - Namespace your keys with a reverse-domain-style prefix (e.g.
com.example.myapp.build_id) so they don't collide with keys used by other producers. - Emit these packets anywhere in the trace. No
timestamp,track_uuid, ortrusted_packet_sequence_idis required.
NOTE: Only string and 64-bit integer values are supported. If the same key is set more than once, whether within a single packet or across several packets, the last value written wins.
Besides writing packets, attributes can be set when recording a trace with
perfetto --add-attribute key=value; both end up in the same
trace_attribute.* rows. Trace archives can additionally be annotated via
the attributes section of a
trace manifest, which
uses its own manifest_attribute.* namespace.
Python Example
Copy the following Python code into the populate_packets(builder) function in
your trace_converter_template.py script.
Click to expand/collapse Python code
    def add_attribute(key, value):
        packet = builder.add_packet()
        attr = packet.trace_attributes.attribute.add()
        attr.key = key
        if isinstance(value, str):
            attr.string_value = value
        else:
            attr.long_value = value

    add_attribute("com.example.pipeline.version", "2.1.0")
    add_attribute("com.example.pipeline.num_workers", 8)
    add_attribute("com.example.hostname", "build-server-01")
Unlike the other examples on this page, there's no track or slice to look at
in the timeline view. Instead, after running the script and opening
my_custom_trace.pftrace in the Perfetto UI, these
attributes show up on the "Overview" page, reachable from the left sidebar,
under the "Info and Stats (advanced)" tab, alongside the rest of the trace's
metadata.
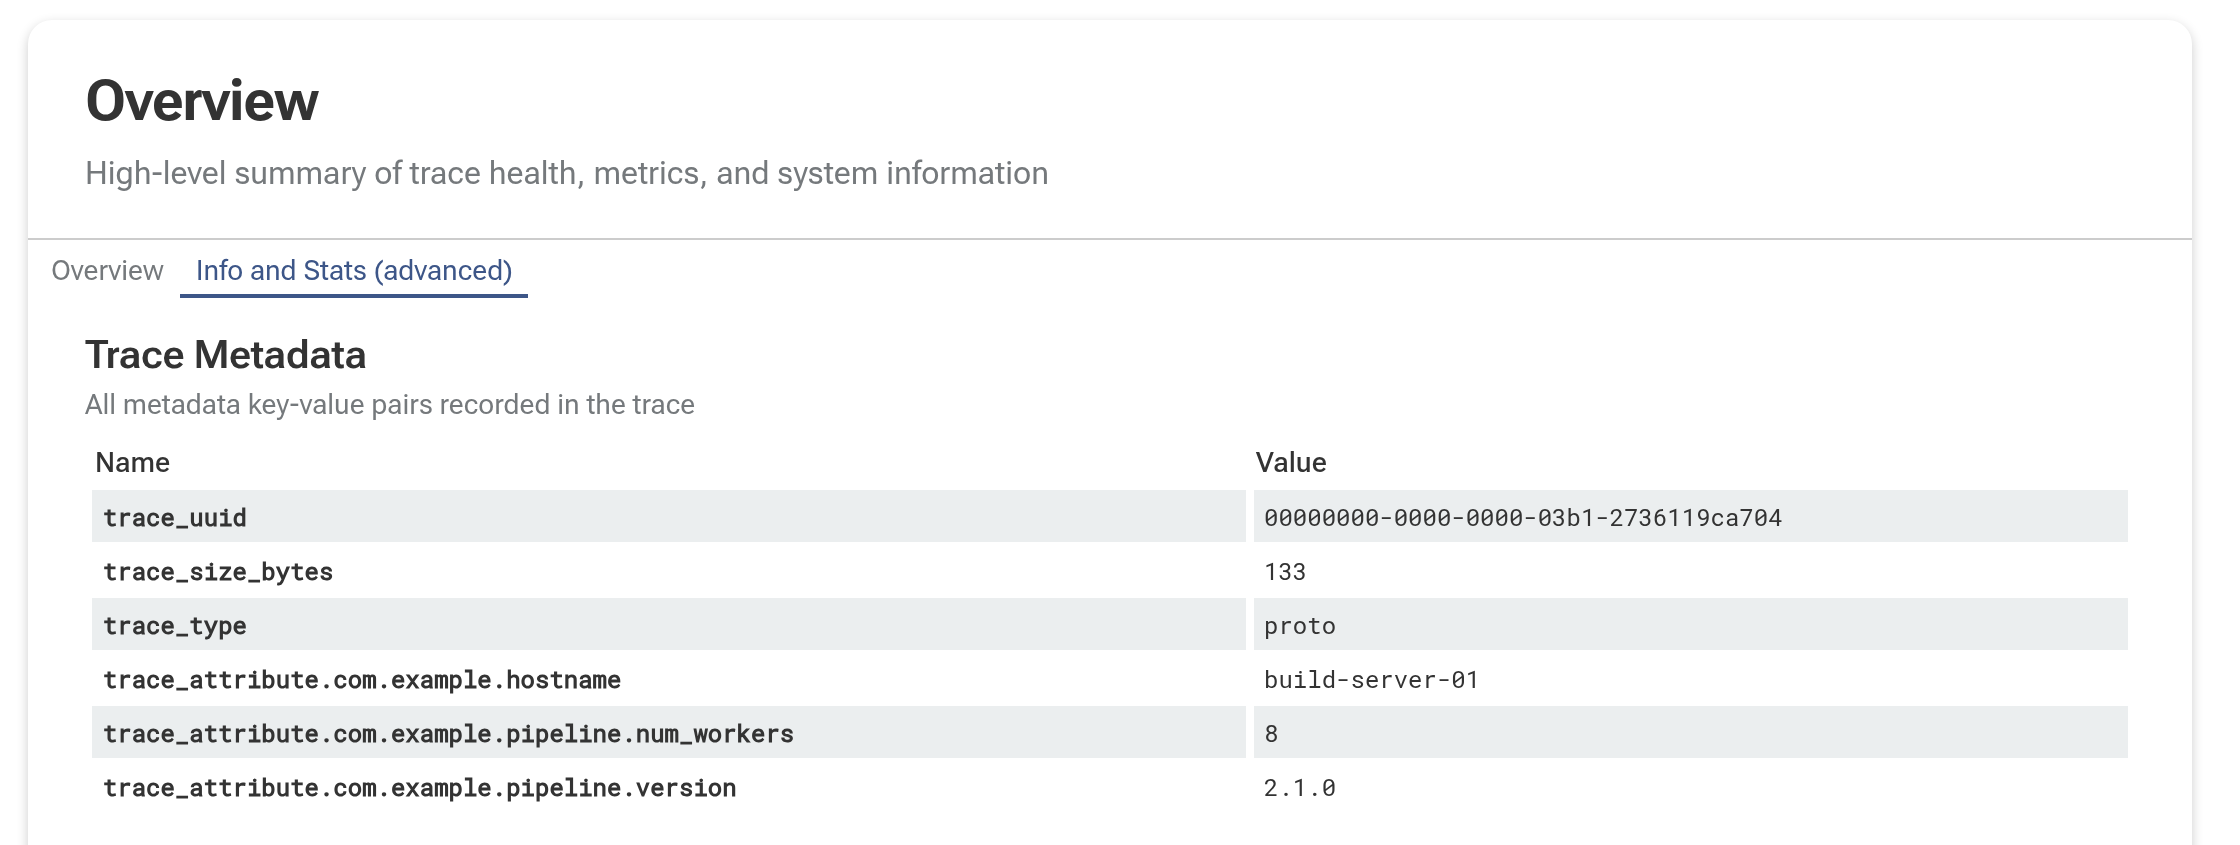
In Trace Processor, each attribute becomes a row in the metadata table, with
its key prefixed by trace_attribute. to keep custom attributes separate from
the built-in metadata. You can query trace-level metadata using SQL in the
Perfetto UI's Query tab or with
Trace Processor:
SELECT name, ifnull(str_value, cast(int_value as text)) AS value
FROM metadata
WHERE name GLOB 'trace_attribute.*';
Next Steps
You've now seen how to convert custom timestamped data into Perfetto traces
using Python and TrackEvent. With these techniques, you can represent slices,
counters, flows, track hierarchies, debug annotations, callstacks, and
trace-level metadata.
Once you have your custom data in the Perfetto trace format (.pftrace file),
you can:
- Explore advanced
TrackEventfeatures: For more detailed control over track and event appearance, interning, and other advanced capabilities of theTrackEventprotobuf, refer to the Writing synthetic traces using TrackEvent protobufs reference page. - Attach custom typed fields: If
debug_annotationsaren't expressive enough and you want your own schema, define a protobuf extension onTrackEventand set those fields alongside the built-ins. The Advanced Guide section on proto extensions walks through the Python workflow; see Extending TrackEvent with Custom Protos for background on the mechanism and how descriptors reach Trace Processor. - Visualize your trace: Open your generated
.pftracefile in the Perfetto UI to explore your data on an interactive timeline. - Analyze with SQL: Use the
Trace Processor to query your custom
trace data. Your custom tracks and events will populate standard tables like
slice,track,counter, etc. - Handle large datasets: If you are generating very large traces and want to avoid high memory usage, learn how to stream data directly to a file in the Advanced Guide's section on streaming.