Cookbook: Analysing Android Traces
This page will take you through some real world examples on how you can analyse issues with SQL and more advanced features of the Perfetto UI.
Using AI for trace analysis
NOTE: Googlers: use go/perfetto-ai-skills and go/perfetto-ai-skills-android-memory instead of the public setup instructions.
An AI coding agent with the Perfetto skill installed (setup) can go well beyond the recipes on this page: it can record traces from a connected device, answer ad-hoc questions about CPU, scheduling, and startup in plain English, and follow dedicated workflows for memory debugging.
Ad-hoc questions
Find the top causes of uninterruptible sleep for com.example.myapp in
trace.pftrace.
Which process had the highest peak memory usage in this trace?Memory debugging
Guided workflows for memory leaks, OOMs, churn, and allocation hot paths.
> Investigate object retention and potential leaks in /tmp/heap_dump.pftrace.

> Analyze native heap allocations and identify memory growth hot paths in
  /tmp/native_heap.pftrace.

> Record a Java heap dump of com.example.app from my connected device and
  find what is keeping memory alive.
The agent records the trace if needed, runs tested SQL to extract dominator paths, native callstacks, or allocation summaries, then searches your workspace for the suspect classes and points at the exact files and lines to fix.
Fleet clustering (many traces)
For OOM spikes across a device population, a clustering workflow finds the common leak signatures across a batch of heap dumps.
Here are 40 heap dumps of com.example.app in ~/dumps/. Cluster the memory
attribution paths and determine the common root causes.The agent extracts dominator paths from every trace, normalizes them into canonical class chains, clusters them (TF-IDF + K-Means), and collapses wrapper chains so you get a short list of root causes instead of per-dump noise.
Finding slices
Demonstrates:
- Querying slices.
- GLOB and similar operators.
- Common aggregators: COUNT, SUM, PERCENTILE.
- JOIN tables.
Slices seen in Perfetto’s timeline UI can also be queried with PerfettoSQL. Press “Query (SQL)” in the sidebar and enter this query:
SELECT *
FROM slice
WHERE name GLOB '*interesting_slice*'
LIMIT 10;
Navigating back to the timeline (press “Show timeline”) will show the results table in the bottom bar. You can click slice IDs to jump to the slice in the timeline.
PerfettoSQL supports multiple
pattern matching operators like
GLOB, LIKE, and REGEXP. You can also use different aggregators to generate
statistics on your selection.
SELECT
name,
COUNT(dur) AS count_slice,
-- Convert nanoseconds to milliseconds
AVG(dur) / 1000000 AS avg_dur_ms,
CAST(MAX(dur) AS DOUBLE) / 1000000 AS max_dur_ms,
CAST(MIN(dur) AS DOUBLE) / 1000000 AS min_dur_ms,
PERCENTILE(dur,50) / 1000000 AS P50_dur_ms,
PERCENTILE(dur,90) / 1000000 AS P90_dur_ms,
PERCENTILE(dur,99) / 1000000 AS P99_dur_ms
FROM slice
WHERE name REGEXP '.*interesting_slice.*'
GROUP BY name
ORDER BY count_slice DESC
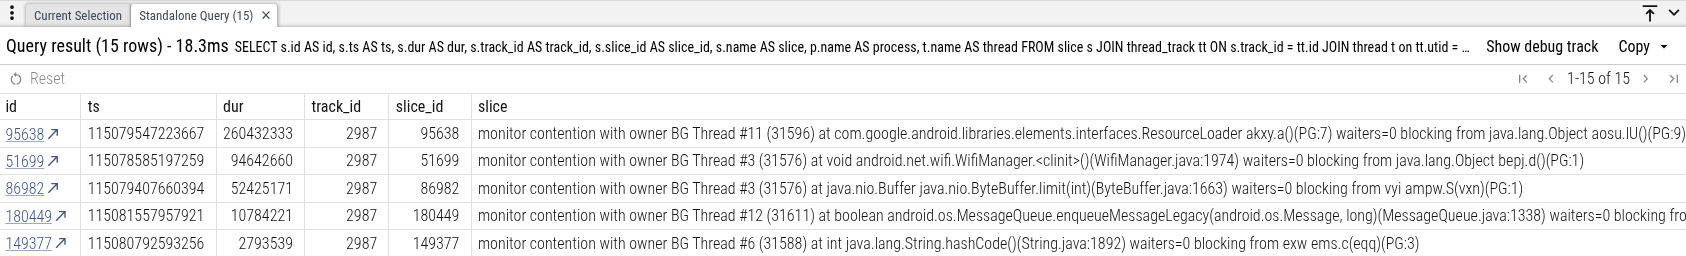
LIMIT 10;You can join information across multiple tables to surface more information in query results or to narrow down your search.
SELECT
  s.id AS id,
  s.ts AS ts,
  s.track_id AS track_id,
  s.slice_id AS slice_id,
  s.dur AS dur,
  s.name AS slice,
  p.name AS process,
  t.name AS thread
FROM slice s
JOIN thread_track tt ON s.track_id = tt.id
JOIN thread t on tt.utid = t.utid
JOIN process p on t.upid = p.upid
WHERE s.name LIKE '%interesting_slice%'
-- Only look for slices in your app's process
AND p.name = 'com.example.myapp'
-- Only look for slices on your app's main thread
AND t.is_main_thread
ORDER BY dur DESC;
After running the query in the SQL view, click “Show timeline” in the sidebar and the query results will appear in the bottom bar. Queries that include the slice columns id, ts, dur, track_id, and slice_id can link to slices in the Timeline view for easy navigation. Click the value under id and the timeline will jump straight to that slice.
Finding process metadata and fetching UPID
Demonstrates:
- Fetching
process_name,upidanduid. This data is used to get process level metrics from other tables - Using UPID for getting process specific metrics from other tables
- Using
GLOBfor regex based queries
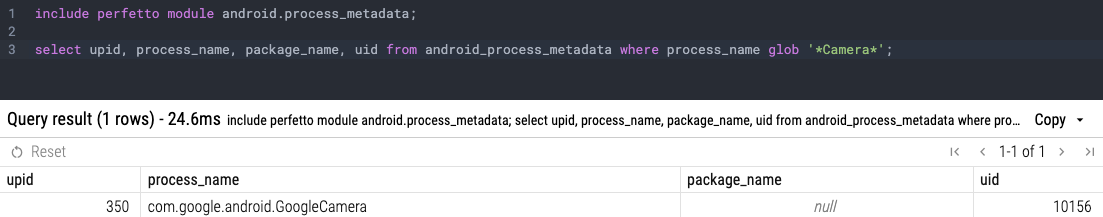
Knowing details like process name, package name or UPID come in handy as they serve as a basis for many other queries in Perfetto.
INCLUDE PERFETTO MODULE android.process_metadata;

SELECT
  upid,
  process_name,
  package_name,
  uid
FROM android_process_metadata
WHERE process_name GLOB '*Camera*'; -- GLOB search is case sensitive
Result:
Note: In case you don’t see the expected process, it may be happening
because GLOB search is case sensitive. So if you are not sure about your
process name, it is worth doing
select upid, process_name, package_name, uid from android_process_metadata to
find the UPID of your process.
UPID is the unique process ID which remains constant throughout the duration
of the trace as opposed to the PID (process ID) which can change. Many
standard library tables in
Perfetto such as android_lmk_events, cpu_cycles_per_process etc use UPID to
point to processes. This comes in handy specially when you need data filtered
against your process. UPID is also useful for performing JOIN operations with
other tables. Example for getting the cold start reason for GoogleCamera:
INCLUDE PERFETTO MODULE android.app_process_starts;
INCLUDE PERFETTO MODULE time.conversion;


SELECT
  process_name,
  upid,
  intent,
  reason,
  time_to_ms(total_dur)
FROM android_app_process_starts
WHERE upid = 844;
UID is the Android app User ID is also useful. In cases where a
package_name does not exist, standard library tables are populated in the
format uid=$X. For example, android_network_packets. Example for getting
network bytes transmitted for a process:
include perfetto module android.network_packets;

SELECT
  *
FROM android_network_packets
WHERE package_name = 'uid=12332';
Querying memory usage
Demonstrates:
- Using Perfetto standard library modules for memory analysis
- Querying memory usage per process
- Finding peak memory usage during a trace
Android provides comprehensive memory tracking through various metrics including
RSS (Resident Set Size), swap usage, and oom_score_adj
(OOM-killer adjustment scores,
a measure of process importance). The android.memory.process module provides
standardized tables for analyzing memory consumption patterns.
To query memory usage for a specific process like SystemUI:
INCLUDE PERFETTO MODULE android.memory.process;

SELECT *
FROM memory_oom_score_with_rss_and_swap_per_process
WHERE process_name GLOB 'com.android.systemui*';
Finding peak memory usage
To compute the peak memory usage for a process during the trace, use the MAX
aggregation. We highly recommend using anon_rss_and_swap as the primary metric
as it captures most failure conditions of "my app is using a lot of memory".
Note it doesn't track file/shmem, so if those are important to you, you should
use those metrics as well:
INCLUDE PERFETTO MODULE android.memory.process;

SELECT
  process_name,
  -- Recommended: Anonymous memory + swap is the best indicator of app memory
  -- pressure
  MAX(anon_rss_and_swap) / 1024.0 AS peak_anon_rss_and_swap_mb,
  -- FYI: Other memory metrics for additional context
  MAX(anon_rss) / 1024.0 AS peak_anon_rss_mb,
  MAX(file_rss) / 1024.0 AS peak_file_rss_mb,
  MAX(swap) / 1024.0 AS peak_swap_mb
FROM memory_oom_score_with_rss_and_swap_per_process
WHERE process_name GLOB 'com.android.systemui*'
GROUP BY process_name;
Note: For comprehensive documentation on available memory tables and metrics, refer to the Android Memory Process module documentation.
Find top causes for uninterruptible sleep
Demonstrates:
- Joining tables on PerfettoSQL unique IDs.
- SQL aggregation.
Thread tracks show a thread’s state, such as if it’s running, is runnable but not running, sleeping, etc. A common source of performance problems is when application threads enter “uninterruptible sleep”, i.e. call a kernel function that blocks on an uninterruptible condition.
To troubleshoot uninterruptible sleep you will need the following snippet in your Perfetto configuration when recording traces:
data_sources: {
    config {
        name: "linux.ftrace"
        target_buffer: 0
        ftrace_config {
            ftrace_events: "sched/sched_blocked_reason"
        }
    }
}
With this configured, when clicking on a thread state slice in uninterruptible sleep you will see in the bottom bar a field named “blocked_function”. Instead of clicking on individual slices, you can run a query to summarize the data:
SELECT blocked_function, COUNT(thread_state.id), SUM(dur)
FROM thread_state
JOIN thread USING (utid)
JOIN process USING (upid)
WHERE process.name = "com.google.android.youtube"
GROUP BY blocked_function
ORDER BY SUM(dur) DESC;
Find app startups blocked on monitor contention
Demonstrates:
PARTITIONto subdivide a table of slices by the value of a column.SPAN_JOINto create spans from the intersection of data from two tables.
In Android Java and Kotlin, “monitor contention” is when a thread attempts to
enter a synchronized section or call a synchronized method but another
thread has already acquired the lock (aka monitor) used for synchronization. The
example below demonstrates finding monitor contention slices that happened while
an app was starting that blocked the app’s main thread, thus delaying the app’s
startup.
INCLUDE PERFETTO MODULE android.monitor_contention;
INCLUDE PERFETTO MODULE android.startup.startups;

-- Join package and process information for startups
DROP VIEW IF EXISTS startups;
CREATE VIEW startups AS
SELECT startup_id, ts, dur, upid
FROM android_startups
JOIN android_startup_processes USING(startup_id);

-- Intersect monitor contention with startups in the same process.
-- This ensures that we only look at monitor contention in apps
-- that were starting up, and only during their startup phase.
DROP TABLE IF EXISTS monitor_contention_during_startup;
CREATE VIRTUAL TABLE monitor_contention_during_startup
USING SPAN_JOIN(android_monitor_contention PARTITIONED upid, startups PARTITIONED upid);

SELECT
  process_name,
  -- Convert duration from nanoseconds to milliseconds
  SUM(dur) / 1000000 AS sum_dur_ms,
  COUNT(*) AS count_contention
FROM monitor_contention_during_startup
WHERE is_blocked_thread_main
GROUP BY process_name
ORDER BY SUM(dur) DESC;
Process scheduling groups as debug tracks
Demonstrates:
- Projecting a string column into one or more columns using substring substitution.
- Creating a custom Debug Tracks in the Perfetto Timeline view.
- Views.
PARTITIONto subdivide slices by another column value.LEADto find the next event in a partition by timestamp order.
Android’s system_server will classify different app processes as belonging to
different scheduling groups. This is used to direct more system resources
towards more user-facing or otherwise latency-sensitive apps (such as “top” or
“foreground” apps) and away from other processes that are doing
latency-insensitive tasks in the background.
system_server will emit slices in the format of:
setProcessGroup <process> to <group>With PerfettoSQL you can turn these strings into structured data:
INCLUDE PERFETTO MODULE slices.with_context;
SELECT
ts,
dur,
SUBSTR(name, INSTR(name, ' ') + 1, INSTR(name, ' to ') - INSTR(name, ' ') - 1) as process_name,
SUBSTR(name, INSTR(name, ' to ') + 4) AS group_id
FROM thread_slice
WHERE process_name = 'system_server'
AND thread_name = 'OomAdjuster'
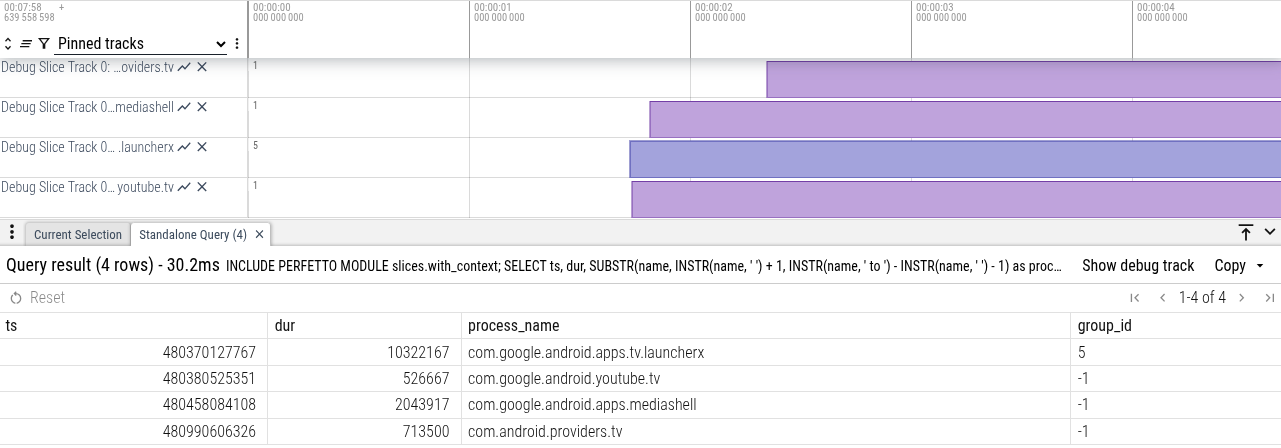
AND name LIKE 'setProcessGroup %';Using debug tracks you can add this information to the timeline. Press “Show timeline”. In the bottom bar, press “Show debug track” and configure:
- Track type: counter
- ts:
ts - value:
group_id - pivot:
process_name
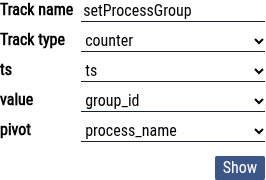
Press “Show” and you’ll see debug tracks generated from the results:
The integer values for groups are enumerated in SchedPolicy in
system/core/libprocessgroup/include/processgroup/sched_policy.h.
You can project the numeric values into string names:
INCLUDE PERFETTO MODULE slices.with_context;
SELECT
  ts,
  dur,
  SUBSTR(name, INSTR(name, ' ') + 1, INSTR(name, ' to ') - INSTR(name, ' ') - 1) as process_name,
  -- Resolve SchedPolicy
  CASE SUBSTR(name, INSTR(name, ' to ') + 4)
    WHEN '-1' THEN 'SP_DEFAULT'
    WHEN '0' THEN 'SP_BACKGROUND'
    WHEN '1' THEN 'SP_FOREGROUND'
    WHEN '2' THEN 'SP_SYSTEM'
    WHEN '3' THEN 'SP_AUDIO_APP'
    WHEN '4' THEN 'SP_AUDIO_SYS'
    WHEN '5' THEN 'SP_TOP_APP'
    WHEN '6' THEN 'SP_RT_APP'
    WHEN '7' THEN 'SP_RESTRICTED'
    WHEN '8' THEN 'SP_FOREGROUND_WINDOW'
    ELSE SUBSTR(name, INSTR(name, ' to ') + 4)
  END AS group_name
FROM thread_slice
WHERE process_name = 'system_server'
AND thread_name = 'OomAdjuster'
AND name LIKE 'setProcessGroup %';
Configure a debug track: 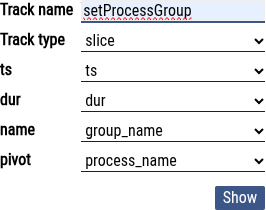
You’ll see debug tracks with human-readable names:

You’ll notice a problem - the durations of these tracks are short. The
durations indicate just the time it took system_server to change the process
group for these processes. You might want to see the duration that the process
was in that group, i.e. for the durations to extend until the next group update
or until the end of the trace. You can do this with LEAD by finding the next
slice, partitioned over process_name.
INCLUDE PERFETTO MODULE slices.with_context;

-- Create a view so we can refer to next_ts in the following query
DROP VIEW IF EXISTS setProcessGroup;
CREATE VIEW setProcessGroup AS
SELECT
  ts,
  dur,
  SUBSTR(name, INSTR(name, ' ') + 1, INSTR(name, ' to ') - INSTR(name, ' ') - 1) as process_name,
  LEAD(ts) OVER (PARTITION BY SUBSTR(name, INSTR(name, ' ') + 1, INSTR(name, ' to ') - INSTR(name, ' ') - 1) ORDER BY ts) AS next_ts,
  -- Resolve SchedPolicy
  CASE SUBSTR(name, INSTR(name, ' to ') + 4)
    WHEN '-1' THEN 'SP_DEFAULT'
    WHEN '0' THEN 'SP_BACKGROUND'
    WHEN '1' THEN 'SP_FOREGROUND'
    WHEN '2' THEN 'SP_SYSTEM'
    WHEN '3' THEN 'SP_AUDIO_APP'
    WHEN '4' THEN 'SP_AUDIO_SYS'
    WHEN '5' THEN 'SP_TOP_APP'
    WHEN '6' THEN 'SP_RT_APP'
    WHEN '7' THEN 'SP_RESTRICTED'
    WHEN '8' THEN 'SP_FOREGROUND_WINDOW'
    ELSE SUBSTR(name, INSTR(name, ' to ') + 4)
  END AS group_name
FROM thread_slice
WHERE process_name = 'system_server'
AND thread_name = 'OomAdjuster'
AND name LIKE 'setProcessGroup %';

SELECT
  ts,
  dur,
  process_name,
  group_name,
  next_ts,
  IIF(
    next_ts IS NOT NULL,
    -- Duration is from ts to next_ts
    next_ts - ts,
    -- Duration is from ts to the last timestamp seen in this trace
    (SELECT MAX(ts + dur) FROM slice) - ts
  ) AS dur_until_next
FROM setProcessGroup;
Configure your debug tracks again:
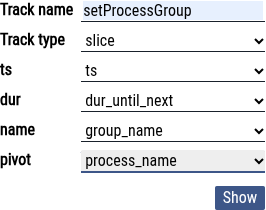
The debug tracks should now look like this:

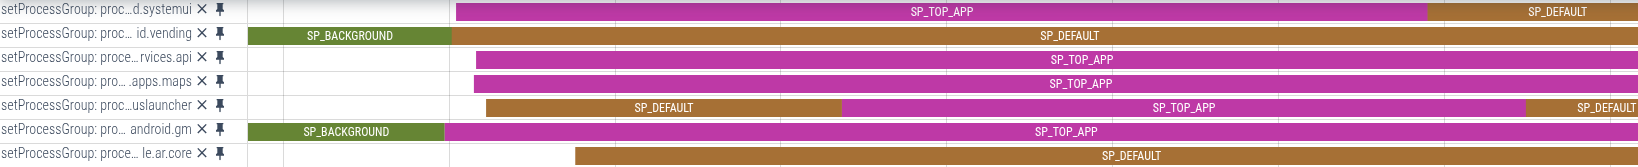
Here is an example from a busier trace, where you can see the same process being
assigned to different groups:
State of background jobs
Use android_job_scheduler_states table in Perfetto to collect job duration and
error metrics for jobs to identify whether background jobs are running as
expected.
Demonstrates:
- Filtering by process
- Using Perfetto standard library tables
- Including Perfetto modules for SQL queries
- Converting duration to milliseconds using
time_to_msfunction
JobScheduler is an Android system service that helps apps schedule background tasks (like data syncs or file downloads) efficiently. In Android development, Background jobs generally refer to any work that an application needs to perform without directly interacting with the user interface. This could include tasks like syncing data with a server, downloading files, processing images, sending analytics, or performing database operations.
To collect data for background jobs in android_job_scheduler_states table, you
will need the following snippet in your Perfetto configuration when recording
traces:
data_sources {
config {
name: "android.statsd"
statsd_tracing_config {
push_atom_id: ATOM_SCHEDULED_JOB_STATE_CHANGED
}
}
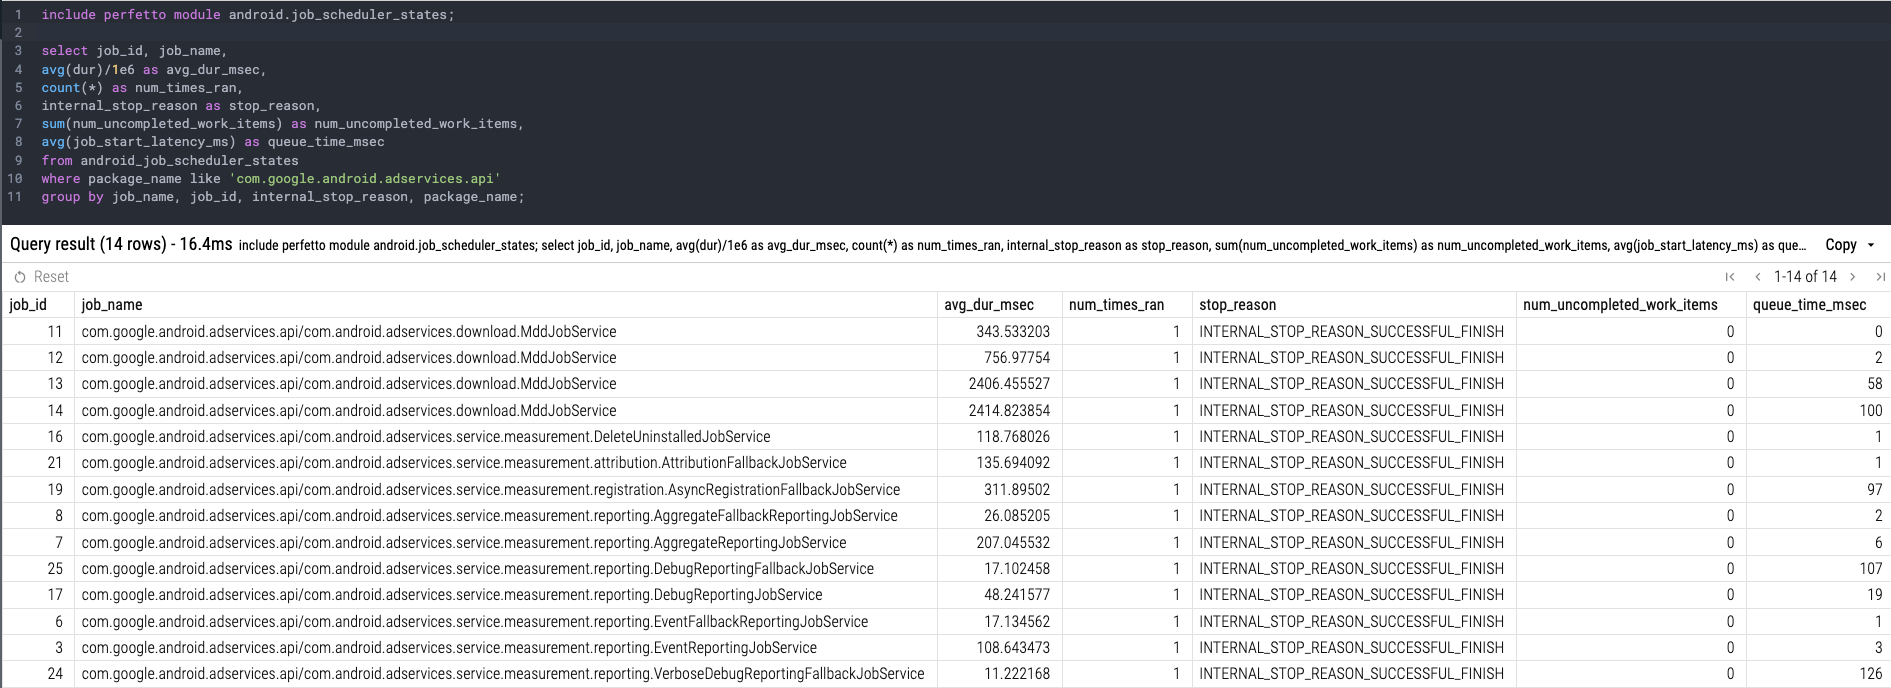
}INCLUDE PERFETTO MODULE android.job_scheduler_states;
SELECT
job_id,
job_name,
AVG(time_to_ms(dur)) AS avg_dur_ms,
COUNT(*) AS num_times_ran,
internal_stop_reason AS stop_reason,
SUM(num_uncompleted_work_items) AS num_uncompleted_work_items,
AVG(job_start_latency_ms) AS queue_time_ms
FROM android_job_scheduler_states
WHERE package_name = 'com.google.android.adservices.api'
GROUP BY job_name, job_id, internal_stop_reason, package_name;Long durations, frequent errors and retries indicate issues within your background jobs themselves (e.g., bugs in your code, unhandled exceptions, incorrect data processing). They can lead to increased resource consumption, battery drain and data usage on the user's device.
Long queue times mean your background jobs are waiting too long to execute. This can have downstream effects. For instance, if a job is responsible for syncing user data, long queue times could lead to stale information being displayed to the user or a delay in critical updates.
Result
Get CPU Utilization and processing information
To collect data related to events on CPU and utilization, you will need the following snippet in your Perfetto configuration when recording traces:
data_sources {
  config {
    name: "linux.ftrace"
    ftrace_config {
      ftrace_events: "sched/sched_process_exit"
      ftrace_events: "sched/sched_process_free"
      ftrace_events: "task/task_newtask"
      ftrace_events: "task/task_rename"
      ftrace_events: "sched/sched_switch"
      ftrace_events: "power/suspend_resume"
      ftrace_events: "sched/sched_blocked_reason"
      ftrace_events: "sched/sched_wakeup"
      ftrace_events: "sched/sched_wakeup_new"
      ftrace_events: "sched/sched_waking"
      ftrace_events: "sched/sched_process_exit"
      ftrace_events: "sched/sched_process_free"
      ftrace_events: "task/task_newtask"
      ftrace_events: "task/task_rename"
      ftrace_events: "power/cpu_frequency"
      ftrace_events: "power/cpu_idle"
      ftrace_events: "power/suspend_resume"
      symbolize_ksyms: true
      disable_generic_events: true
    }
  }
}
data_sources {
  config {
    name: "linux.process_stats"
    process_stats_config {
      scan_all_processes_on_start: true
    }
  }
}
data_sources {
  config {
    name: "linux.sys_stats"
    sys_stats_config {
      cpufreq_period_ms: 250
    }
  }
}
Process Level CPU utilization
CPU utilization for an Android device refers to the percentage of time the device's CPU is actively working to execute instructions and run programs. CPU utilization can be measured using CPU cycles which is directly proportional to the time taken by the CPU to complete a task. High CPU utilization by a specific Android process indicates that it is demanding a significant portion of the CPU's processing power.
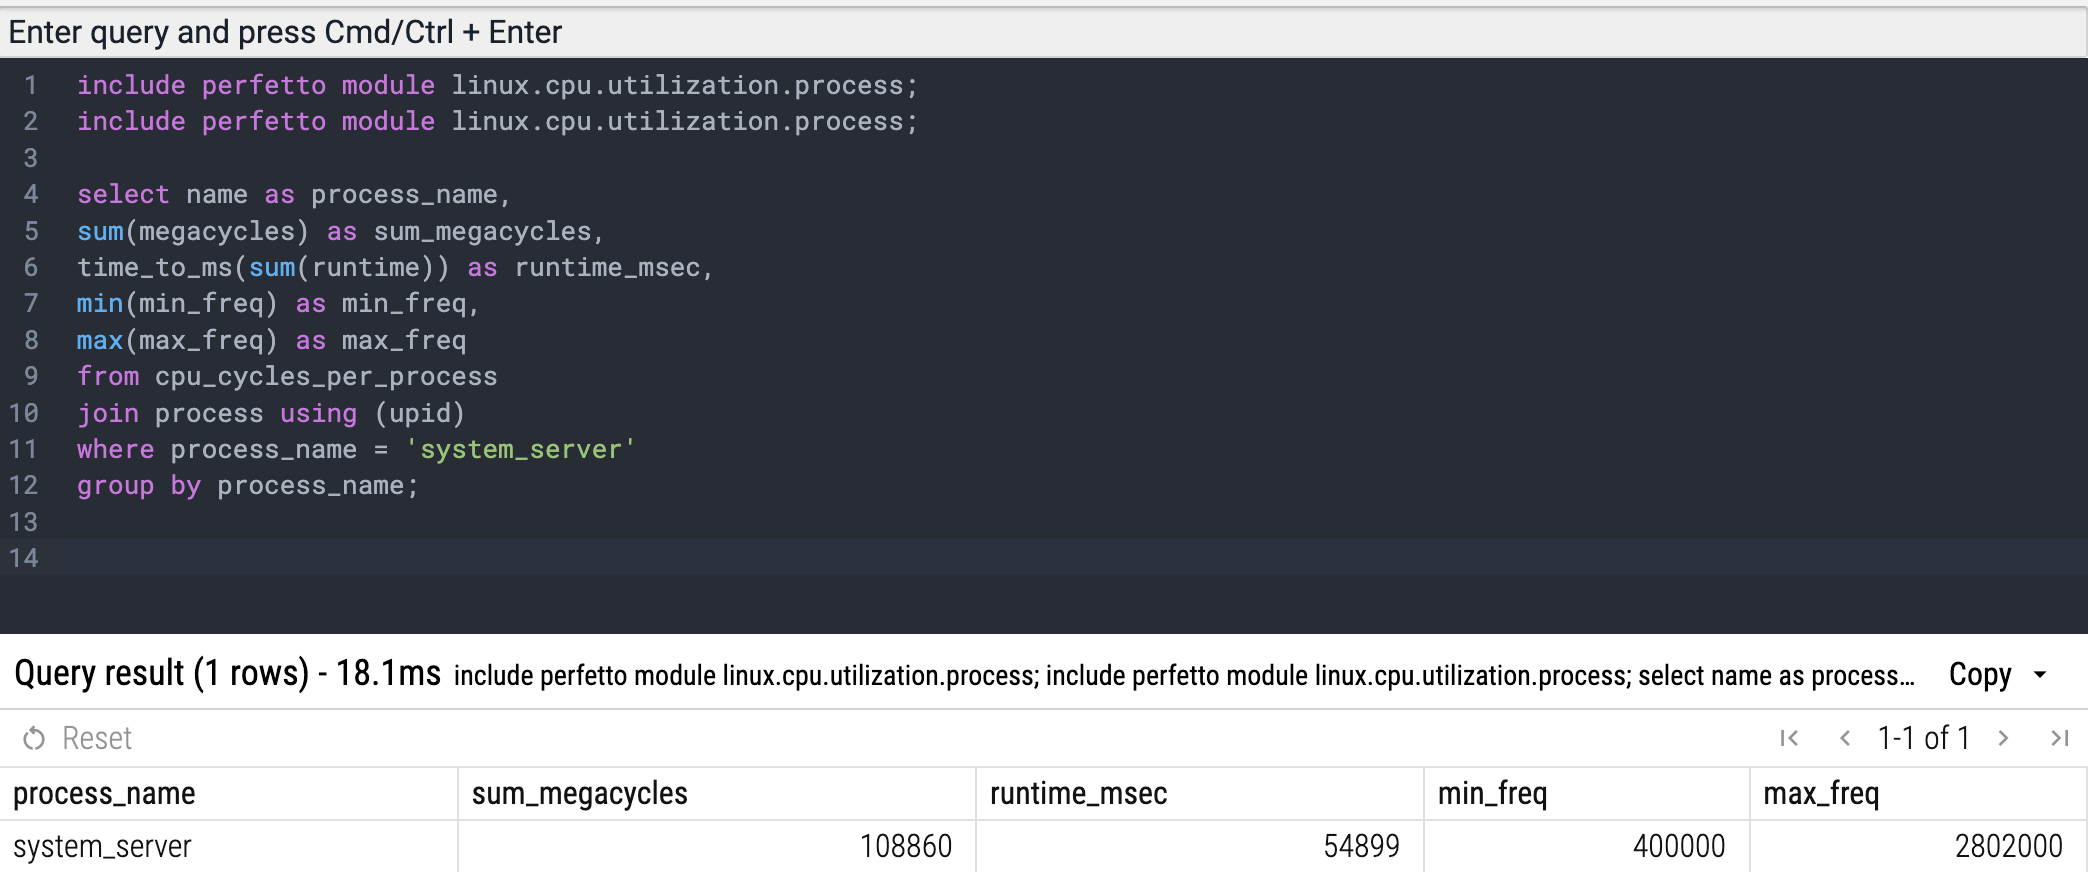
INCLUDE PERFETTO MODULE linux.cpu.utilization.process;

select
  name AS process_name,
  SUM(megacycles) AS sum_megacycles,
  time_to_ms(SUM(runtime)) AS runtime_msec,
  MIN(min_freq) AS min_freq,
  MAX(max_freq) AS max_freq
FROM cpu_cycles_per_process
JOIN process USING (upid)
WHERE process_name = 'system-server'
GROUP BY process_name;
Result:
Slice Level CPU utilisation
To see cpu utilisation for an interesting slice, use the following query:
INCLUDE PERFETTO MODULE linux.cpu.utilization.slice;

select
  slice_name,
  SUM(megacycles)
FROM cpu_cycles_per_thread_slice
WHERE slice_name GLOB '*interesting_slice*'  -- or cpu_cycles_per_thread_slice.id=<id of interesting slice>
GROUP BY slice_name;
Or to check slice utilization for all the slices of your process:
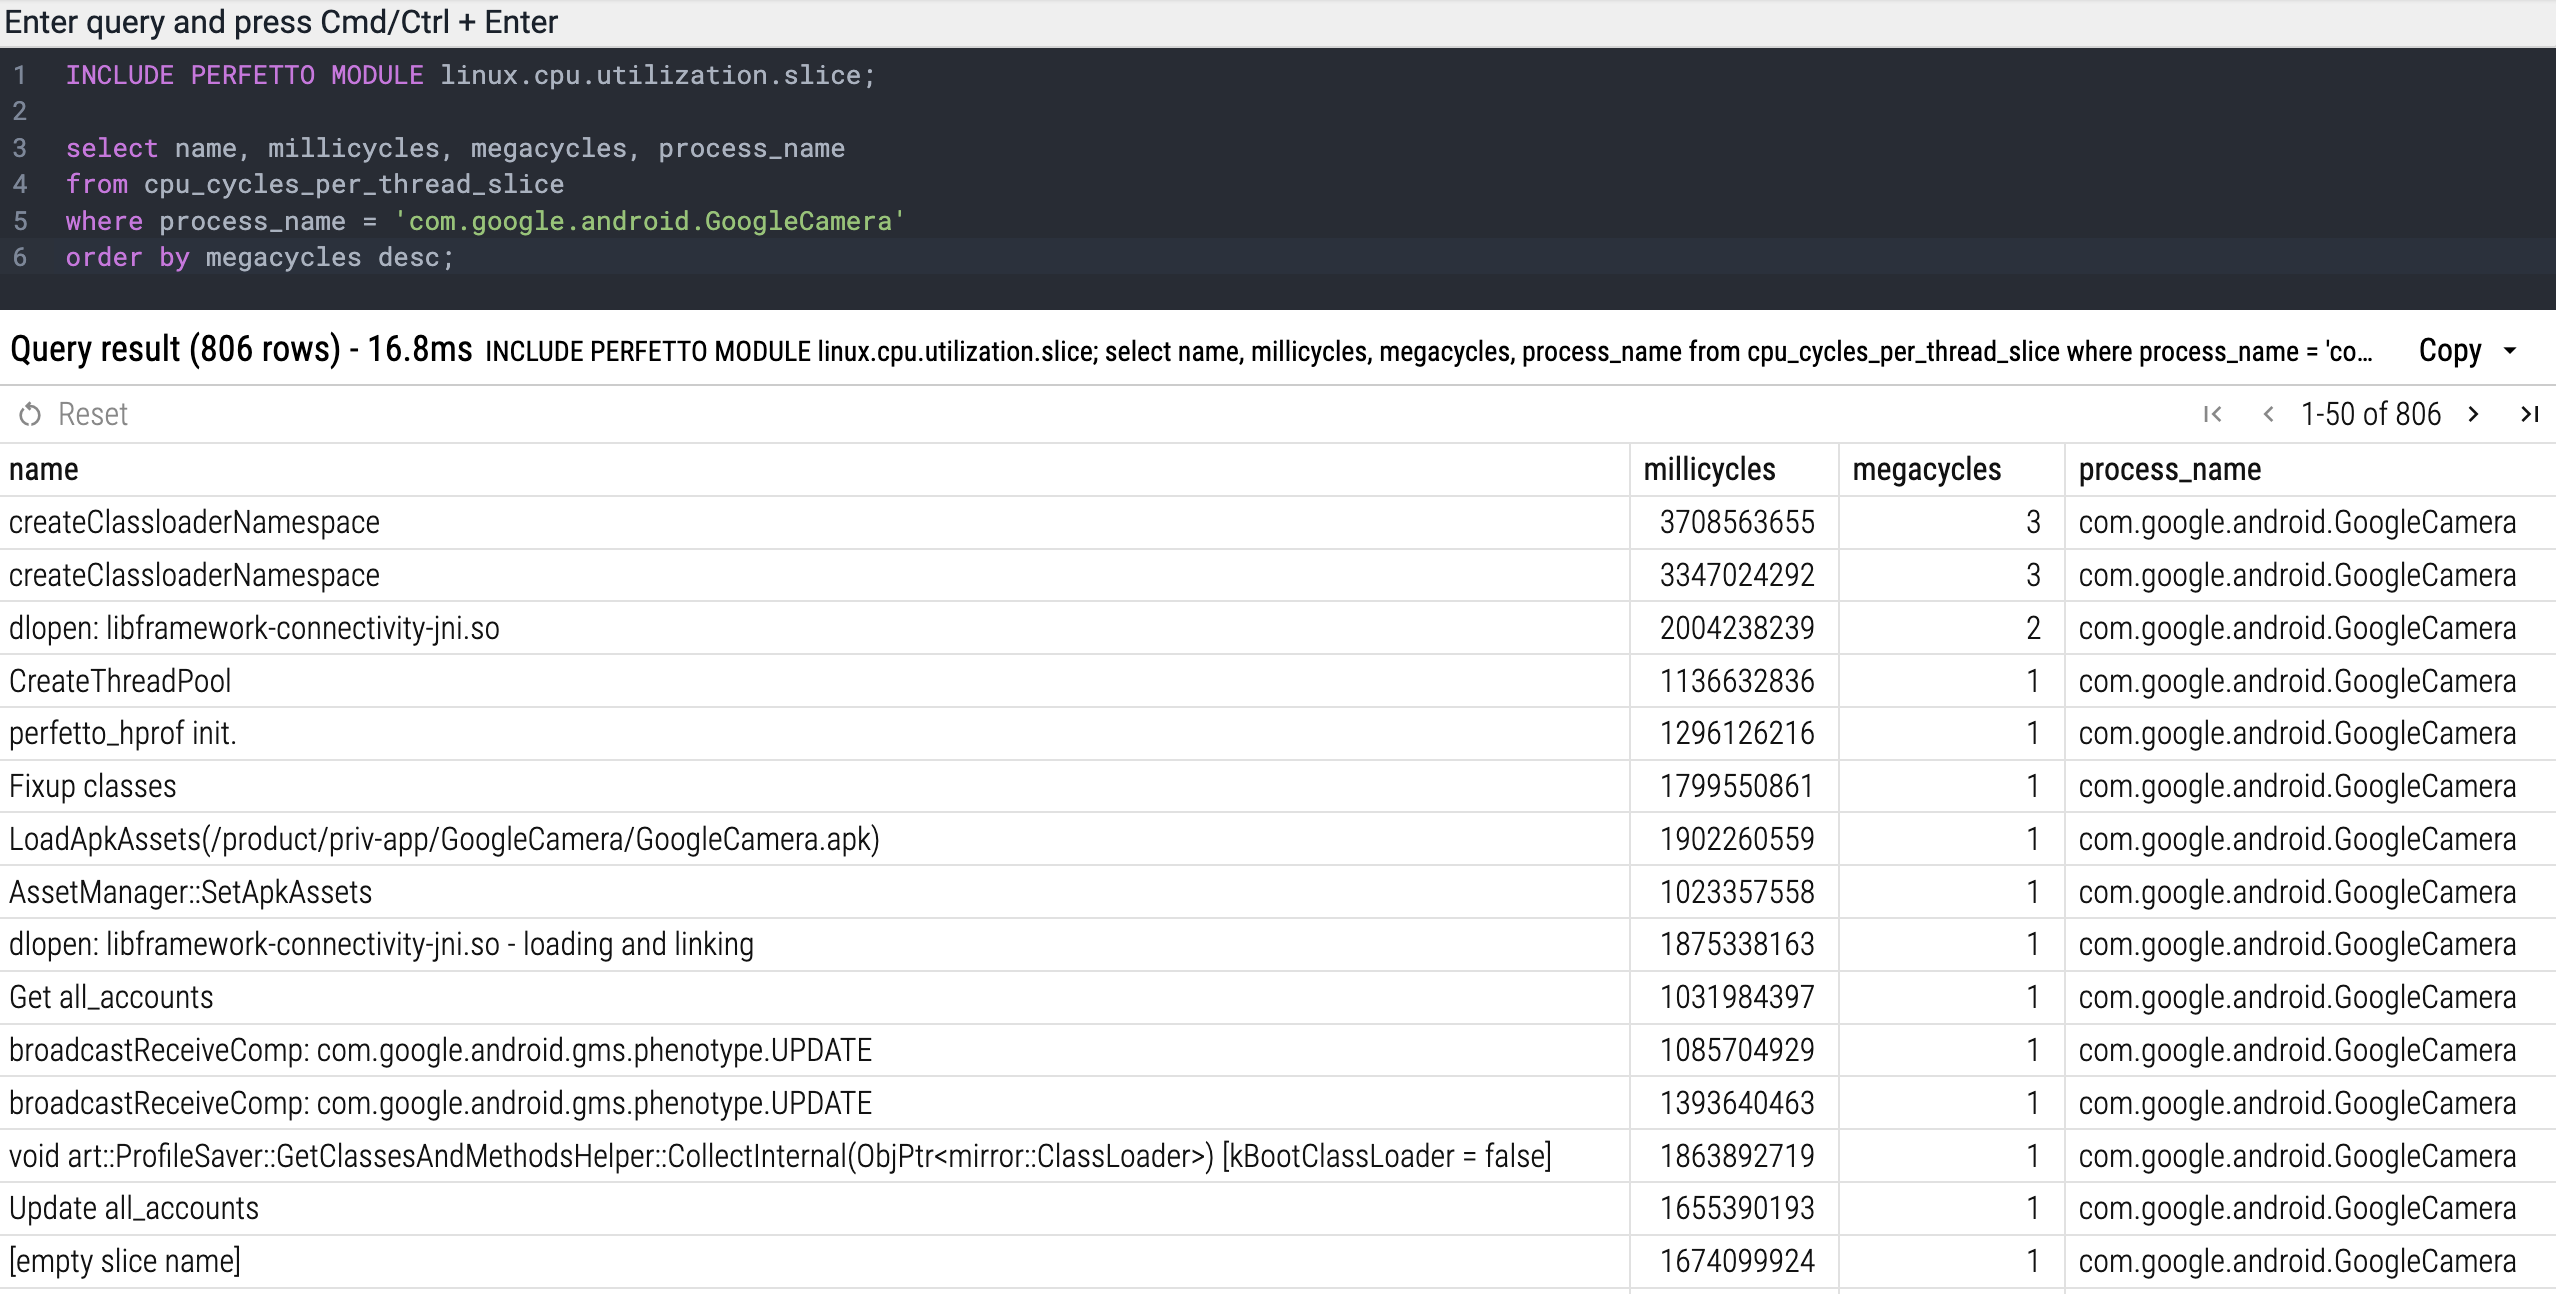
INCLUDE PERFETTO MODULE linux.cpu.utilization.slice;

SELECT
  name,
  millicycles,
  megacycles,
  process_name
FROM cpu_cycles_per_thread_slice
WHERE process_name = 'com.google.android.GoogleCamera'
ORDER BY megacycles DESC;
Result:
The number of times cpu exits idle state
When the CPU is idle, it enters a low-power state to conserve energy. Wake-ups disrupt this state, forcing the CPU to ramp up its activity and consume more power.
The number of times cpu exits idle state during the trace duration:
select
  COUNT(*) as num_idle_exits
FROM counter AS c
LEFT JOIN cpu_counter_track AS t
ON c.track_id = t.id
WHERE t.name = 'cpuidle'
AND value = 4294967295;
Value 4294967295 (0xffffffff) represents back to not-idle.
When a process wakes the CPU from idle state excessively, it can have the following adverse effects:
- Battery drain: Frequent wake-ups can significantly drain the battery
- Latency: Waking up the CPU from idle introduces latency, as it takes time for the CPU to transition from a low-power state to an active state.
- Context Switching: Each wake-up might involve context switching, where the CPU has to save the state of the current task and load the state of the new task, further adding to the overhead.
Number of events scheduled on the cpu by your process
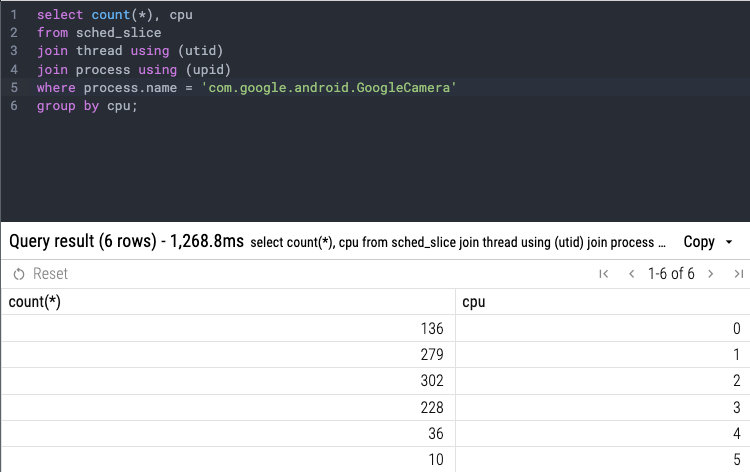
To see if your process's threads are being evenly distributed across available CPU cores you can check the number of events scheduled on the cpu by your process per cpu core:
SELECT
  COUNT(*),
  cpu
FROM sched_slice
JOIN thread USING (utid)
JOIN process USING (upid)
WHERE process.name = 'com.google.android.GoogleCamera'
GROUP BY cpu;
Result: