
TRACED_PROBES(8)
NAME
traced_probes - System & OS Probes
DESCRIPTION
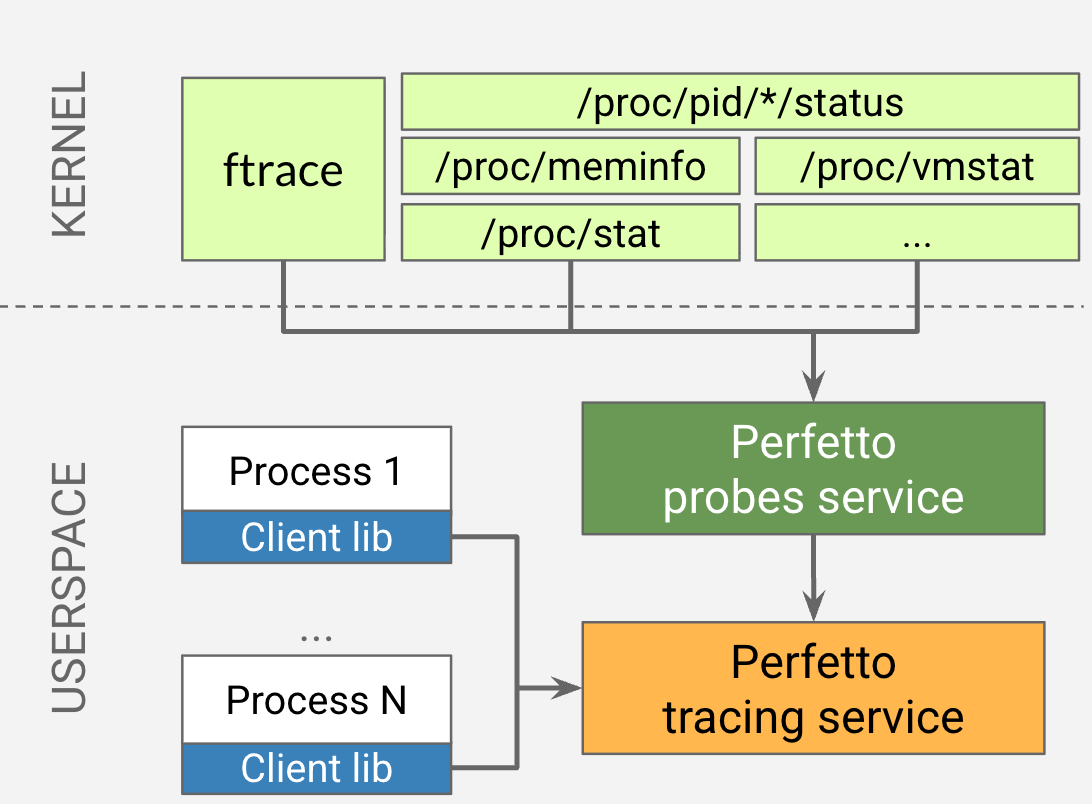
traced_probes is a specialized daemon that acts as a privileged
Producer in the Perfetto
architecture. While any application can act as a producer to contribute its own
trace data, traced_probes is specifically responsible for collecting
system-level and kernel-level data that typically requires elevated privileges.
Relationship with traced
traced_probes is a client of the traced
service. It connects to traced's producer socket and registers a set of data
sources. traced then sends requests to traced_probes to start or stop these
data sources as part of a tracing session.
This separation of concerns is a key part of Perfetto's design. traced is the
central manager, while traced_probes is a specialized data provider. This
decoupled architecture allows for multiple, independent producers and consumers
to interact with the tracing system simultaneously without interfering with each
other.
Security and Privileges
traced_probes often needs to run with elevated privileges (e.g., root or
system user on Android) to access kernel interfaces like debugfs or /proc.
Separating these high-privilege probes into their own daemon is a key part of
Perfetto's security model. It ensures that only a minimal amount of code runs
with high privileges, adhering to the principle of least privilege.
Configuration
The data sources provided by traced_probes are configured within the main
trace configuration protobuf that is sent to traced. For example, to enable
ftrace, you would include an FtraceConfig within the DataSourceConfig for
the linux.ftrace data source.
Data Sources
traced_probes provides a wide range of data sources, collecting system-level
and kernel-level data. The configuration for these data sources is specified in
the data_sources section of the overall trace configuration. Each data source
has its own configuration message within a data_source_config block.
Here is an example of the general structure:
data_sources: {
    config {
        name: "linux.ftrace"
        ftrace_config {
            # ... ftrace-specific settings
        }
    }
}
data_sources: {
    config {
        name: "linux.process_stats"
        process_stats_config {
            # ... process_stats-specific settings
        }
    }
}
Below is a detailed list of the main data sources provided by traced_probes,
separated by platform.
Linux Data Sources
These data sources are available on Linux-based systems, including Android.
Here is an example of a trace config enabling several Linux data sources:
# Example of a trace config enabling several Linux data sources.
data_sources: {
    config {
        name: "linux.ftrace"
        ftrace_config {
          ftrace_events: "sched/sched_switch"
          ftrace_events: "power/cpu_idle"
        }
    }
}
data_sources: {
    config {
        name: "linux.process_stats"
        process_stats_config {
          scan_all_processes_on_start: true
          proc_stats_poll_ms: 1000
        }
    }
}
data_sources: {
    config {
        name: "linux.sys_stats"
        sys_stats_config {
          meminfo_period_ms: 1000
          vmstat_period_ms: 1000
        }
    }
}
linux.ftrace (Kernel Tracing)
- Description: This is the primary data source for high-frequency kernel events. It enables and reads raw ftrace data from the Linux kernel's ftrace interface, providing insights into process scheduling, system calls, interrupts, and other kernel activities.
- Configuration Example:
data_sources: { config { name: "linux.ftrace" ftrace_config { ftrace_events: "sched/sched_switch" ftrace_events: "power/cpu_idle" ftrace_events: "sched/sched_waking" } } } - Configuration: Configured via
FtraceConfigwithin theDataSourceConfig. Key options include:ftrace_events: List of ftrace events to enable (e.g.,sched/sched_switch).atrace_categories,atrace_apps: For Android, enables userspace Atrace categories and apps.syscall_events: Specific syscalls to trace.enable_function_graph: Enables kernel function graph tracing.compact_sched: Enables compact encoding for scheduler events.symbolize_ksyms: Enables kernel symbolization.print_filter: Filtersftrace/printevents based on content.
linux.process_stats (Process and Thread Statistics)
- Description: Collects detailed process and thread-level statistics from
the
/procfilesystem. It provides both a snapshot of the process tree and periodic memory/CPU counters. - Configuration Example:
data_sources: { config { name: "linux.process_stats" process_stats_config { scan_all_processes_on_start: true proc_stats_poll_ms: 1000 } } } - Configuration: Configured via
ProcessStatsConfig. Key options include:record_thread_names: Record thread names.scan_all_processes_on_start: Dump the entire process tree at the start.resolve_process_fds: Resolve file descriptor paths.scan_smaps_rollup: Read/proc/[pid]/smaps_rollup.record_process_age: Record process start time.record_process_runtime: Record user and kernel mode CPU times.record_process_dmabuf_rss: Record DMA buffer RSS.proc_stats_poll_ms: Polling interval for periodic stats.proc_stats_cache_ttl_ms: Time-to-live for cached stats.quirks: Special behaviors (e.g.,DISABLE_ON_DEMAND).
linux.sys_stats (System-Wide Statistics)
- Description: Collects system-wide statistics by periodically polling
various files in
/procand/sys. - Configuration Example:
data_sources: { config { name: "linux.sys_stats" sys_stats_config { meminfo_period_ms: 1000 vmstat_period_ms: 1000 stat_period_ms: 1000 } } } - Configuration: Configured via
SysStatsConfig. Allows fine-grained control over which counters to collect and their polling frequencies (e.g.,meminfo_period_ms,vmstat_period_ms,stat_counters).
linux.sysfs_power (Power and Battery Information)
- Description: Collects power and battery statistics using the Linux sysfs interface.
- Configuration Example:
data_sources: { config { name: "linux.sysfs_power" } } - Configuration: This data source does not have a specific configuration proto.
linux.inode_file_map (Inode to File Path Mapping)
- Description: Maps inode numbers to file paths, which is useful for correlating I/O events with the files being accessed.
- Configuration Example:
data_sources: { config { name: "linux.inode_file_map" inode_file_config { scan_interval_ms: 10000 scan_delay_ms: 5000 scan_batch_size: 1000 } } } - Configuration:
InodeFileConfigallows specifyingscan_mount_points,mount_point_mapping(to remap scan roots),scan_interval_ms,scan_delay_ms,scan_batch_size, anddo_not_scan.
metatrace (Perfetto Self-Tracing)
- Description: A self-tracing data source that records events within Perfetto itself, useful for debugging and performance analysis of the tracing system.
- Configuration Example:
data_sources: { config { name: "metatrace" } } - Configuration: No specific configuration in
DataSourceConfig.
linux.system_info (System Information)
- Description: Records general information about the system, such as CPU details and kernel version.
- Configuration Example:
data_sources: { config { name: "linux.system_info" } } - Configuration: No specific configuration in
DataSourceConfig.
Android Data Sources
These data sources are available only on Android.
Here is an example of a trace config enabling several Android data sources:
# Example of a trace config enabling several Android data sources.
data_sources: {
    config {
        name: "android.power"
        android_power_config {
          battery_poll_ms: 1000
          battery_counters: BATTERY_COUNTER_CHARGE
          collect_power_rails: true
        }
    }
}
data_sources: {
    config {
        name: "android.log"
        android_log_config {
          log_ids: LID_DEFAULT
          log_ids: LID_SYSTEM
        }
    }
}
data_sources: {
    config {
        name: "android.packages_list"
    }
}
android.power (Power and Battery Information)
- Description: Collects power and battery statistics using Android-specific HALs.
- Configuration Example:
data_sources: { config { name: "android.power" android_power_config { battery_poll_ms: 1000 battery_counters: BATTERY_COUNTER_CHARGE battery_counters: BATTERY_COUNTER_CAPACITY_PERCENT collect_power_rails: true } } } - Configuration:
AndroidPowerConfigallows enabling specific battery counters (battery_counters), power rails (collect_power_rails), energy estimation breakdown (collect_energy_estimation_breakdown), and entity state residency (collect_entity_state_residency).
android.log (Android Logcat)
- Description: Streams log messages from Android's logcat buffer into the trace.
- Configuration Example:
data_sources: { config { name: "android.log" android_log_config { log_ids: LID_DEFAULT log_ids: LID_SYSTEM min_prio: PRIO_INFO filter_tags: "ActivityManager" } } } - Configuration:
AndroidLogConfigallows filtering by log IDs (log_ids) and tags (filter_tags), and setting a minimum priority (min_prio).
android.system_property (Android System Properties)
- Description: Collects the state of Android system properties.
- Configuration Example:
data_sources: { config { name: "android.system_property" android_system_property_config { poll_ms: 1000 property_name: "debug.tracing.screen_state" } } } - Configuration:
AndroidSystemPropertyConfigallows specifyingproperty_names to monitor and apoll_msinterval.
android.packages_list (Android Package Information)
- Description: Dumps information about installed packages on Android.
- Configuration Example:
data_sources: { config { name: "android.packages_list" packages_list_config { package_name_filter: "com.android.systemui" package_name_filter: "com.google.android.apps.nexuslauncher" } } } - Configuration:
PackagesListConfigallows filtering bypackage_name_filterand can be configured toonly_write_on_cpu_use_every_ms(polling mode) or dump all at start.
android.game_interventions (Android Game Intervention List)
- Description: Dumps the game intervention list from the package manager on Android.
- Configuration Example:
data_sources: { config { name: "android.game_interventions" android_game_intervention_list_config { package_name_filter: "com.example.mygame" } } } - Configuration:
AndroidGameInterventionListConfigallows filtering bypackage_name_filter.
android.cpu.uid (Per-UID CPU Time)
- Description: Collects per-UID CPU time from the kernel.
- Configuration Example:
data_sources: { config { name: "android.cpu.uid" cpu_per_uid_config { poll_ms: 1000 } } } - Configuration:
CpuPerUidConfigallows setting thepoll_msinterval.
android.kernel_wakelocks (Kernel Wakelocks)
- Description: Collects kernel wakelock information.
- Configuration Example:
data_sources: { config { name: "android.kernel_wakelocks" kernel_wakelocks_config { poll_ms: 1000 } } } - Configuration:
KernelWakelocksConfigallows setting thepoll_msinterval.
android.polled_state (Android Initial Display State)
- Description: Records the initial display state (e.g., screen on/off, brightness) on Android.
- Configuration Example:
data_sources: { config { name: "android.polled_state" android_polled_state_config { poll_ms: 500 } } } - Configuration:
AndroidPolledStateConfigallows setting apoll_msinterval.
android.statsd (Android StatsD Atoms)
- Description: Collects StatsD atoms from the binder interface on Android.
- Configuration Example:
data_sources: { config { name: "android.statsd" statsd_tracing_config { pull_config { pull_atom_id: 10000 # Example pull atom pull_frequency_ms: 1000 } push_atom_id: 10037 # Example push atom } } } - Configuration:
StatsdTracingConfigallows specifyingpull_config(for pull atoms with frequency and packages) andpush_atom_id(for push atoms).